
Ahh, the Doji…
One of the LEAST studied candlestick patterns in all of forex – and one of the most overlooked too.
Few traders take the time to really understand the Doji and the information it gives about price… it just doesn’t have the ‘swag’ of the other candlesticks patterns, you know. However, it’s highly important to learning price action and can give you some incredible insights if you learn how it works.
And that’s what we’re going to do today…
In this post, I’m going to give you a detailed breakdown of the Doji candlestick along with its many variations so you can see what it is, why it forms, and what it signals.
By the end, you should have a great idea of how it works and how to use it in your trading.
Let’s start by going over what the Doji actually is…
The Doji Candlestick – An Overview
Steve Nison – the farther of candlestick charts and analysis – described the Doji as one of the most important candlestick patterns in his book – and you know what, he’s not wrong.
Overlooked by most forex traders in favor of more popular patterns, the Doji is an extremely useful signal; it can give you insight into the battle between the bulls and bears, provide hints on when price could be reversing, and tell you when and where the banks might be entering the market.
Like most patterns, the Doji is a single candle; no surprises there.
However, it’s special for two reasons: #1 it’s open and close form at identical prices, so it’s ninetieth bullish or bearish; and 2#, it comes in 4 variations:
Dragonfly Doji.
Long legged doji.
Gravstone doji.
Gravestone Doji.
Each doji has a slightly different appearance, and can signal either indecision – like the spinning top candle – or indicate a potential reversal is on the horizon. No two patterns will ever be the same, but all will have their open and close at the same price, resulting in a candle with no real body.
Here’s how the dragonfly Doji looks…
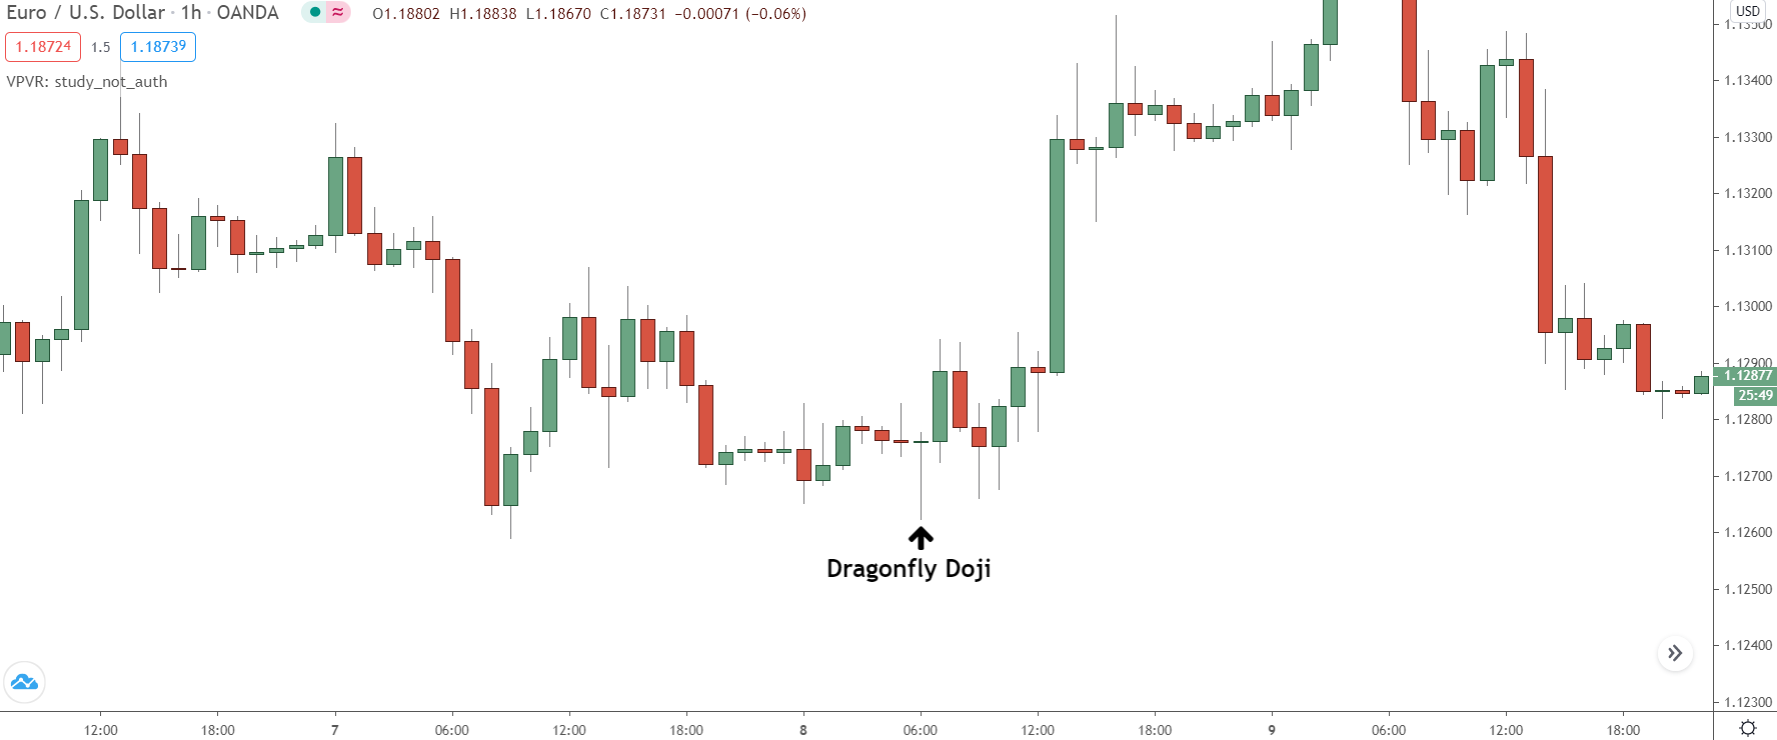
You can see the close falls exactly on the open, causing the pattern to be neither bullish nor bearish – the dragonfly is technically a bullish pattern because of how it forms, but I’ll explain this later.
As with spinning tops, Doji’s form from the bulls and bears battling it out for control of price but ultimately coming to an impasse. In this case, though, neither the bulls or bears get any edge of the over; both sides completely cancel each other out, which is why the open and close form at exactly the same price.
The 4 Types Of Doji And What They Signal
If you want Doji’s to be useful in your trading, and not just a primer candle you understand but never use, you need to take the time to familiarise yourself with the 4 different variations. That way you’ll know what each type indicates when it forms, and how to best use them when they appear.
Let’s go over the 4 Doji’s now; see what each one does.
Dragonfly Doji
A reversal candlestick typically found at the end of downtrends, the dragonfly Doji along with its brother – the gravestone Doji (see below) – is the most common type of Doji pattern you’ll see in forex – and maybe the most useful too.
The dragonfly is so-called because price always closes near the top of the candlestick, making the candle look like a dragonfly with its wings spread. Keep in mind: the candle doesn’t need to close right at the top as you see here. Some guru’s say it does, but really, the position doesn’t matter.
So long as a price is in the upper half of the candle and closes at the open, it’s a valid pattern.
Gravestone Doji
The opposite (or brother, if you like) of the dragonfly Doji, the gravestone Doji usually forms at the end of up-trends, and indicates a possible reversal to the downside.
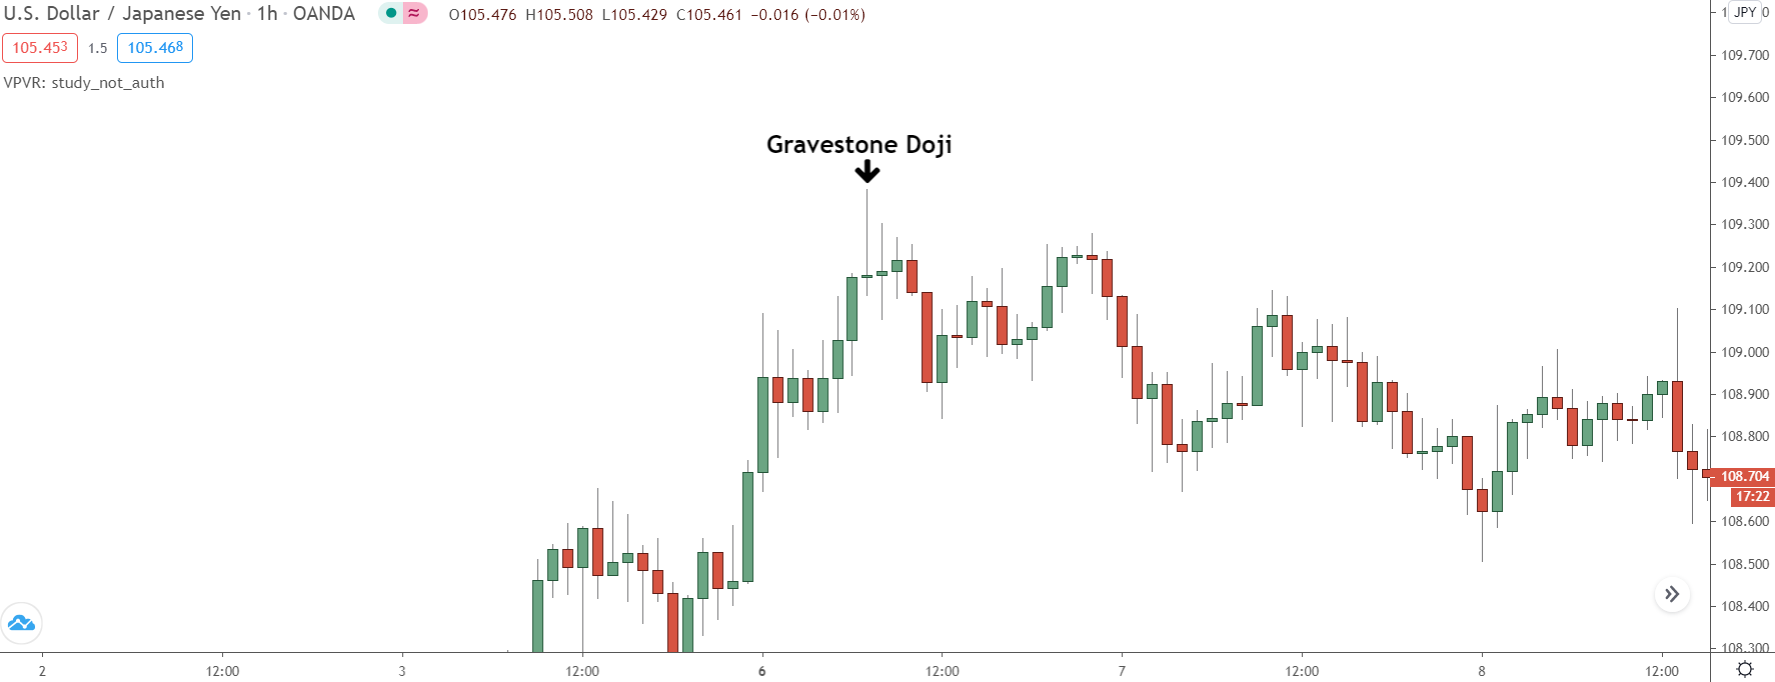
Looks-wise, the gravestone Doji is identical to the dragonfly… just flipped the other way around. Like all Doji’s, it forms when price closes at the open, which this time is near the bottom of the candlestick, giving it the appearance of a gravestone – spooky, right?
Why The Dragonfly And Long Legged Doji Are Really Pin Bars
Now many books and price action sites will tell you the gravestone and dragonfly Doji’s form the bulls and bears battling it out, but it’s not technically correct…
They actually form from the banks buying and selling.
When the banks buy or sell, whether to place trades or take profits, price moves in the opposite direction resulting in a candlestick with a long wick forming. Usually, these candles end as bullish or bearish pin bars, but on some occasions, they also end as dragonfly and gravestone Doji’s.
So essentially, gravestone and dragonfly Doji’s are the same pin bars.
They form in the same way, under the same process – the banks buying and selling – and indicate a reversal when they appear on the chart; therefore, they are basically the same as each other.
So when you see a dragonfly or gravestone Doji, treat it the same as a bullish or bearish pin bar.
If you see it form at a technical point, like a support or resistance level, use it as a signal to enter a trade. If you see one form after a long move or near an important high or low, take it as a sign price could be about to reverse.
Long Legged Doji
The long-legged Doji is the classic Doji pattern. Whenever you hear someone talk about seeing a “Doji”, they usually mean the long-legged Doji since it’s the originator of all the others.
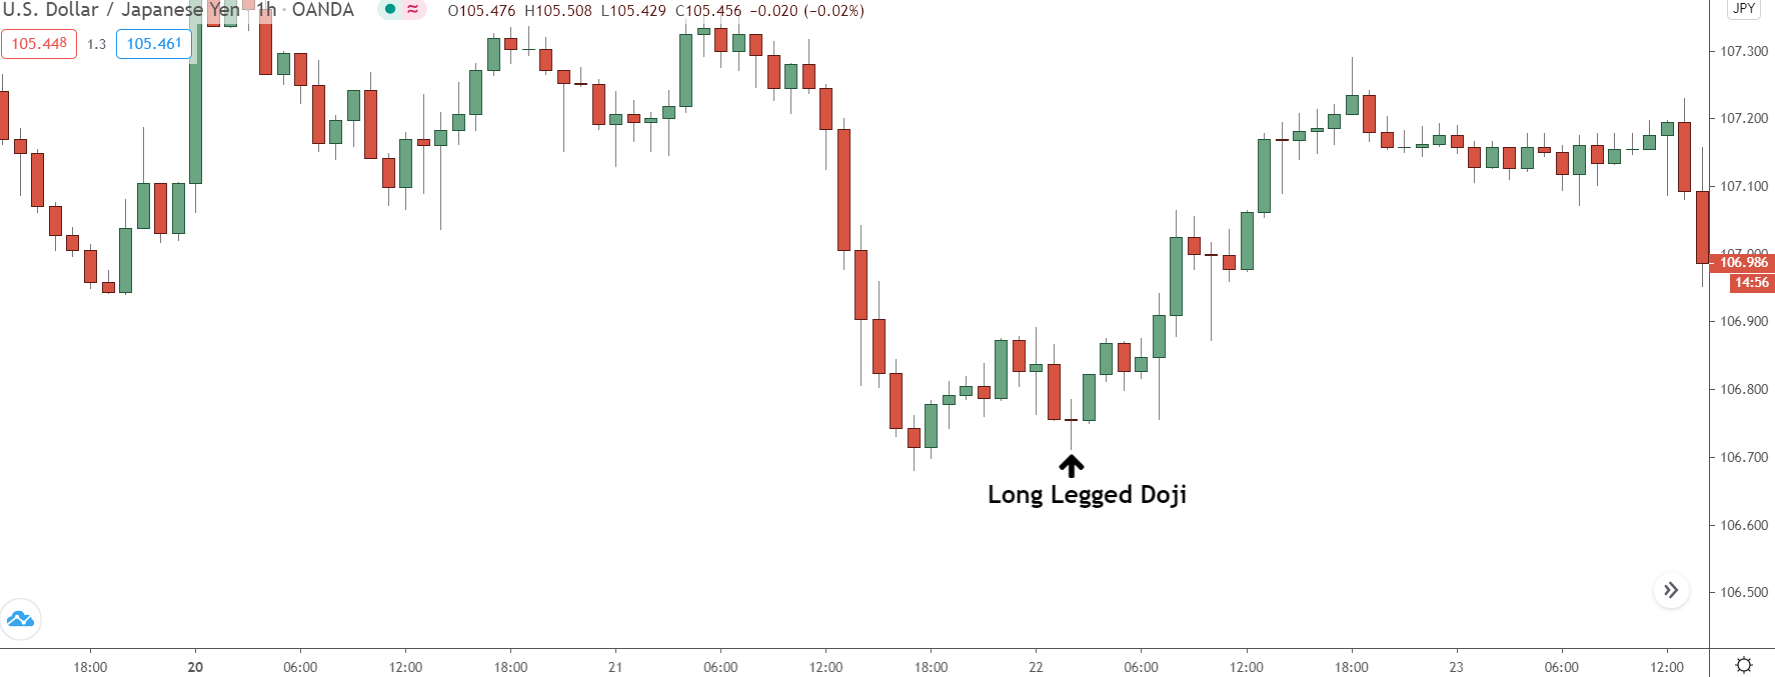
So-called because of it’s long upper and lower wick, the long-legged Doji is essentially a large spinning top candlestick that signals indecision in the market. It’s highly common in forex – especially on lower timeframes where you typically see more indecision – and like all other Doji’s, it always forms with it’s open and closes at the same price
Doji Star
The Doji star doesn’t form often in forex – it’s much more common in stocks and other markets. But you will see it from time to time, usually when there’s a gap or when the market opens higher/lower on a Sunday evening.
Structurally, the Doji star is the same as the long-legged Doji, only with much smaller upper and lower wicks. It forms from the bulls and bears battling it out but coming to a stalemate with no side able to decisively overwhelm the other, resulting in a period of indecision in the market.
Top 2 Ways To Use Doji’s Patterns In Your Trading
Doji’s aren’t the most useful patterns in the world, but if you know how to use them, they can give you some important insights on what price is up to and how the battle between the bulls and bears is developing.
Here are the two ways I use them in my own trading…
#1 As Entry Signals Into Trades
As I said earlier, Dragonfly and gravestone Doji’s form in the same way as bullish and bearish pin bars: the banks come in, buy or sell, and price reverses leaving a long wick below or above the candle.
So we can use them to enter a reversal trades, just like we would with pin bars.
Here’s what you need to do:
First, mark the technical levels you use to predict reversals on the chart.
You can use any technical levels to watch for the Doji patterns – support and resistance levels, Fibonacci, etc. For this example, though, we’ll use supply and demand zones – it’s what I mostly use, so it makes it easy.
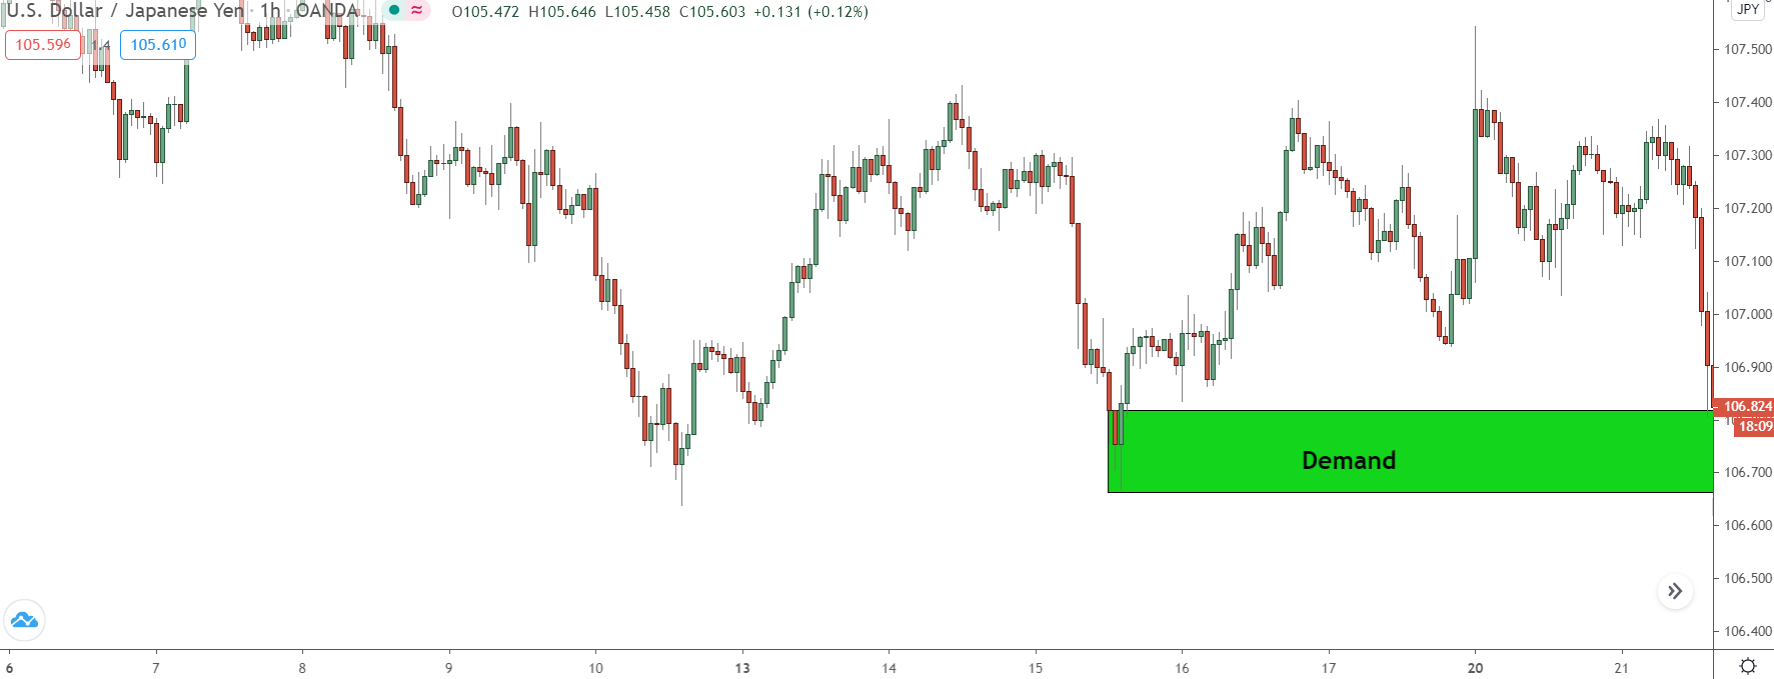
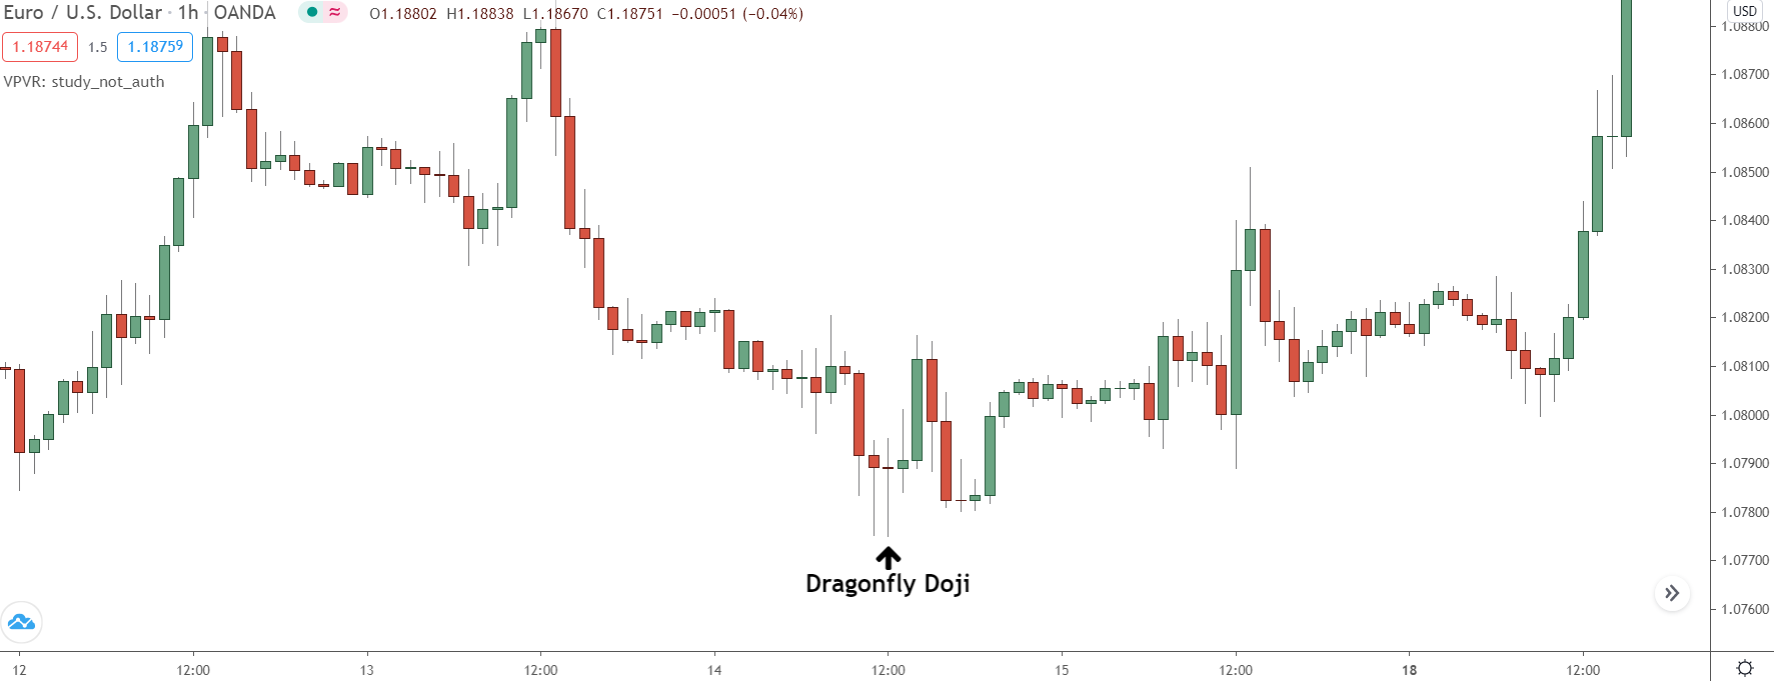
Now just like trading pin bars normally, you need to wait for price to return to the level – or zone in our case – and then see if a dragonfly or long-legged Doji forms inside. That’ll be a signal the banks are buying or selling and want price to reverse and move in the opposite direction.
If it’s a demand zone, you need to see a dragonfly fly Doji form, as that signals a rise.
If it’s a supply zone, a gravestone Doji must appear.
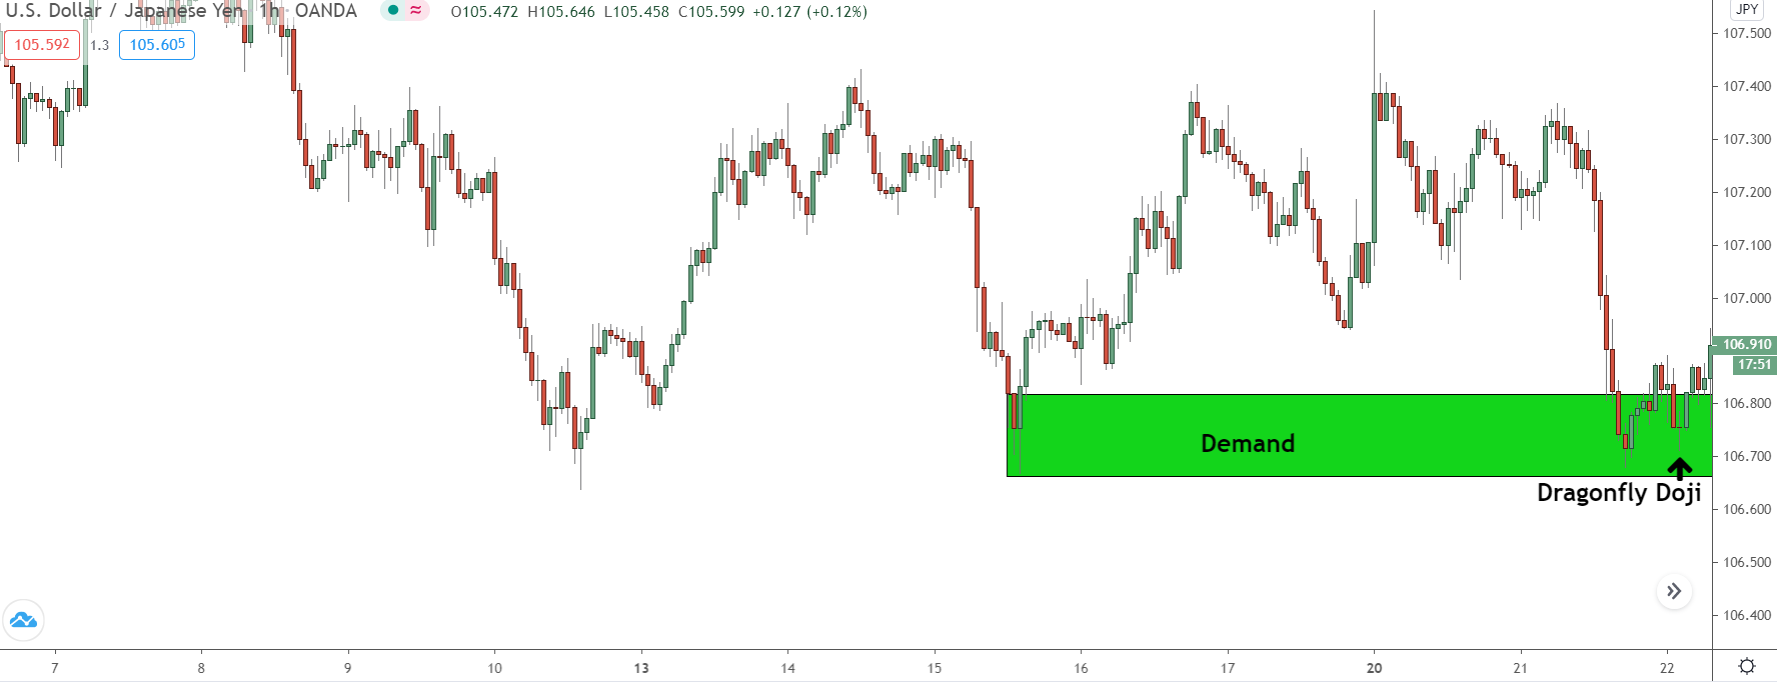
As you can see, price eventually falls back into the zone. And low and behold, a dragonfly Doji forms, giving us a signal the banks are potentially buying and that price may soon reverse and move away.
So now, you enter a trade and put your stop below the zone.
If price reverses, you get into a profitable reversal trade. If it continues falling, it’ll either break the zone and stop you out or reverse from a slightly lower price.
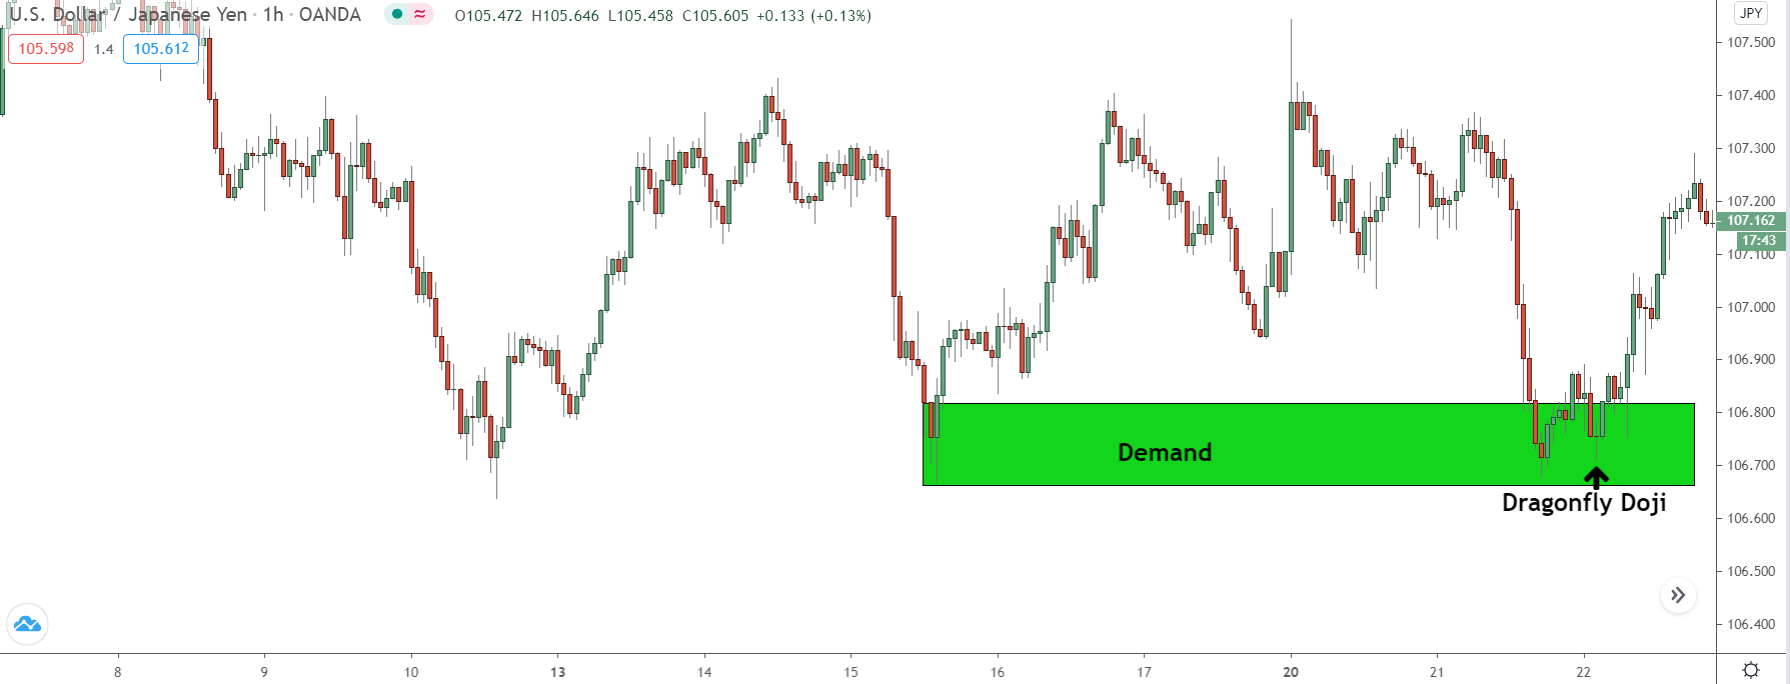
In this case, price ends up reversing; you got into a profitable trade, well done!
All you need to do now is manage the trade as you would trading pins.
First, take some profits by moving the stop up to the low of the dragonfly fly doji when price moves away from the zone. Then, simply monitor the situation and watch for price action that could cause price to move in the other direction.
Easy.
#2 As Warning Signs Of A Reversal
Dragonfly and gravestone Doji’s make great reversals signals, but the Doji star and long-legged Doji are also great warning signs a reversal could be about to begin.
These patterns signal indecision; the bulls and bears are battling each other for control of price.
However, for that battle to even begin, one side must come into the market. Either the bulls or bears must believe price is too high or too low and want it to move in the opposite direction.
So when we see a long legged Doji or Doji star, we know one side is clearly wants price to reverse.
If the bulls think price is too low, for example, and decide to start battling with the bears to make it move higher, we know a reversal could be on the cards because they’ve shown us they think the price is too low. They wouldn’t start battling with the other side if they didn’t think so.
We can use this to better time our entries on when to get into the reversal.
Here’s a quick example, so you can see what I mean…
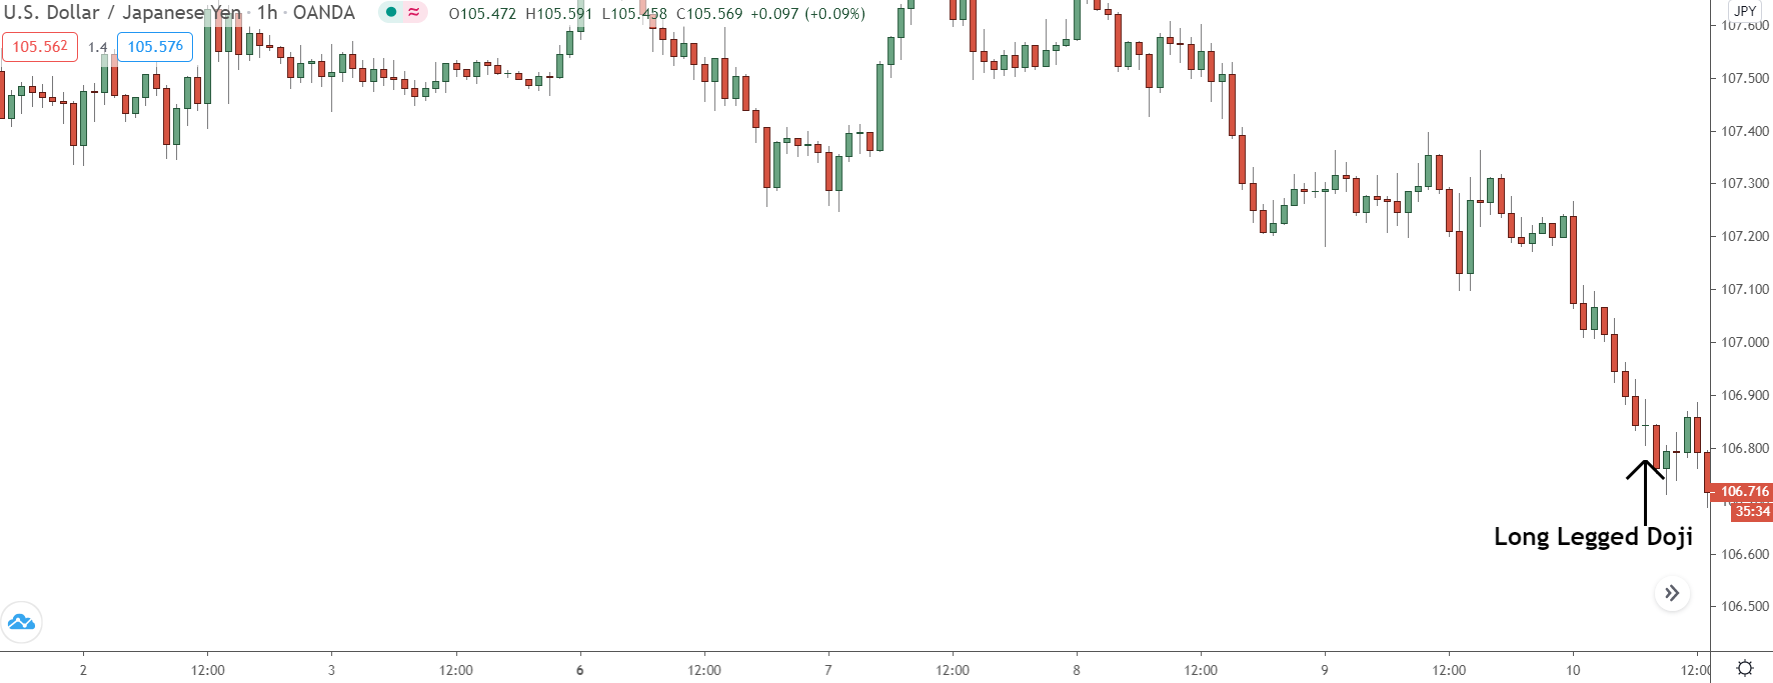
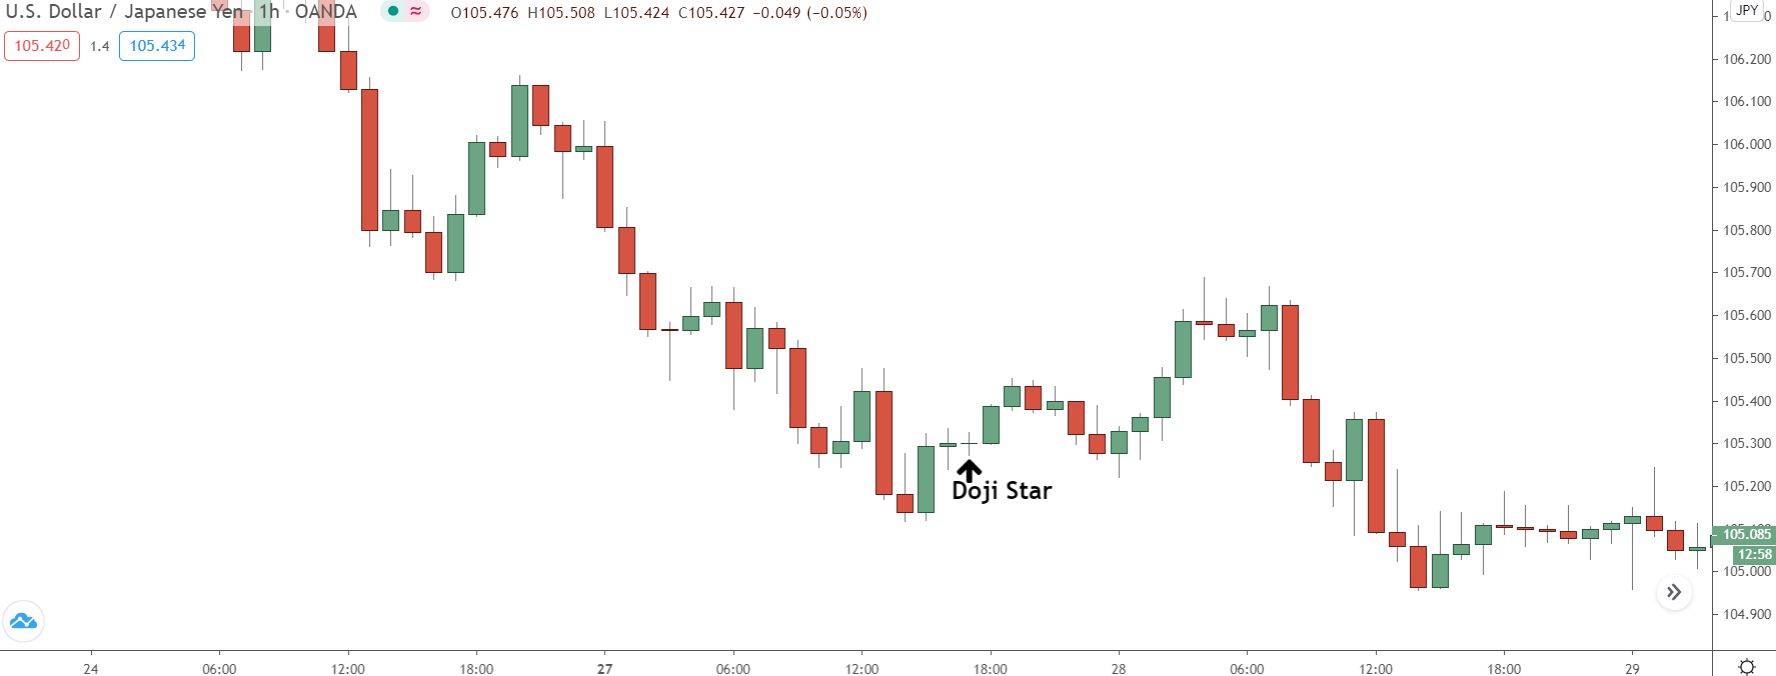
See how a long legged Doji formed during this downmove? Before this appeared, price was falling heavily off the back of a good economic figures
It looked certain price would keep rising, but then a long legged Doji appeared.
The Doji revealed the bulls had come into the market and decided to battle it out with the bears. It told us they think the price is too low and want it to move higher. That didn’t mean price was about to reverse – the candle still signals indecision, remember – but it did indicate the bulls were now interested, so a reversal could be likely.
And as it turns out, that’s exactly what happened…
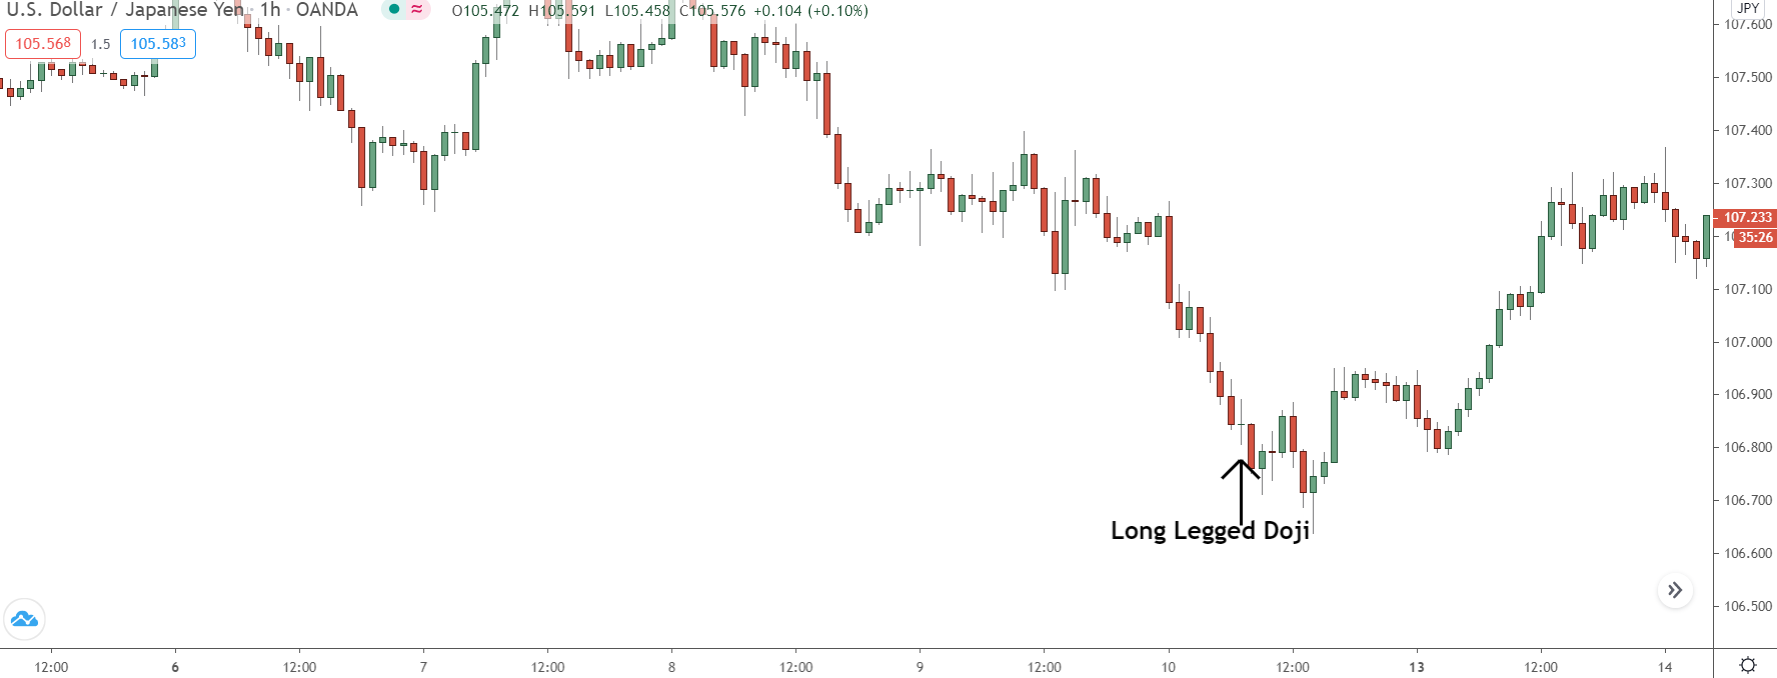
Soon after the Doji appeared, more and more bullish price action started forming – further signs the bulls were buying and wanted price to reverse. These pins and engulfs made good entry signals from the nearby support level. Price then reverses and a large up move ensures, confirming the bulls actually wanted price to rise.
Does that make sense now, how the long-legged Doji clued us into this reversal?
We knew from the Doji the bulls weren’t happy with these low prices – why else would they start battling with the bears? That gave us a warning signal; price could be about to reverse, so we need to pay attention.
The bullish price action then confirmed the reversal, giving us a chance to get in.
Summary
All in all, the Doji is a great candlestick well worth watching for. Sure, it may not form as often as more popular patterns, but it more than makes up for it with the insights it gives on the battle between the bulls and bears, what the banks are up to, and when price might be reversing.
Be sure to check out my post on spinning top candlesticks:
Spinning tops are very similar to the Doji’s we’ve looked at today, often forming before or after Doji’s appear. Understanding them both can give you the edge in predicting when the other will appear and vice versa.
The Next Step? Learn The 5 Rules For Trading Supply Demand Like A PRO Trader...
Take your trading to the next level. Sign up today to download my FREE E-Book and learn how the pro's trade supply and demand - Includes Order Block PDF and S & D Guide PDF