
If there’s one tool that doesn’t get enough love in forex, it’s fibonacci extensions.
Compared to their big brother – the ever-popular retracements – extensions rarely get a mention by most traders. In fact, outside of hardcore fib users, you’d be hard-pressed to find anyone who even knows what extensions are, let alone how to use them. And it’s really strange because…
If you know how to use them correctly, extensions can be one of the most powerful trading tools in your arsenal, even more so than retracements!
Just check out a few of the cool ways you can use them.
- To map out upcoming swings and predict retracements and consolidations.
- As levels to look for confluence alongside other signals.
- As points to take profits off trades.
Sounds pretty sweet, right?
In today’s guide, I’m going to show you how to use extensions to do all of the above plus more. First though, let me explain what extensions are and how they differ from the mighty retracements.
What Are Fibonacci Extensions And How Do They Work?
Fibonacci tools come in all sorts of weird and wonderful forms – spirals anyone?
Extensions – sometimes called expansions – however, are a little different… they’re not a tool on their own, but the extended levels of the Fibonacci retracement tool we use all the time.
Extended levels, what are these?
So if you’ve ever used the retracement tool, you’ll know it’s made up of 4 levels – the retracement levels.
These levels give us the points where price could reverse during a retracement and show according to the fibonacci number sequence, which I’m sure many of you have heard about before.
Well, extensions levels do the same thing, but… the other way around.
They don’t show within the swing, but outside – above for upswings, below for downswings. And rather than give you levels for where a retracement could end, they instead project the path of the upcoming swing, so you can see where price could reverse.
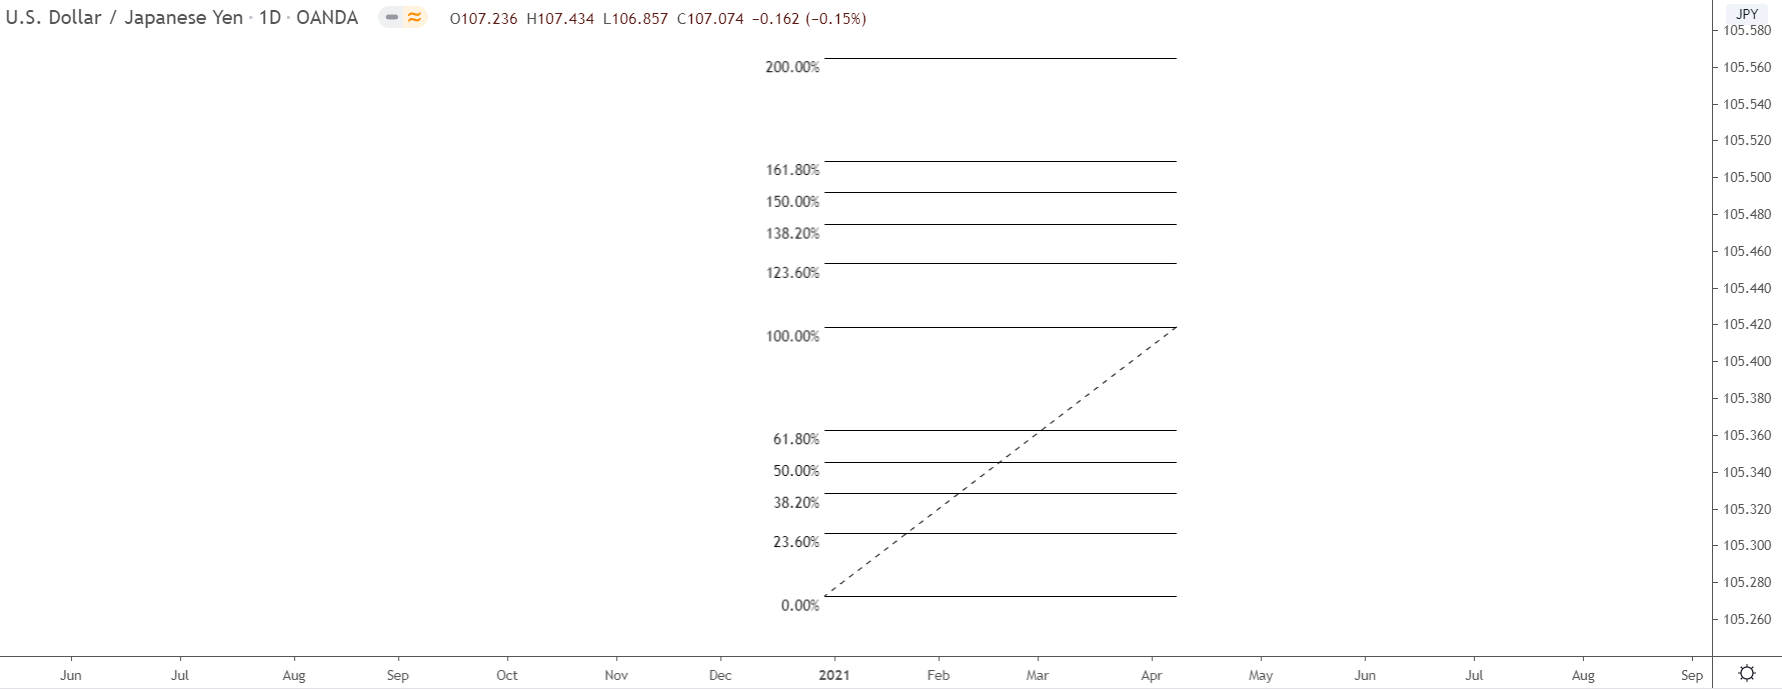
Here’s what they look like on a chart…
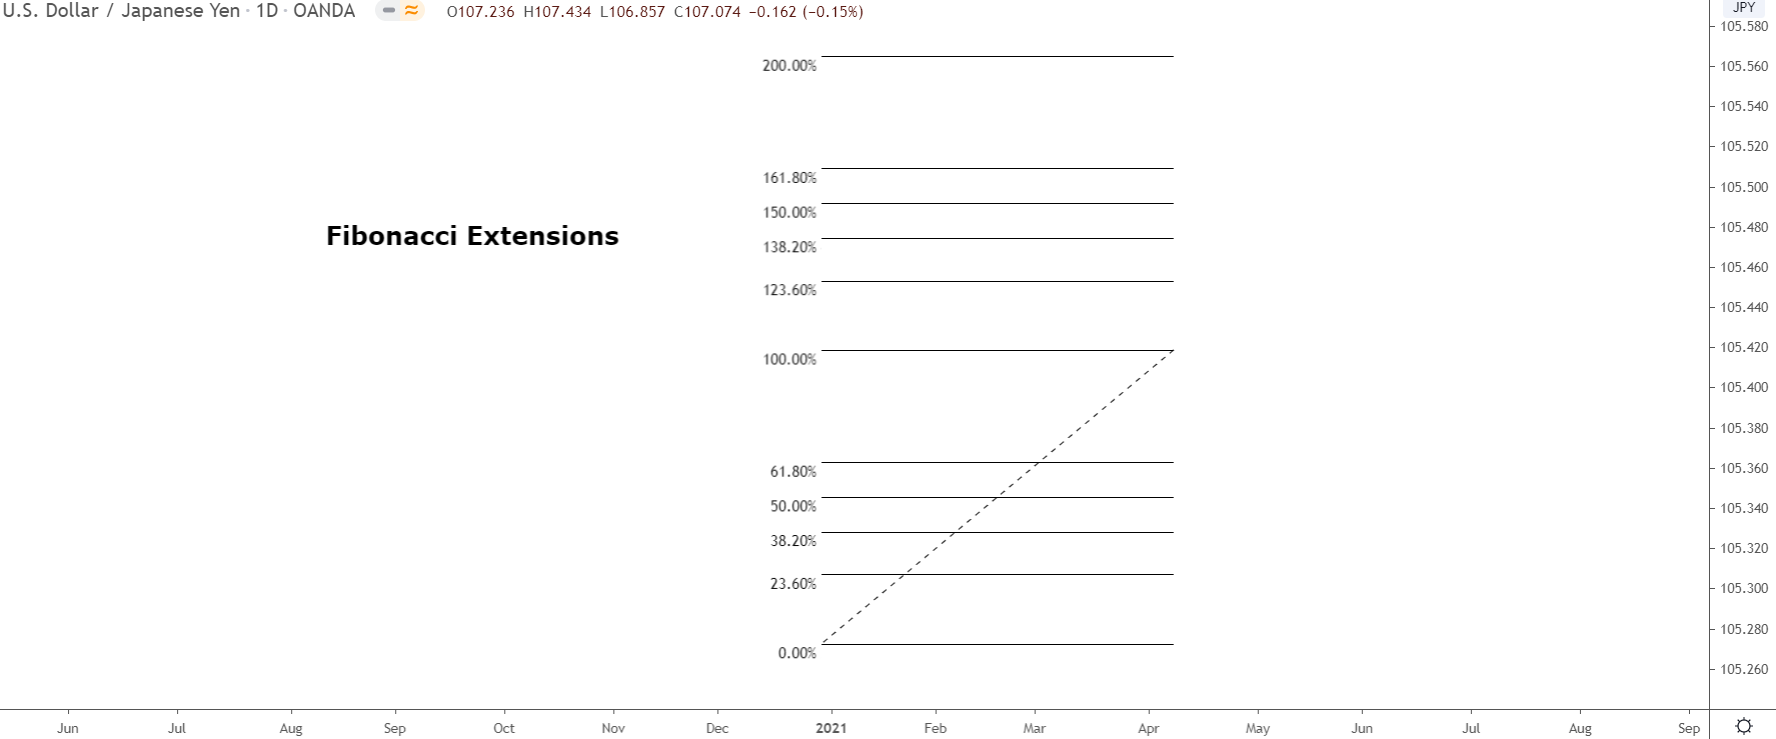
See how the levels appear above the typical retracement levels we use?
This is what I mean by projecting the path of the next swing. The levels give us the points where price could encounter support (or resistance in this case), so we know where the swing could end and where consolidations and retracements might form.
Also, notice how the levels are the same ratios as retracements … 23.6%, 38.20, 50% etc?
Like all fib tools, extensions are derived from the fib number sequence – more on this in a minute. The sequence gives us the ratios and creates the levels. The only difference is they all have a 1 in front e.g 123.6% due to being past the 100% point of the swing – hence why they project the next swing.
Something to remember… You must manually add the levels to the retracement tool for them to appear. Unlike retracements, they don’t appear by default; you must add them yourself using the settings menu.
I’ll walk you through how to do this later. For now, let’s look at how extensions are calculated.
How To Calculate And Use Fibonacci Extensions
Fibonacci extensions are derived from a special set of numbers known as the fibonacci number sequence – heard of this before?
For those who don’t know, the number sequence is a set of numbers that gives us the levels for retracements and extensions – and the other fib tools too. The sequence starts from 0 and 1, and each new number is calculated by adding together the previous two numbers.
The sequence goes for infinity, and begins like this:
0, 1, 1, 2, 3, 5 8, 13, 21, 34, etc…
It may look like a bunch of random numbers, but this sequence is what gives us all the different fib tools (including extensions) the ratios that show up as levels or lines. Strange, isn’t it? The ratios themselves aren’t random; they exist because the numbers in the sequence have special mathematical relationships with each other.
For example…
Every number in the sequence gets closer and closer to being 61.8% of the previous number – or thereabouts – hence why the 61.8% ratio is one of the levels we watch.
In total, 3 ratios exist: 23.6% 61.8% 38.2% – the 75% is a good level too, but it’s not technically a fib level like the others. The 50% level isn’t either, but it’s the halfway point of the swing, that’s why we use it.
Here are the number relationships that give us each ratio:
- Each number in the sequence gets closer to being 61.8% of the prior number, hence why we use the 61.8% level.
- Every number in the sequence is 23.6% of the number 3 positions to the right, which gives us the 23.6% level.
- The 38.2% level comes from each number being 38.2% of the number 2 spots to the right.
- The 50% level is simply the midway point of the swing. It’s not actually a fib level, just the midpoint.
For extensions, these calculations are the same. However, because the levels extend beyond the 100% point of the swing – as they project the next swing – each ratio has a 1 in front e.g 138.2%.
How To Setup Fibonacci Extensions Ready For Trading
If you’ve ever used fibonacci retracements – and let’s face it, who hasn’t at this point – you’ll know the retracement levels automatically appear when you drag the tool from one swing to the other.
Well, for extensions, things are a little different…
While fib extensions are part of the retracement tool, they don’t appear by default… you have to manually enter them in the settings menu.
It sounds difficult, but really, entering the levels is just a matter of putting some numbers in boxes. If you’ve manually added a retracement level to the tool before, that’s the same as what we do here. The only difference is we’re entering slightly different numbers and ratios, that’s all.
Here’s how to set them up on good ole MT4…
Adding The Levels On MT4
Adding the extensions levels on MT4 is the harder way of using them – you’ll see why in a minute – but it’s still really really easy, and only takes a minute or two.
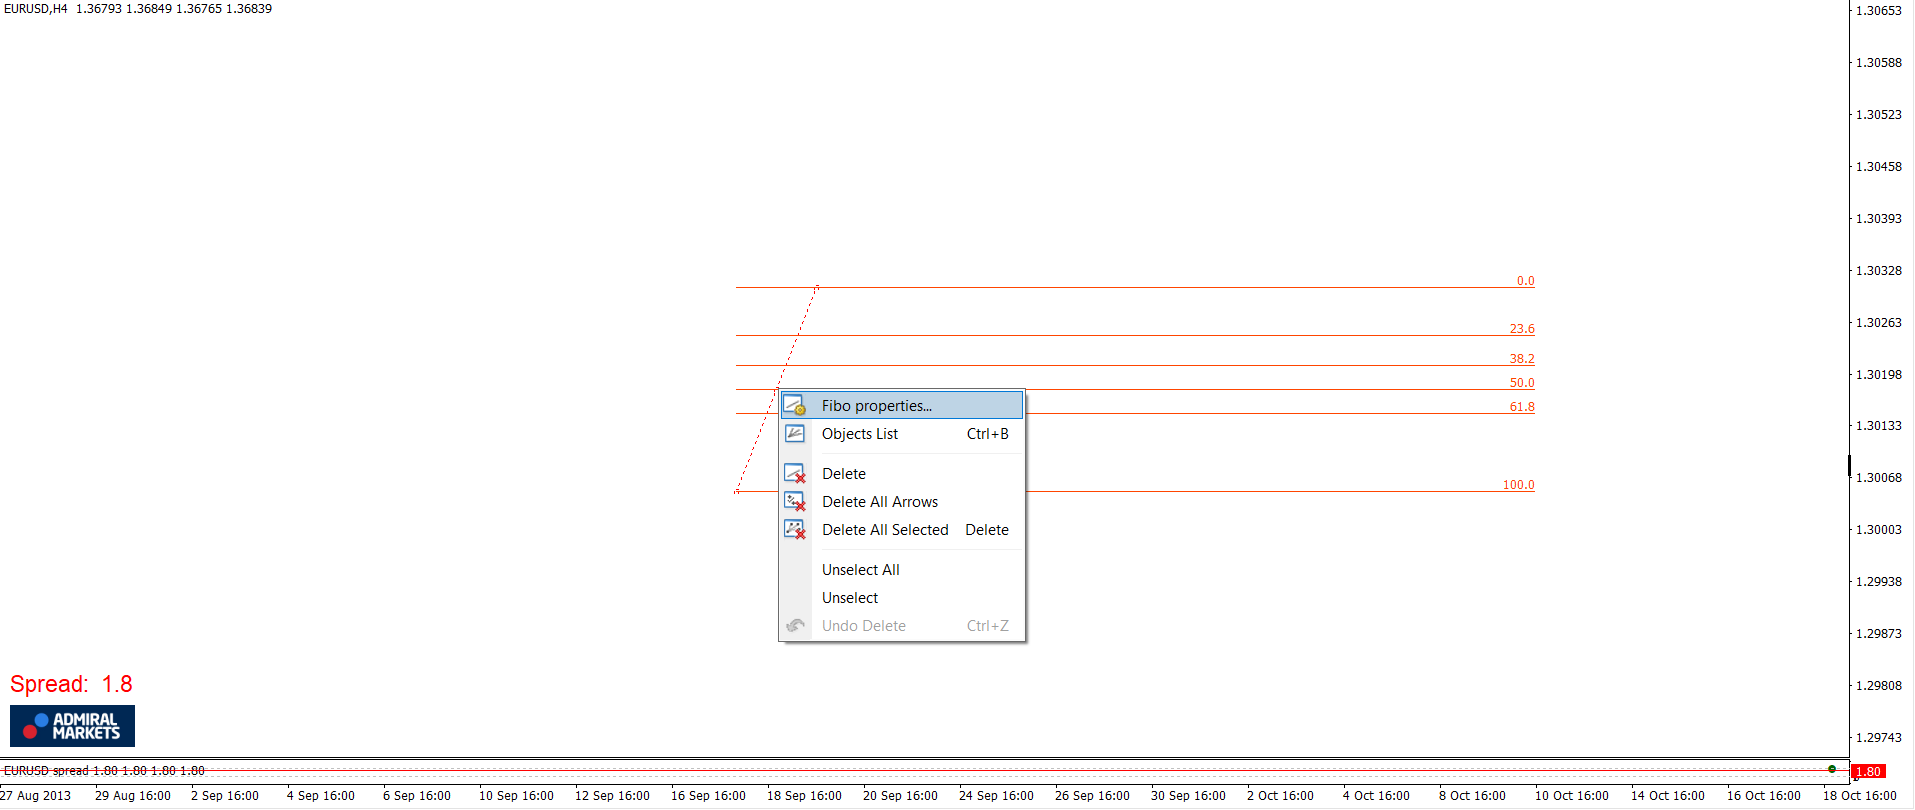
To add the levels, open up the settings menu by right-clicking the retracement tool and selecting “Fibo Properties”.
Next, head over to the “Fibo Levels” menu that shows all the retracement levels with their ratios.
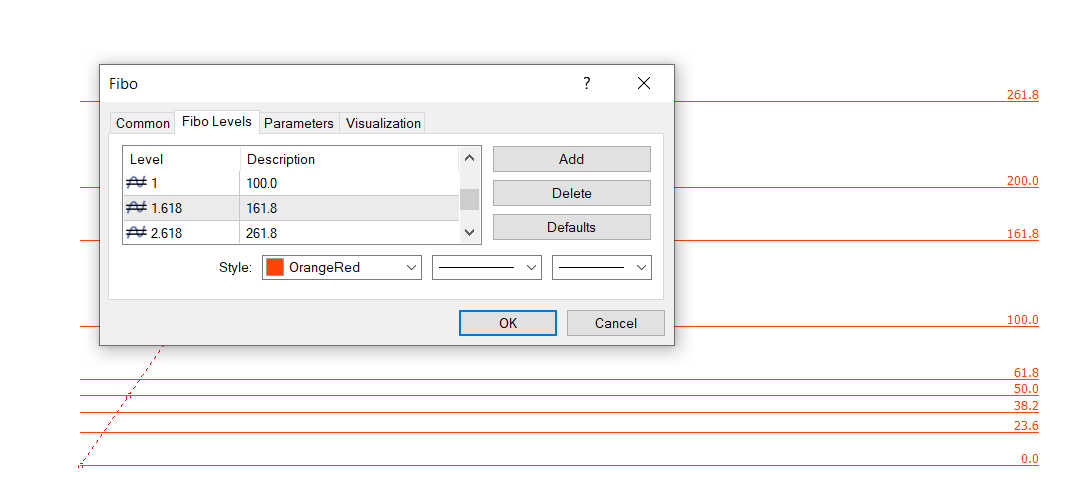 Now, click “Add” and enter the ratio of an extension level (use my list below). Then, where it says “Description”, enter the percentage of that level… for example, 1.618 is 161.8%, so that’s what you enter in the tab.
Here’s a list of the levels you need to add:
- 1.236 = 123.6%
- 1.382 = 138.2%
- 1.5 = 150%
- 1.618 = 161.8%
- 2 = 200%
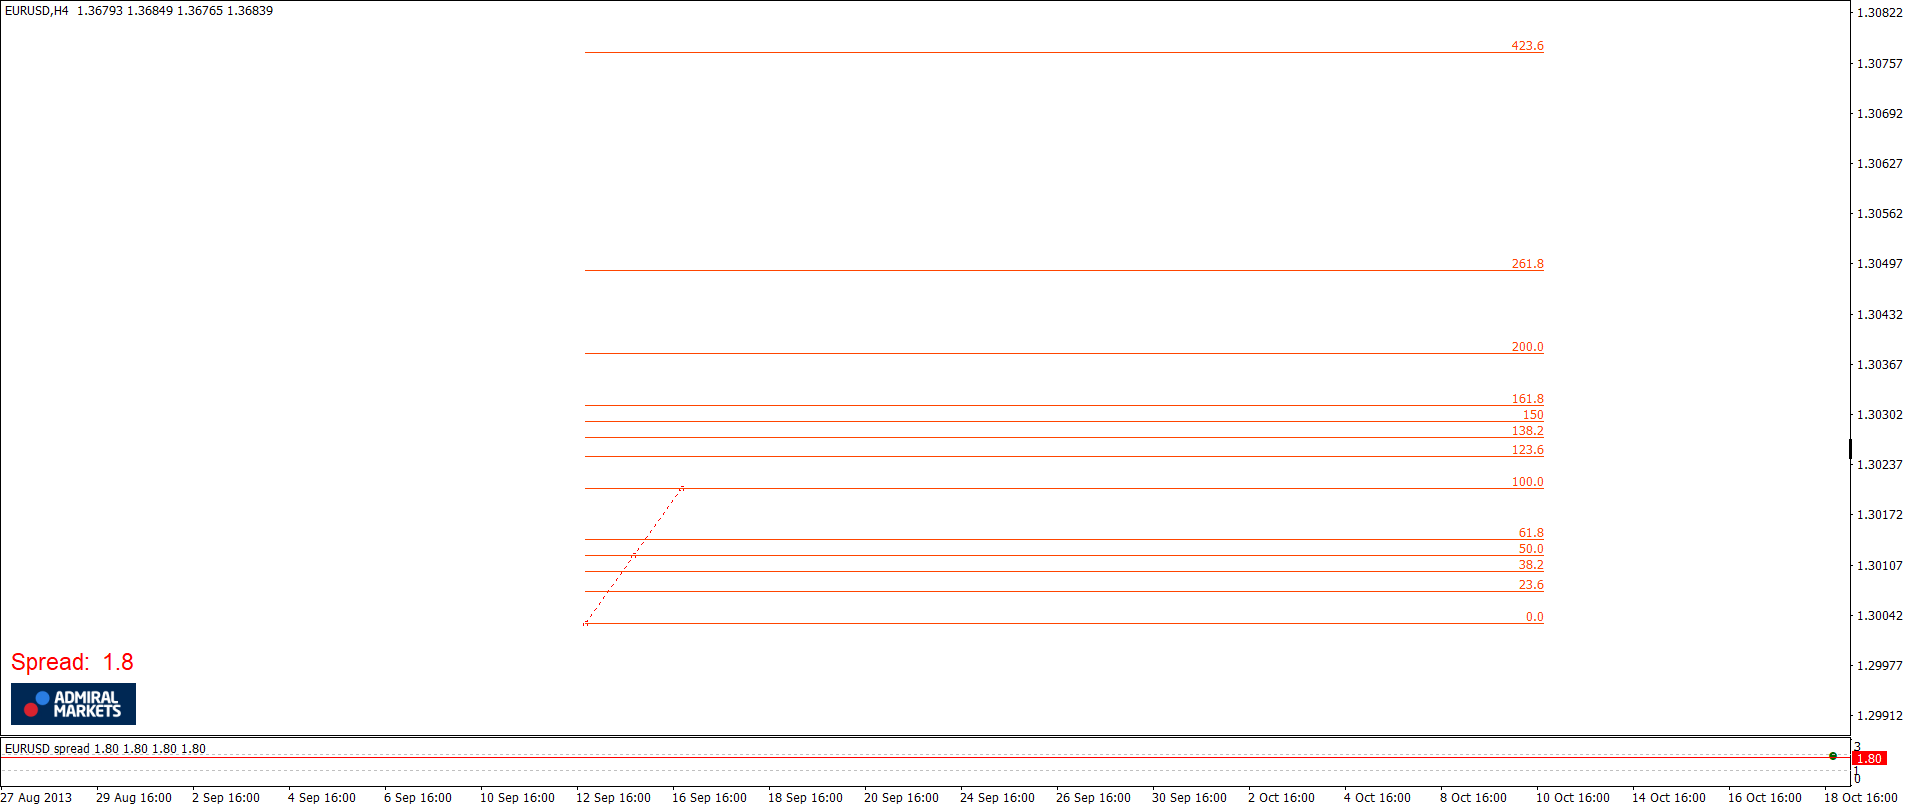
With the ratios entered, the tool should show the levels like you see above.
Adding The Levels On Tradingview
If you don’t want to enter the levels manually, head on over to Tradingview…
Unlike MT4, all the extension levels show automatically in the settings menu… no need to enter the ratios manually. Simply open up the menu, enable each level you want the tool to show – it even has levels beyond the extensions, if you ever need them – and you’re good to go.
Here’s how to do it:
First off, place the retracement tool on the chart and right click to open up the settings menu.
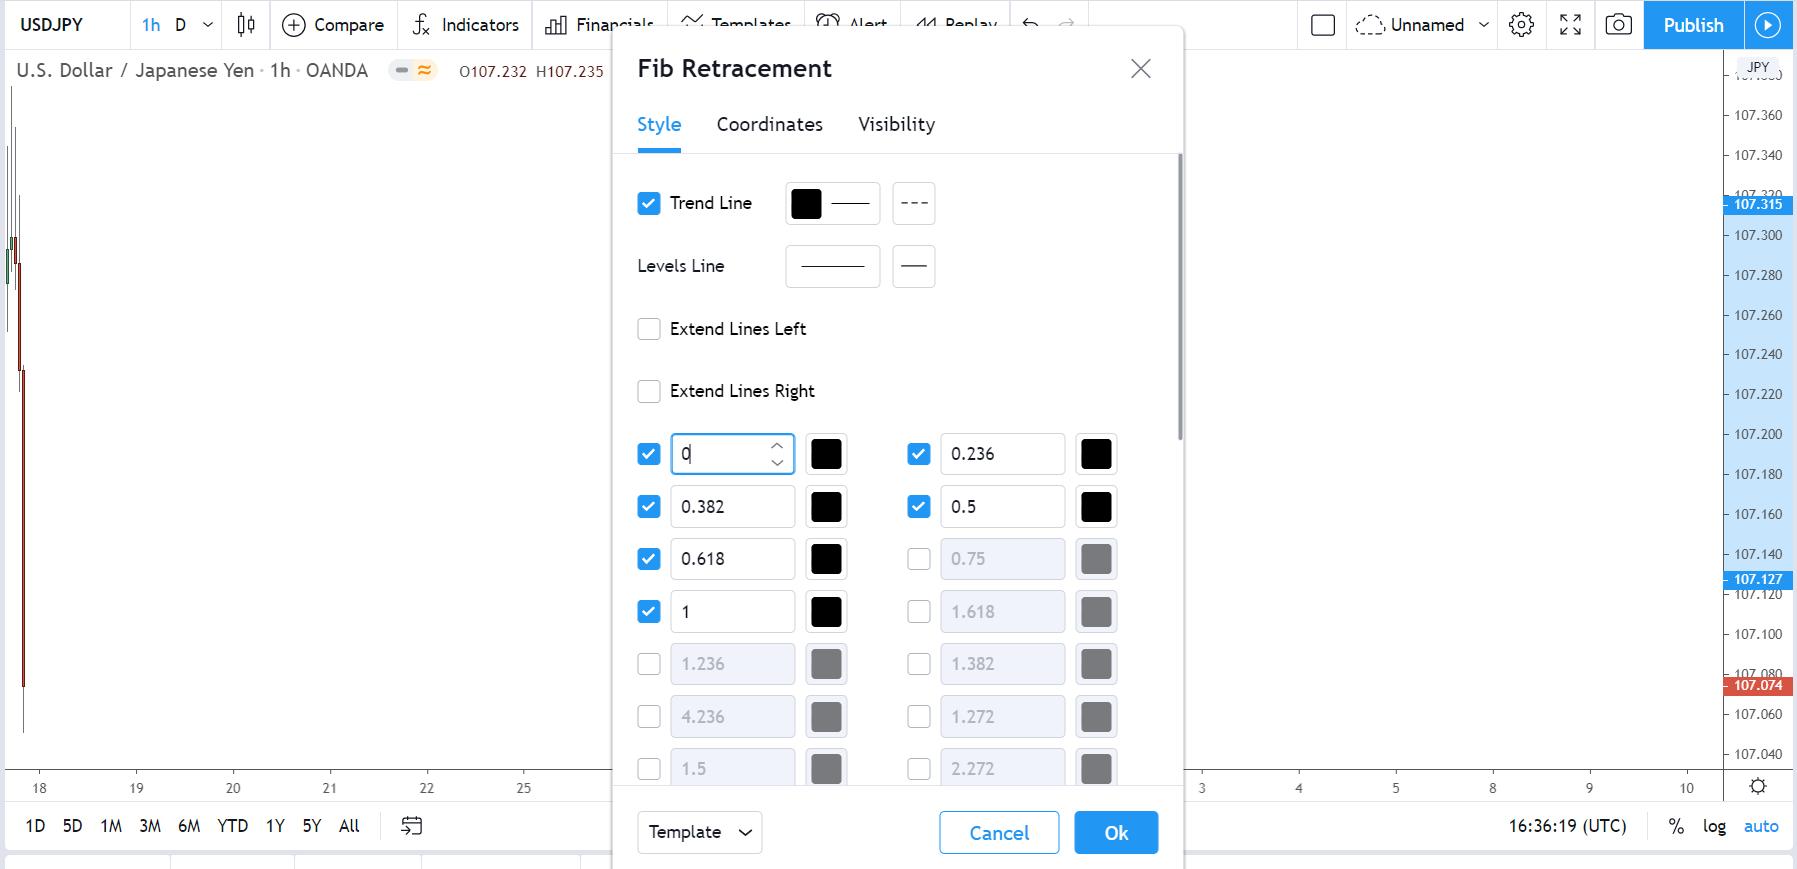
Inside the menu, you’ll see a full list of all the retracement and extensions levels. Enable the 7 levels listed below and hit the “Ok” button for the tool to show the levels on the chart.
- 1.236
- 1.382
- 1.5
- 1.618
- 2
And, just like that, the extensions are ready… you can start using them in your trading.
Easy, right?
How To Draw Fibonacci Extensions… The Right Way
How useful fibonacci extensions will be in your trading depends on one thing and one thing only: whether you can draw them correctly.
For extensions to show in the right location, you must place the tool on the correct points. And since extensions are part of the fibonacci retracement tool, that means finding the most recent upswing or downswing and then dragging the tool from one end of the swing to the other.
Upswings – you drag the tool from the lowest low up to the highest high.
Downswings – you drag it from the highest swing high down to the lowest low.
It’s not rocket science, but it can take some getting used to, especially if you’ve never used retracements before.
The key point to remember is rather than the levels showing within the swing, like they do with retracements, extensions always show outside the swing. That’s because they show the projected path of the new swing. So when you place the tool, the levels will either be above the swing (for downswings) or below the swing for upswings.
Here’s a quick guide, so you know what to do…
Upswings
When you want to use extensions to project the path of the next up-swing, you must place the tool from the lowest low of the last upswing up to it’s highest high.
So first, place the tool on the low…
And then drag it to the highest high, just like I have.
To know if you’ve done it correctly, look at the 0% and 100% levels… If the 0 level is on the low and the 100 on the high, the tool is in the right place, and the levels are correct.
Important Note: On MT4, the extensions show backwards. So rather than place the 0% level at the end of the swing, like you do with retracements, you instead place it at the beginning, with the 100% level taking it’s place.
Downswings
For downswings, the process is the same but the other way around….
First, find the highest swing high of the downswing swing and place the tool ontop…
Now drag it down to the lowest swing low.
The levels will appear below the swing and give you some idea of where price may reverse during the next swing. Again, to know if the levels are correct, just look at the 0 and 100 levels…
If the 0% level is on the swing low and the 100 on the high, you’ve placed the tool correctly.
The 3 Best Ways To Use Fibonacci Extensions In Your Trading
Once you’ve got to grips with using fibonacci extensions and know how to place them on the chart, the next step is to start using them in your trading… but how’d you do that?
Well, there are a bunch of ways…
For one, because the levels extend beyond the swing, they can help you map out the next swing. In other words, the levels give you some idea of where and when the next swing will end, where the retracements and consolidations could take place, and also how big the swing could end up being.
On top of that, the levels can also be combined with other tools as points of confluence.
For example, if you see an extension level line up with a support or resistance level or supply and demand zone, that increases the likelihood price will reverse from the level when it returns.
We haven’t got time to cover all the ways to use extensions today, but here’s what I think are the top 3.
#1 Use Extensions To Map Out Future Swings
It doesn’t get much worse than being taken out of a big trending move because of a surprise retracement or consolidation… do you agree?
That’s why it’s super important to map out every swing, to see how they could develop and take shape. Normally, we use things like supply and demand, S & R, big round numbers along with a healthy dose of price action to map the path a swing might take.
But extensions, which have been created specifically for this, work even better.
Being based on the fibonacci sequence means price has a high probability of reversing at extensions levels, making them prime spots to watch for retracements and consolidations.
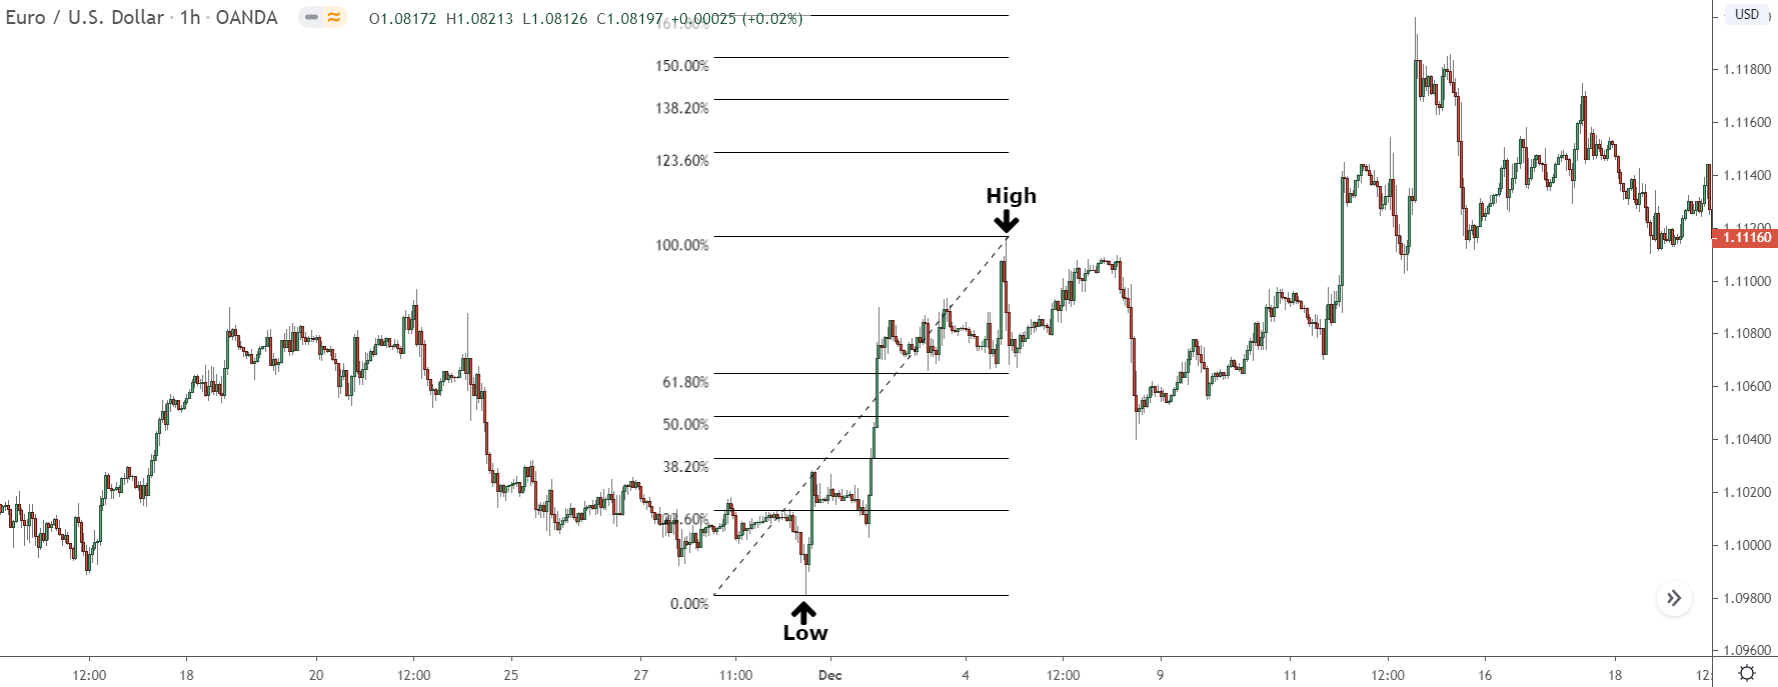
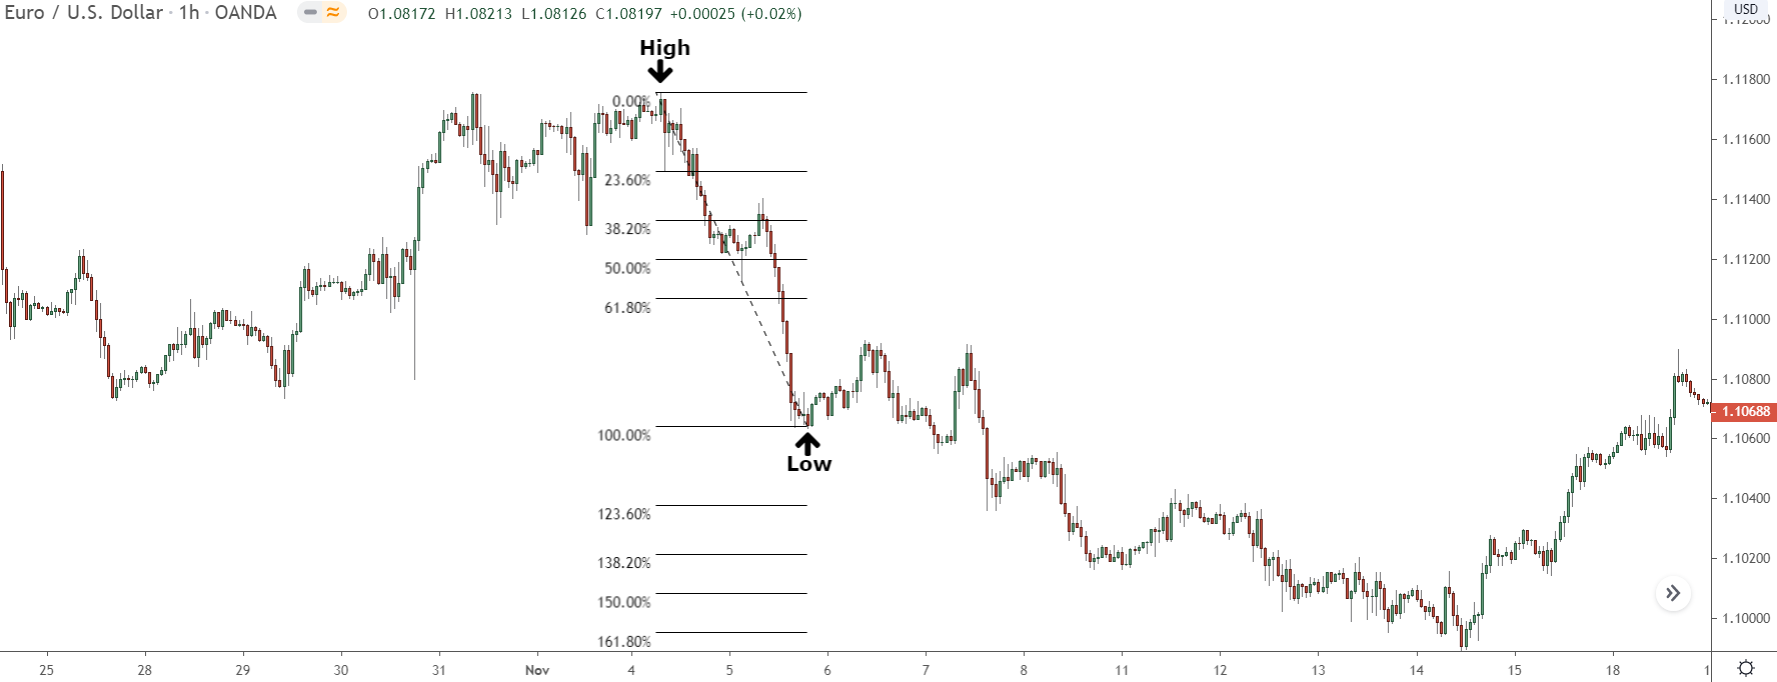
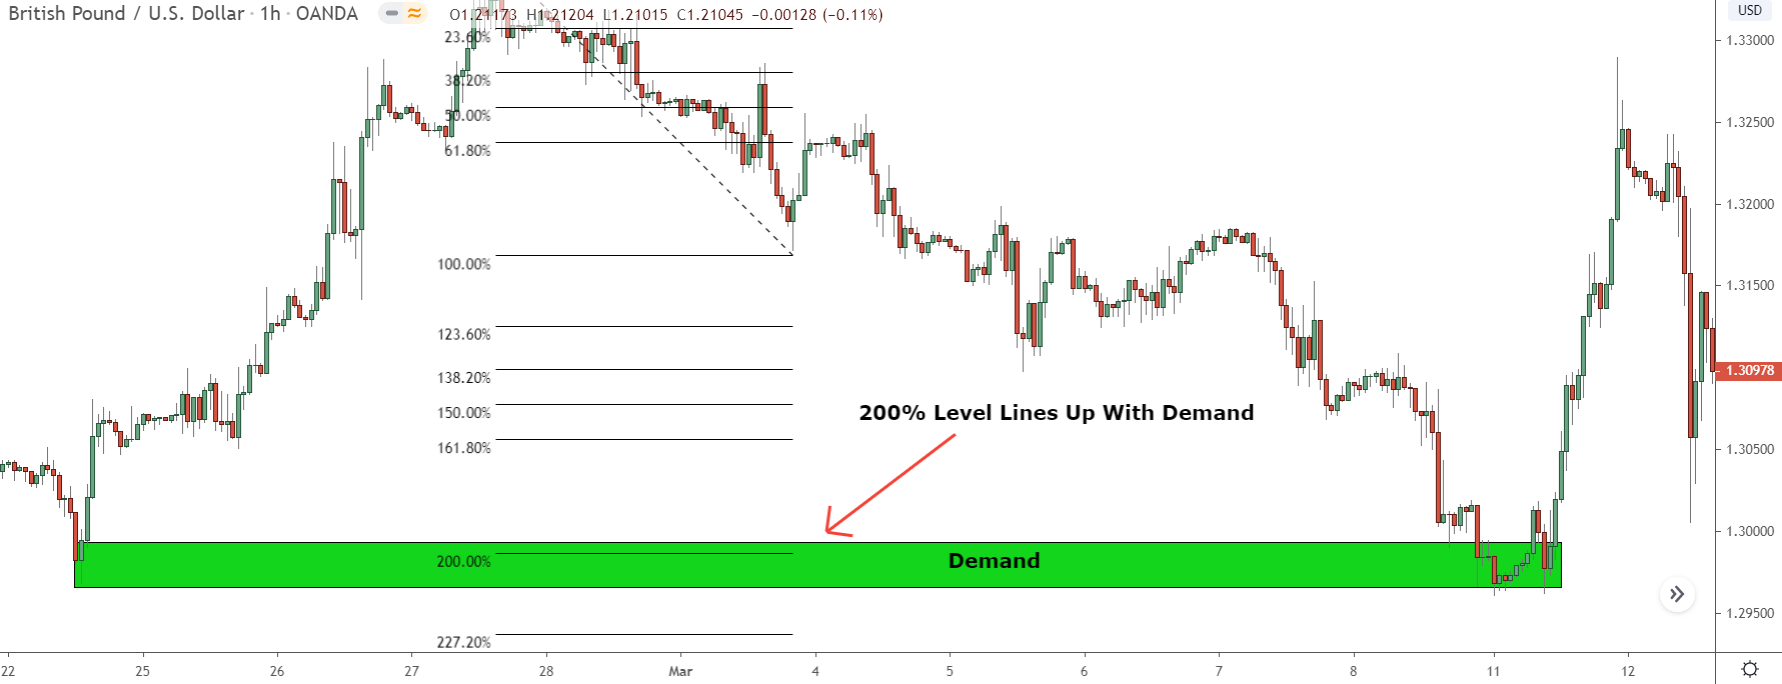
Just take a look at the image below and see for yourself…
Almost every extension level caused some sort of retracement on this upswing, with the last level – the 200% – being the one that put an end to the swing itself. Obviously, this won’t be the case all the time, but it does give you some idea of how often the extensions levels work and accurately predict what price will do.
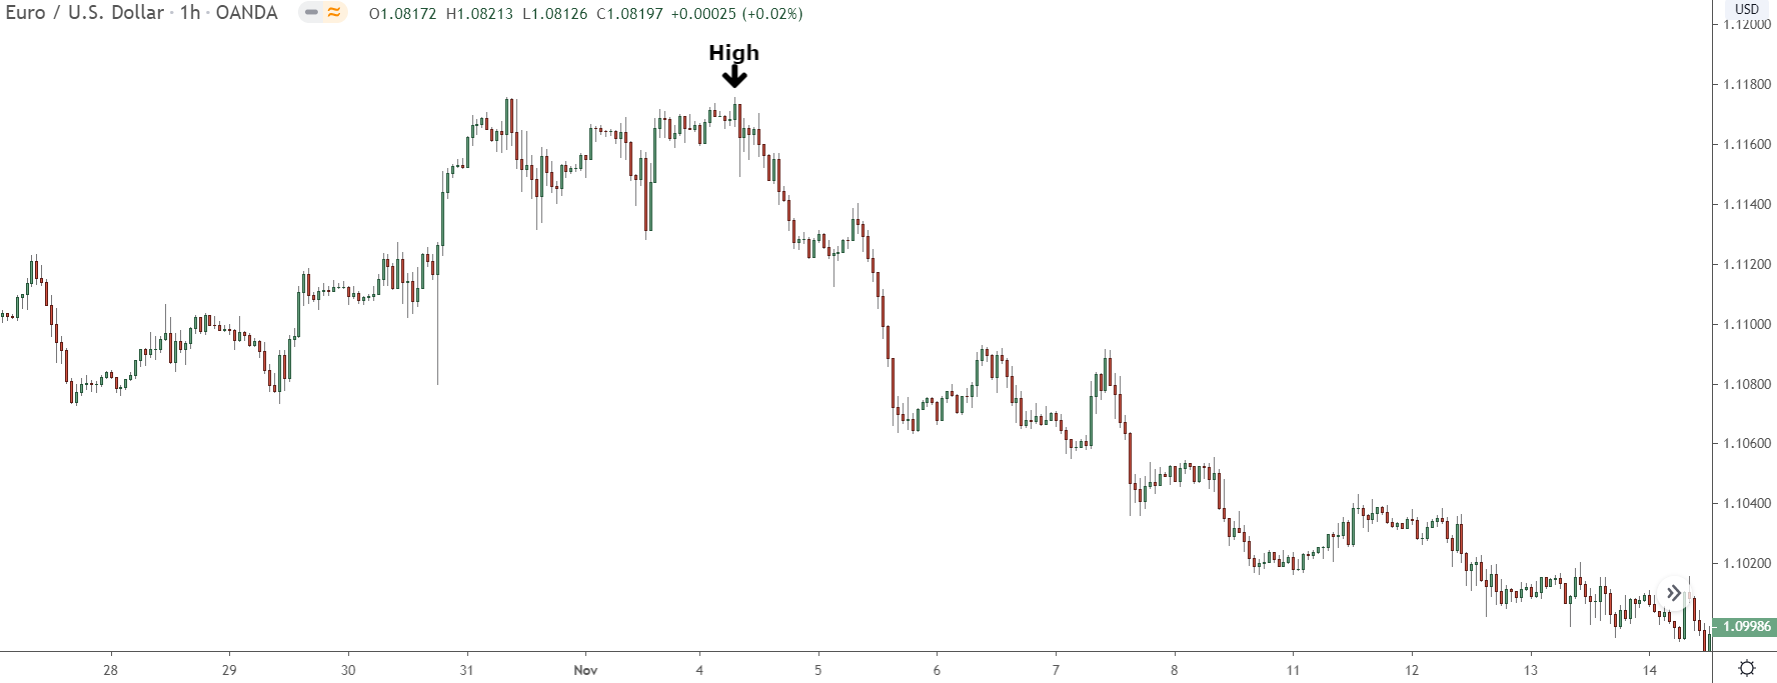
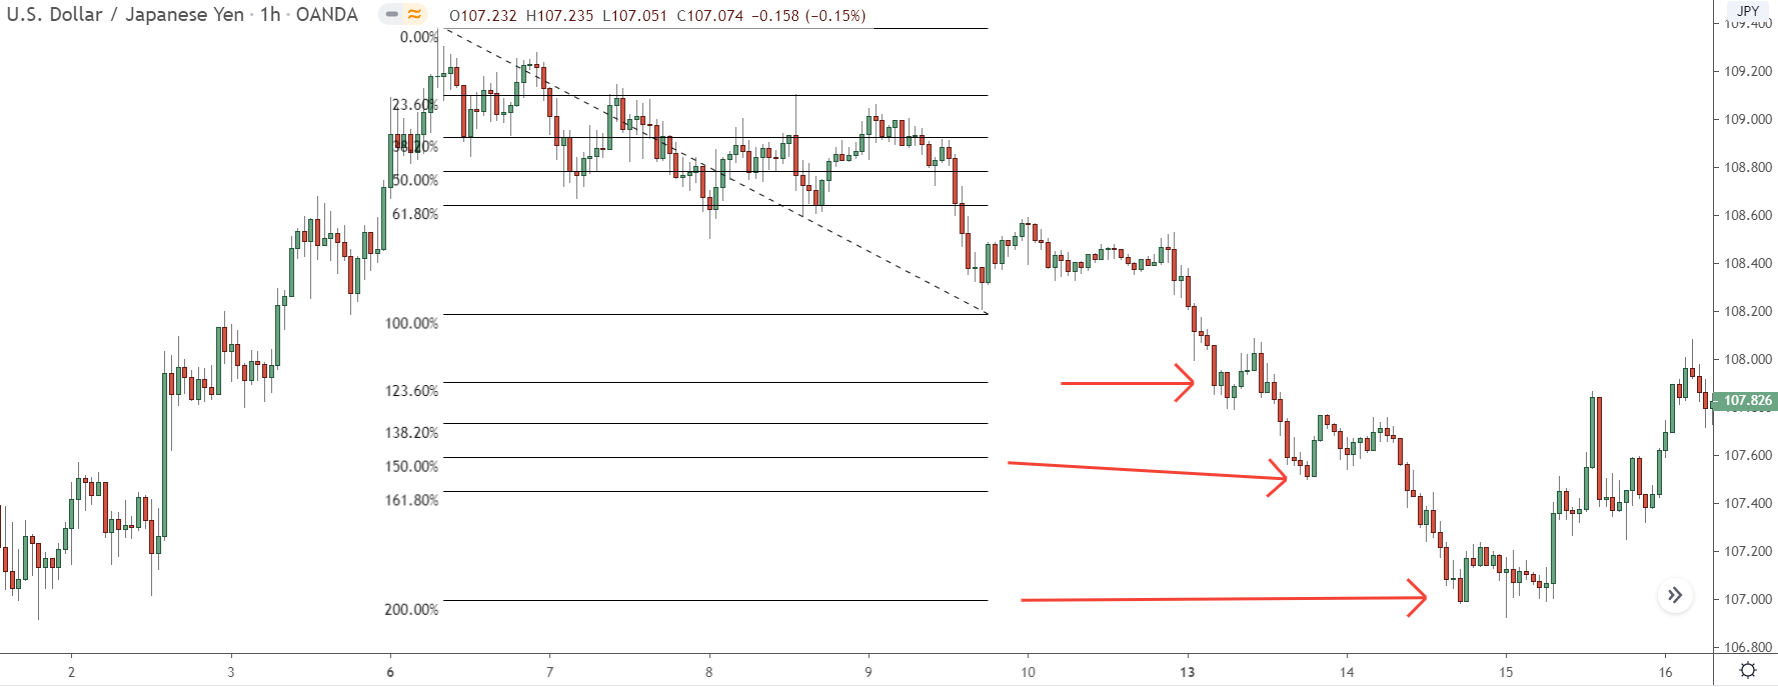
Let’s look at another one…
Again, a similar situation for this downswing.
As price fell, it reversed (almost) every time it hit an extension level, resulting in either a small retracement or minor consolidation. The levels gave you a clear idea of what price would do and when making it easy for you to take profits or adjust your positions to compensate.
So to map out swings, all you need to do is look at the extensions…. they give you a clear idea of when and where price may retrace or consolidate.
And this becomes even more powerful if you combine it with confluence…
#2 To Look For Confluence With Other Technical Tools
While extensions can map out future swings perfectly well on their own, when you combine them with other technical tools – i.e use them to look for confluence – they become even more effective. And in many cases, allow you to pinpoint exactly where and when a retracement or retracement will begin, not to mention where the swing itself will end.
You can combine extensions with pretty much any other tool to find confluence. However, it’s worth monitoring some points more than others due to their significance.
The best points to watch are supply and demand zones.
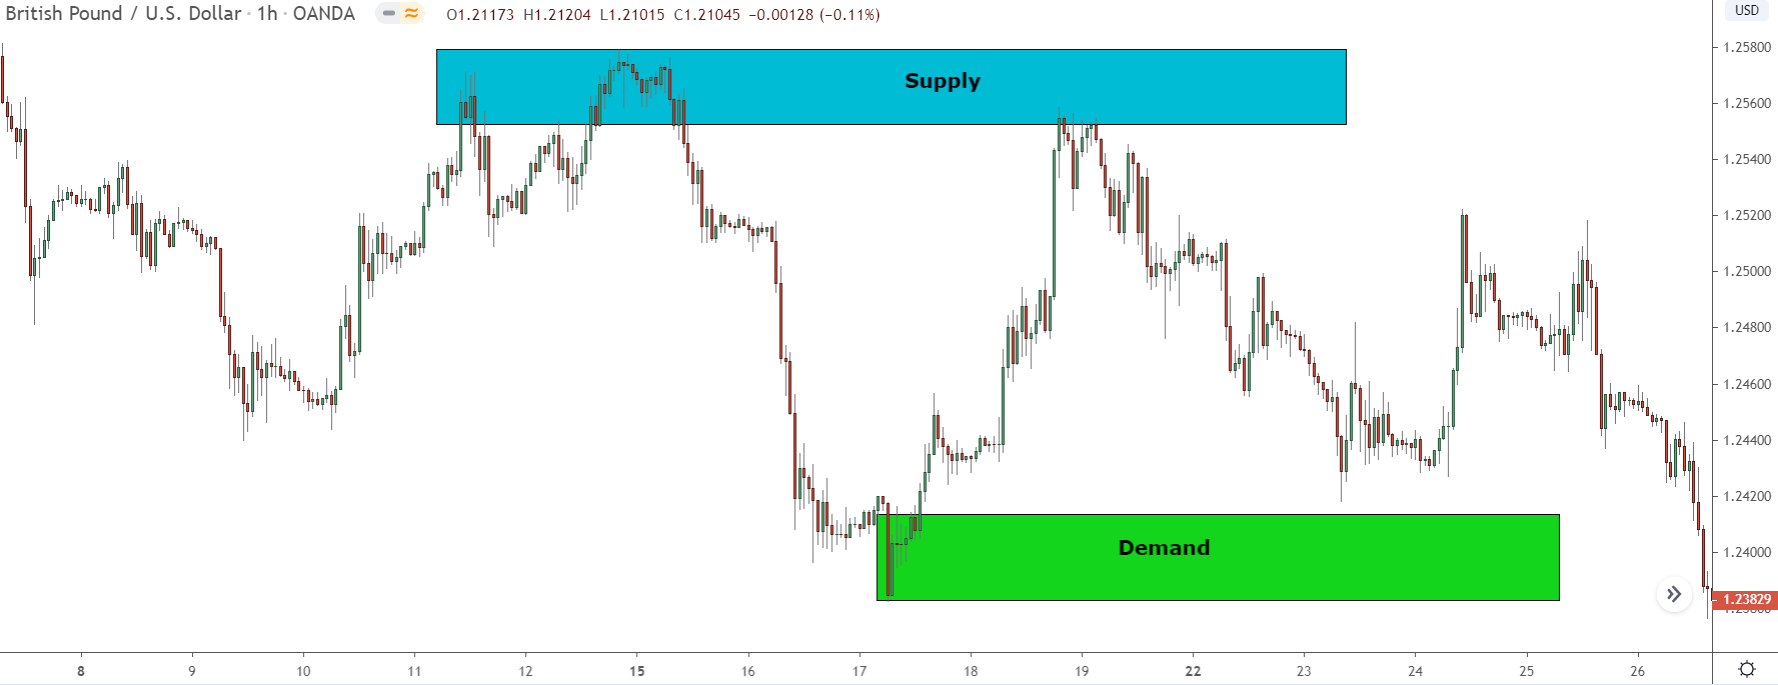
Supply and demand zones hold a lot of significance. They all – even the weak zones – form from the banks buying or selling, which means price has a strong chance of reversing from them to end a swing or to set off a retracement or consolidation.
To combine the zones with extensions, place the extension tool on the chart, then look for the zones that fall in line with the levels.
When you see a zone that lines up – it doesn’t have to line up exactly, just be nearby – mark it down. Even if it’s a weak rally-base-rally/drop-base-drop zone or a small bump you wouldn’t normally watch, mark it down as a zone.
Retracements and consolidations often form from these weak bumps and zones, so they are worth watching.
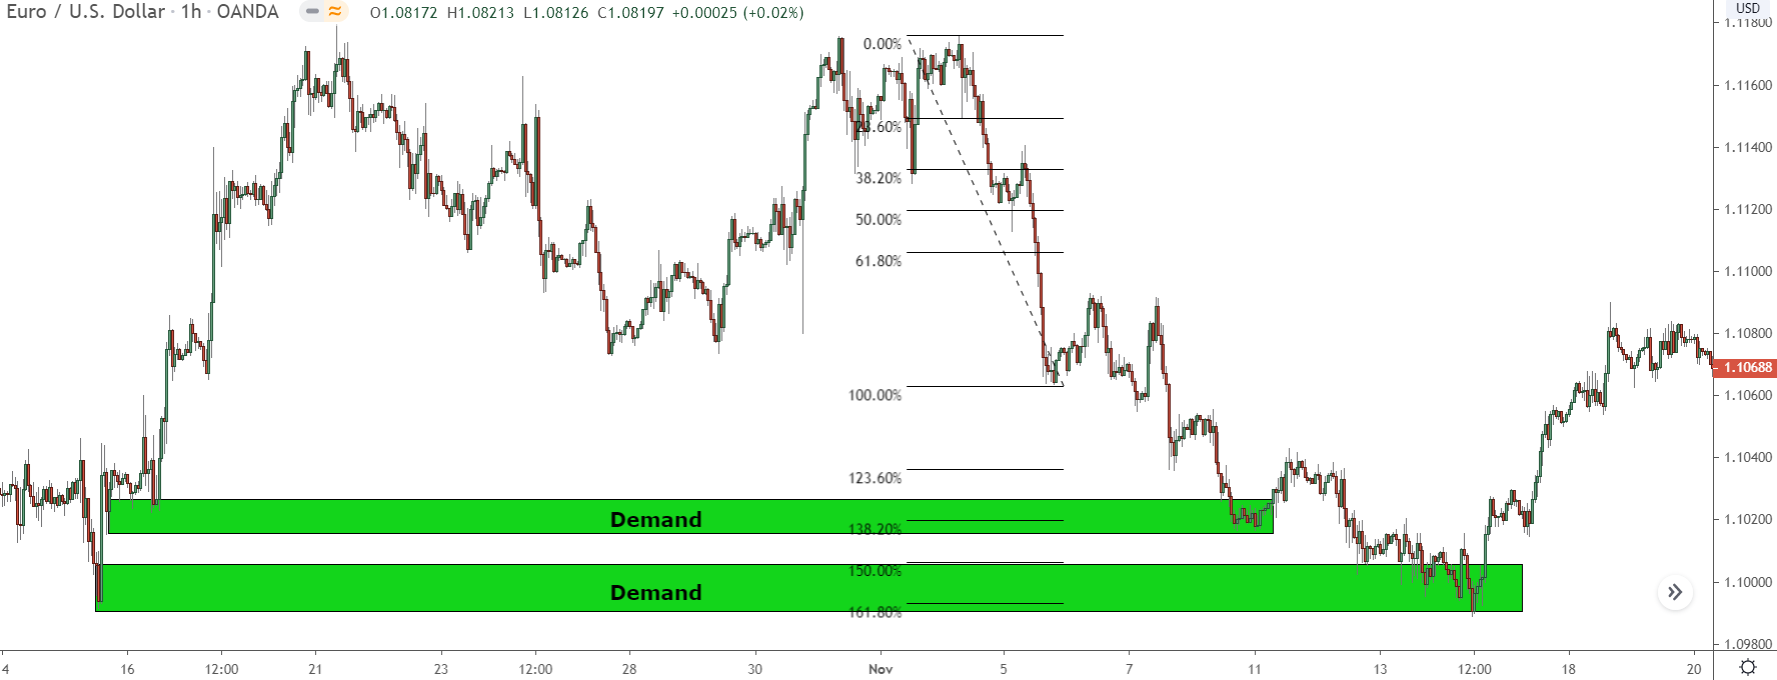
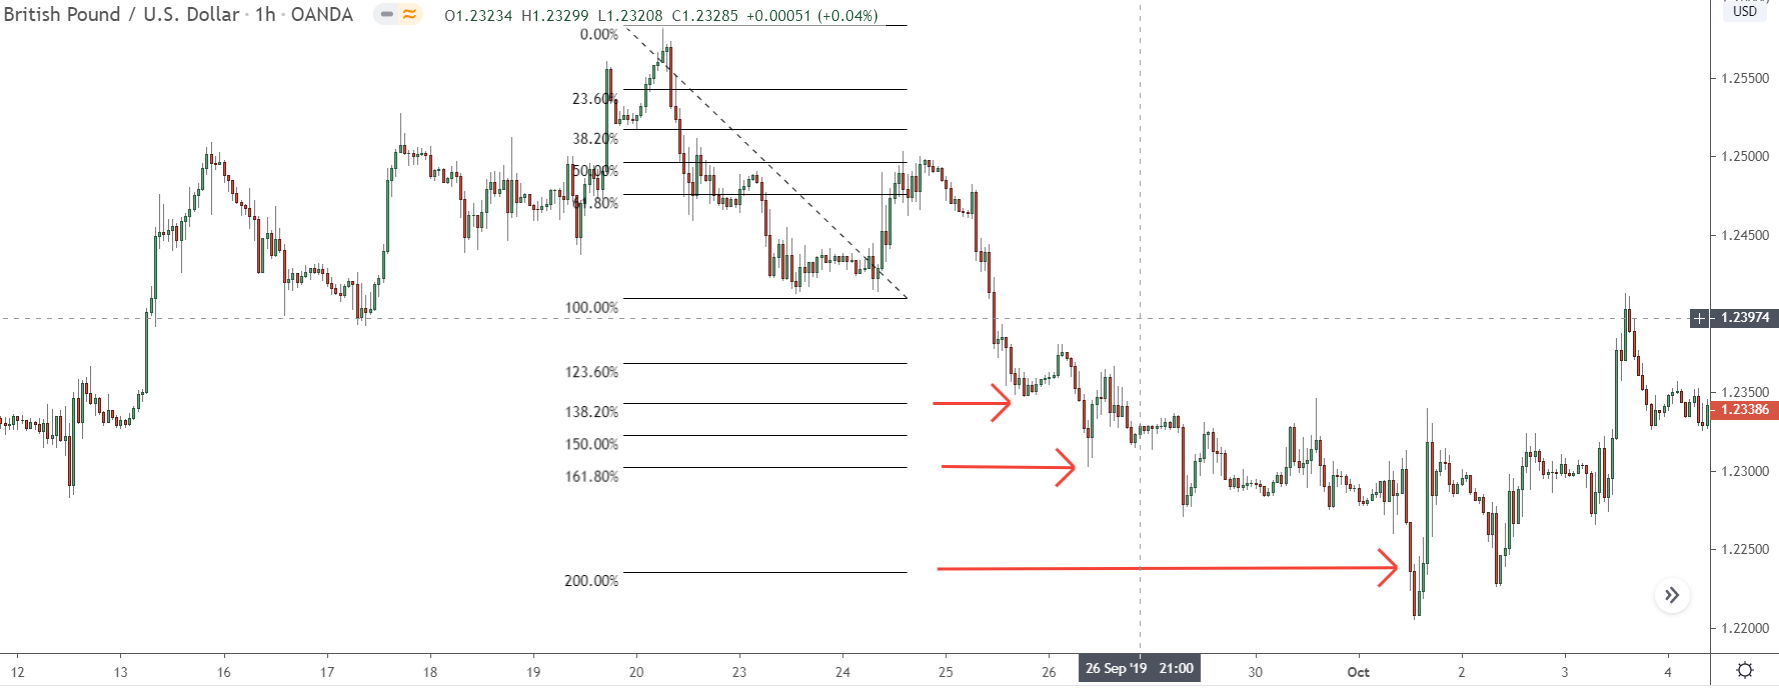
In the case of this swing, price reversed at two demand zones.
The first started from the 138.2% level. This was only a small retracement, but remember, that’s what we’re using these levels for. We’re not trying to predict where the next major reversal will begin; we just want to understand how the swing could develop.
If you do want to see where the swing could end, look for the zones that line up with the upper levels – 161.8% and 200% – like the second demand zone did.
Major reversals and big retracements usually begin from these levels, as by this point, price has moved close to the entire distance of the previous swing – the swing you’ve placed the tool on. So if you see price enter a zone around here and produce strong opposing price action, typically it’s a good sign a reversal is about to begin.
Keep in mind, too: supply and demand zones aren’t the only technical levels extensions often line up with.
Support and resistance levels and big round numbers often fall in line with the levels as well. These don’t cause retracements and consolidations as often as S & D zones, but they’re still worth watching for when they do.
#3 You Can Use Extensions As Take Profit Points Too
Knowing the right time to take profits baffles even the most experienced of traders, but it’s something the extensions can also help you out with…
Extensions show us the most likely points retracement and consolidations could begin. So by taking some profits off each time price reaches one of the levels, you can avoid the potential reversal – remember, we won’t know if it’s a retracement or reversal at the time – that could be about to take place.
A perfect example of this is below…
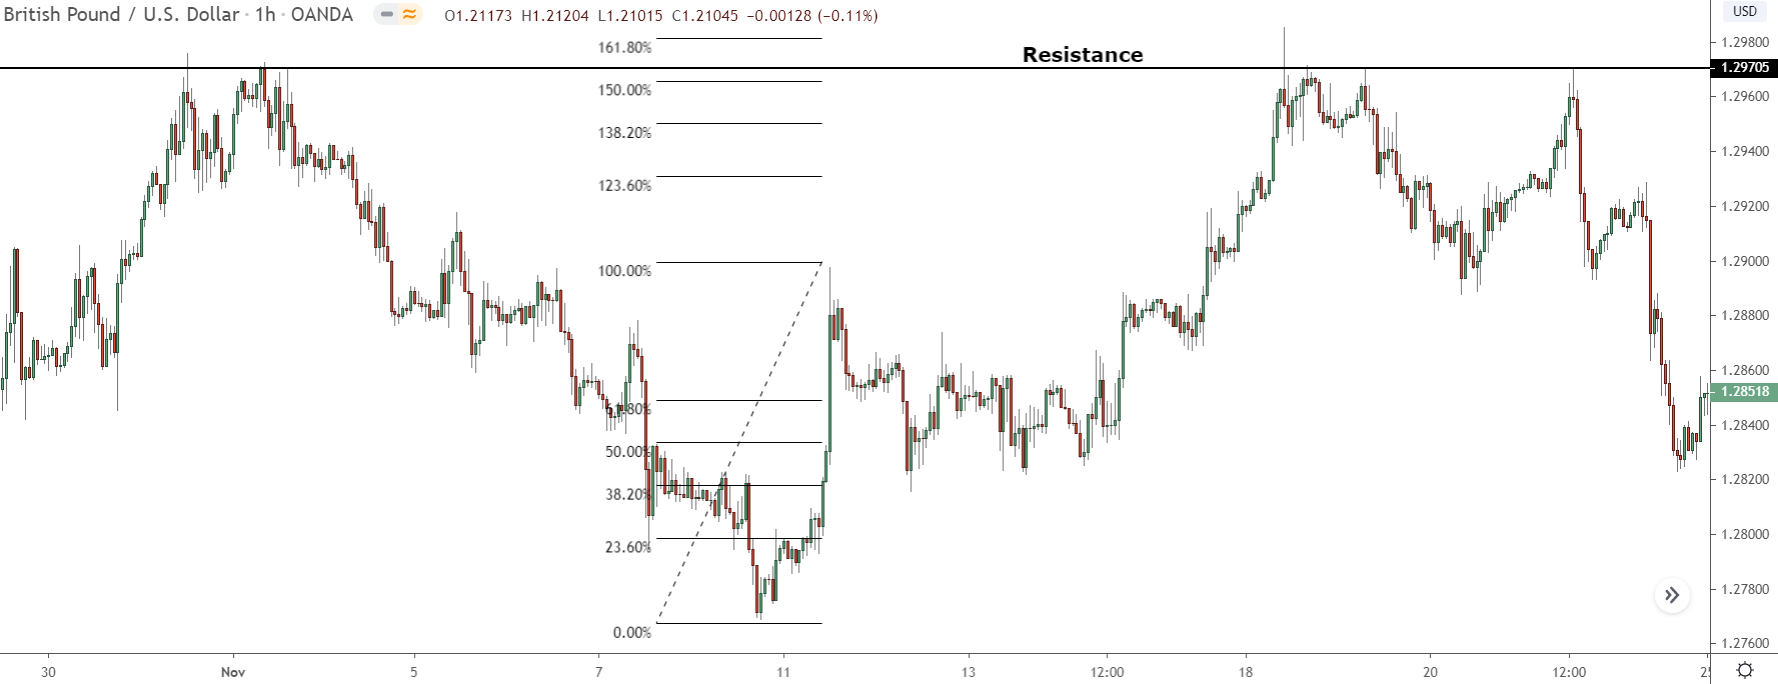
Price was rising strongly, so it looked like a continuation was likely. However, as soon as it reached the 161.8% level – which also had confluence with a resistance level – it reversed and set off a big retracement.
Normally, you probably would’ve lost a big chunk of profit here, as nothing suggested price was about to reverse.
With the levels, however, you knew a retracement, reversal, or consolidation could be about to begin. So by taking some off, you missed out on the reversal and kept most of your profit.
Another cool way to use extensions in your trading.
Summary
It probably won’t take you long to get to grips with fibonacci extensions. If you have experience with the retracement tool, you’re already halfway there… they’re basically the same thing anyway. Before you start, though, it is a good idea to go back and place some extensions on previous swings.
That’ll give you a sense of how price could interact with the levels when you start using them in real-time, so it’ll make it easy for you to know what price action to look for to see if a retracement or reversal is beginning.
All in all, while extensions may not be at the top of your list of best trading tools, they’re well worth checking out. They’ve served me very well over the years, and I’m sure they’ll do the same for you.
Be sure to check out my post on retracements, for more on fibonacci.