
Harmonic patterns are all the rage these days, offering traders low risk entries into high probability reversal trades.
The patterns come in many types, usually resembling a simple shape or structure.
Today, we’re going to look one of the most popular…
The Gartley pattern.
The Gartley is perhaps the most well-known harmonic pattern, but with their weird appearance, many traders find them tricky to identify not least trade. In this guide, I’m going to breakdown how you can find the gartley pattern and start using them to get into some mega reversal trades.
Sound good?
Here’s a quick refresher on what the Gartley is…
Overview Of The Gartley Pattern
Harmonic patterns come in many types, but few are as famous as the gartley.
Named after its founder (the great Hm Gartley), the Gartley pattern provides high probability entry signals into trends, both on short and long-term timeframes. Like all harmonics, the Gartley acts as a reversal pattern, usually appearing near the end of long trends or deep retracements.
The Gartley is a great pattern, but…
Are they super common in forex?
No, not by a long shot.
However, they do make great signals.
So, keep your eyes open.
The Gartley uses Fibonacci rations to determine its formation.
For a valid Gartley to form, the swing structure must meet specific fib ratios.
The idea is that because Fibonacci ratios appear in structures in nature, they can also give rise to formations in forex. The Gartley, along with all other harmonic patterns, is one of those formations – and a great one at that.
Identifying The Gartley
For many traders, identifying harmonic patterns is a pain in the ass.
And I’m sorry to say, the Gartley is no different… to a point.
Learning to find and identify the pattern will take some time, at least at first. However, once you understand how the pattern forms and memorize the structure in your head, identifying the Gartley should become a lot easier.
Let’s go through some examples…
Okay, here’s what the bullish Gartley looks like – note the M like structure?
All Gartley’s develop from a ABCD pattern, which form the basic structure of most price moves, but with an additional significant high or low preceding the pattern.
Bullish patterns are always preceded with a major high.
Bearish patterns are always preceded by a major low.
Being reversal patterns, Gartley’s signal a reversal of the trend.
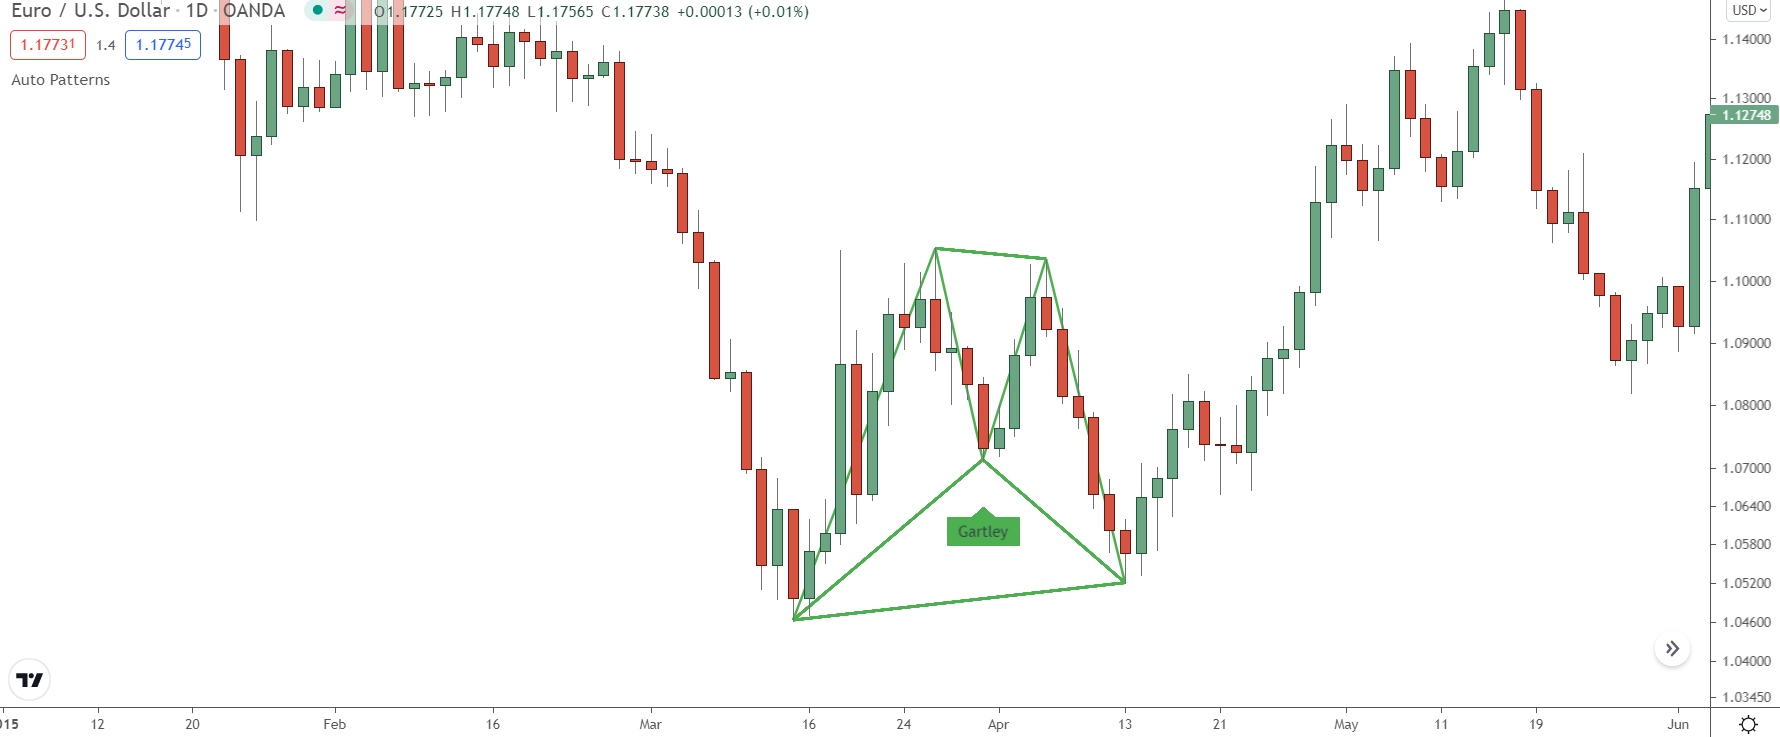
Here’s one I found earlier…
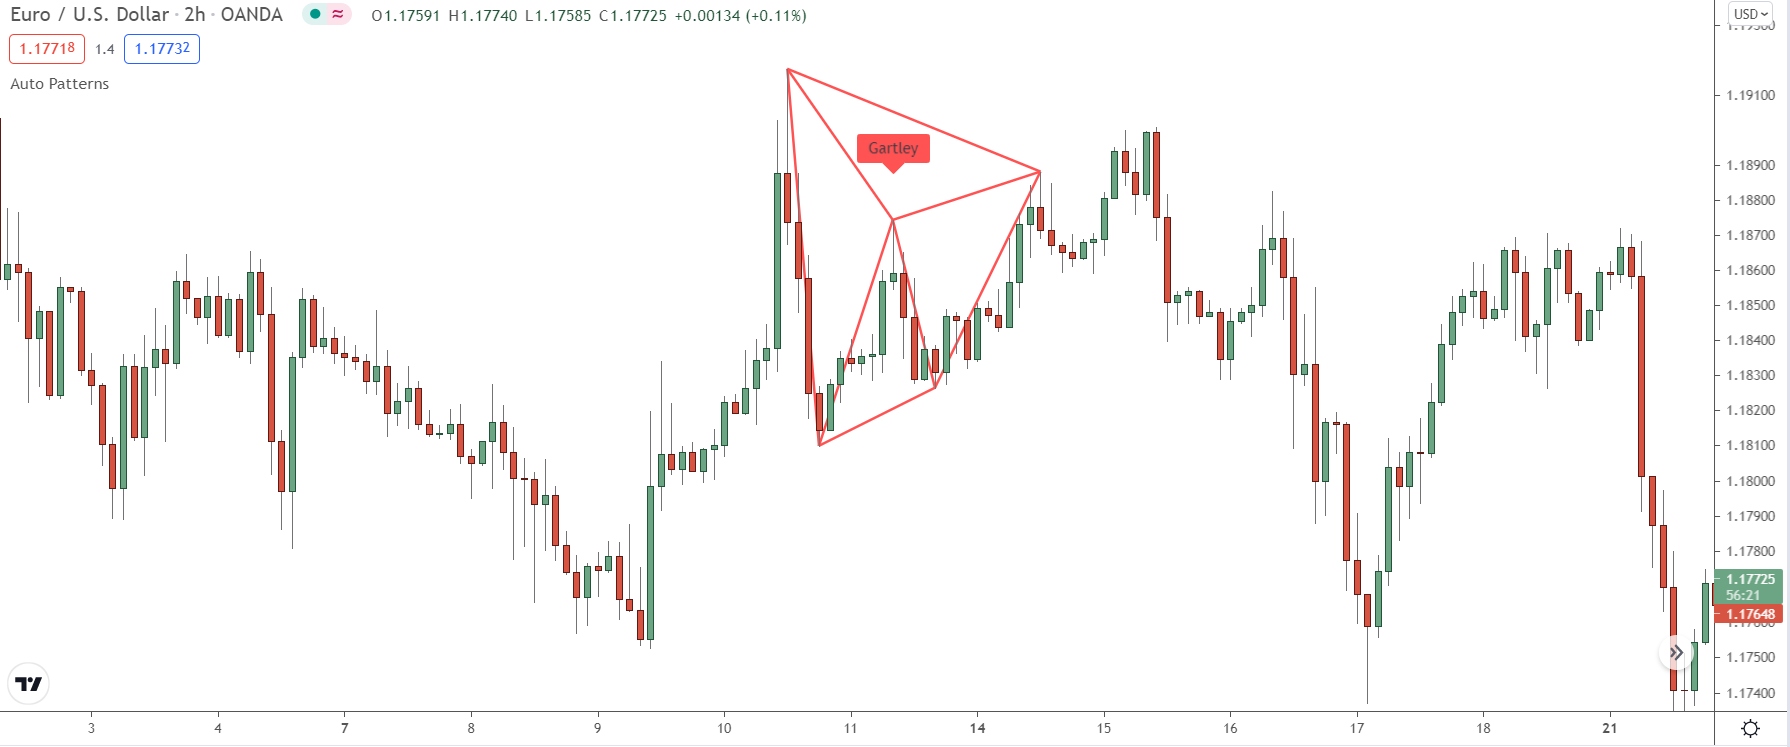
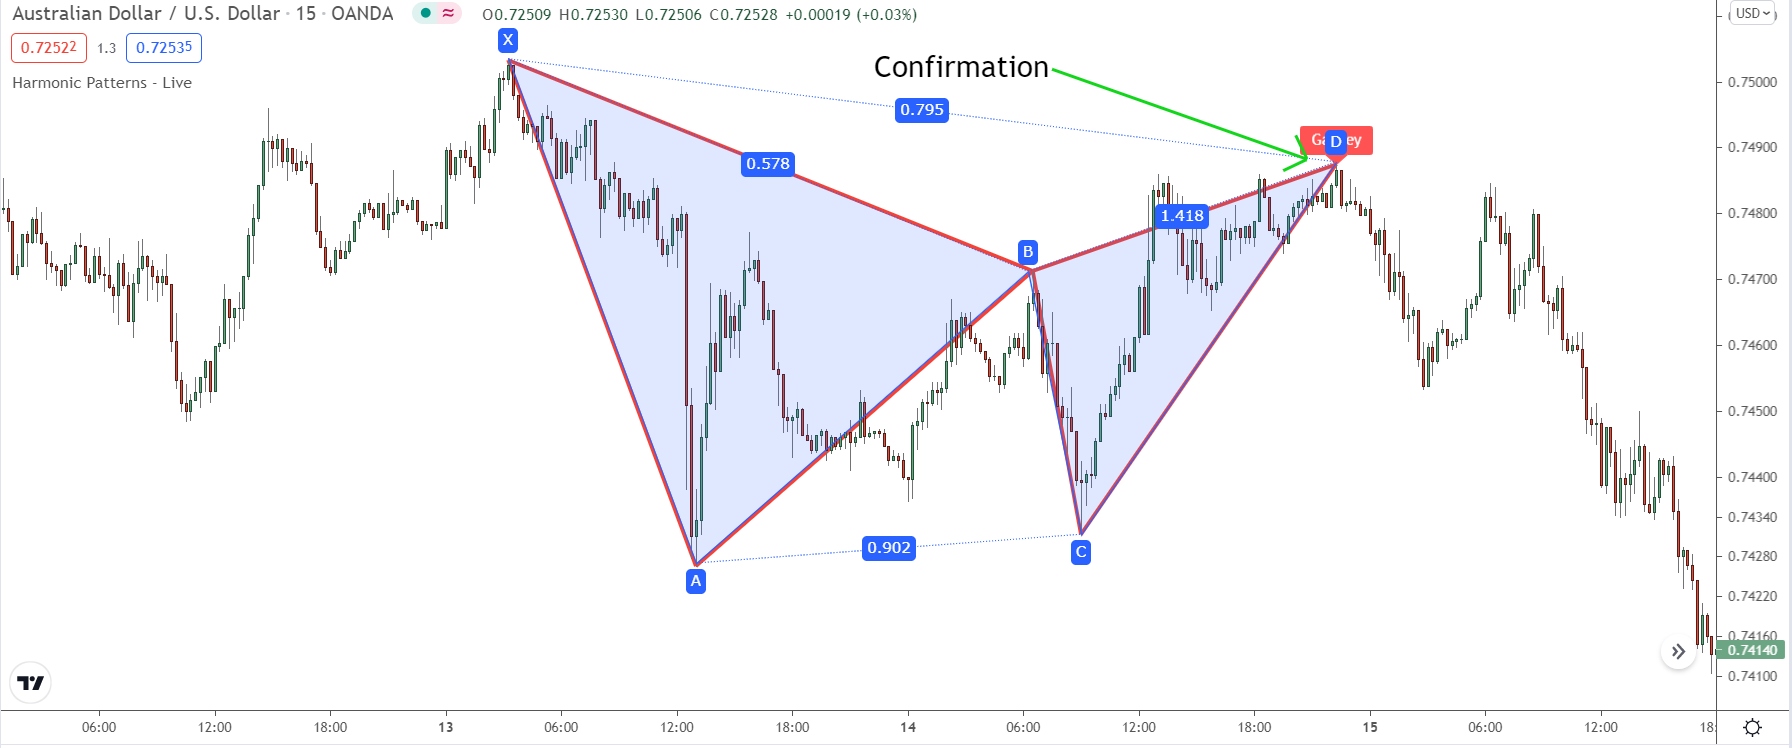
This is a bearish Gartley.
See how the pattern resembles a sunken M and contains the XABCD structure?
Now, to identify a Gartley, you must measure each swing in the pattern and see if they line up with certain Fibonacci ratio’s.
Let me show you…
Important: To quickly find harmonic patterns, check out the “Harmonic Patterns By Lonesome” indicator on Tradingview. This automatically marks harmonic patterns for you on the chart, removing the need to locate them yourself.
Also, check out Tradingview’s Harmonic ratio indicator…
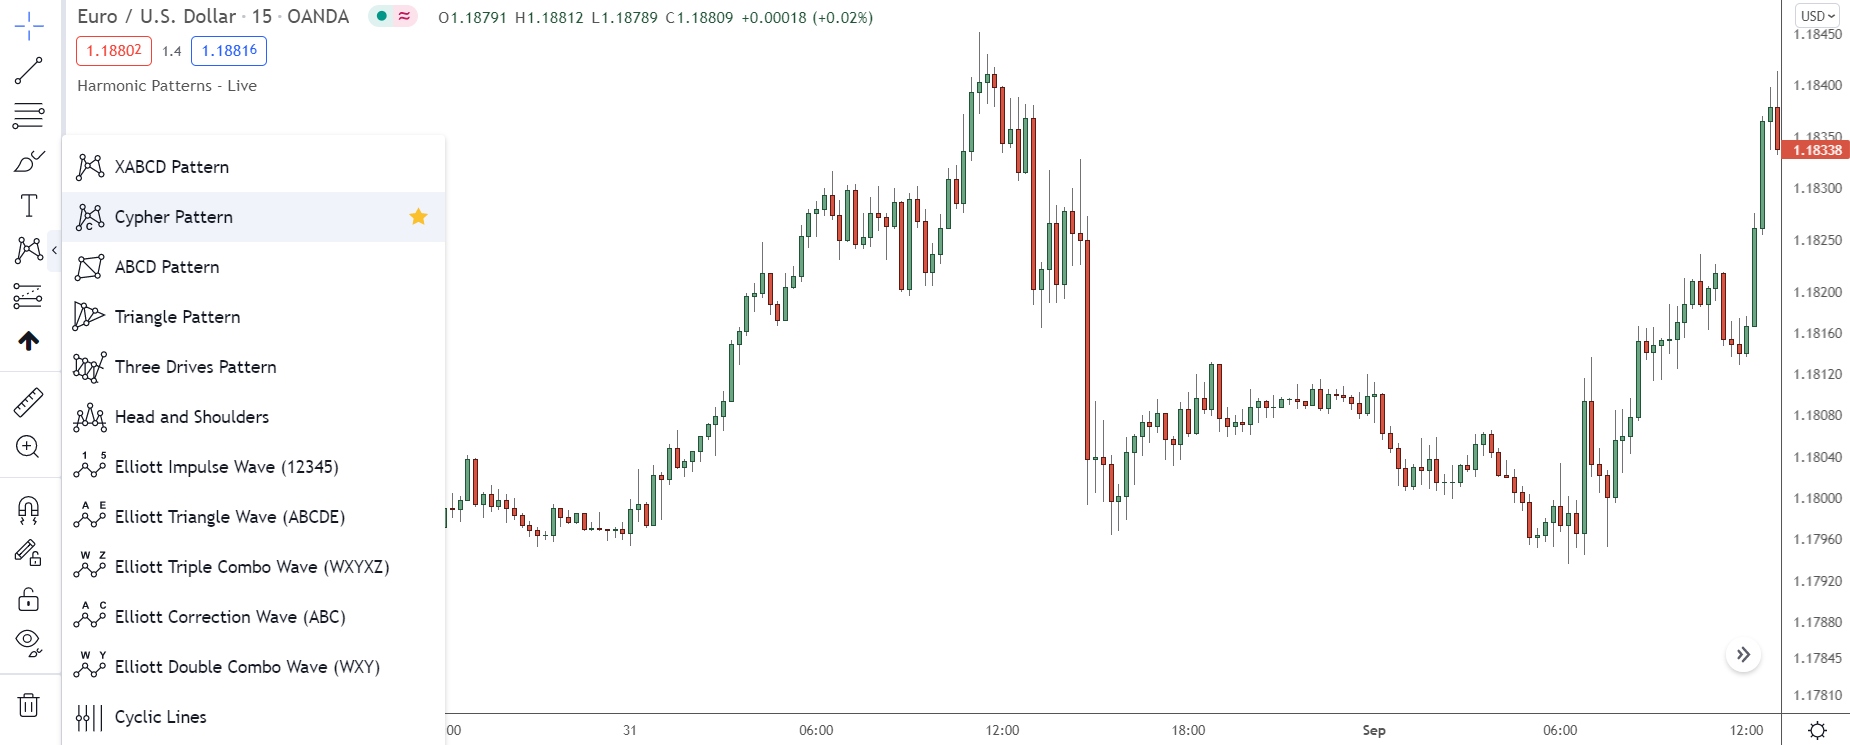
You can plot the swings of each pattern with this tool, making it easy to see if the correct ratios line up.
Make sure to use the “XABCD” pattern indicator for the Gartley.
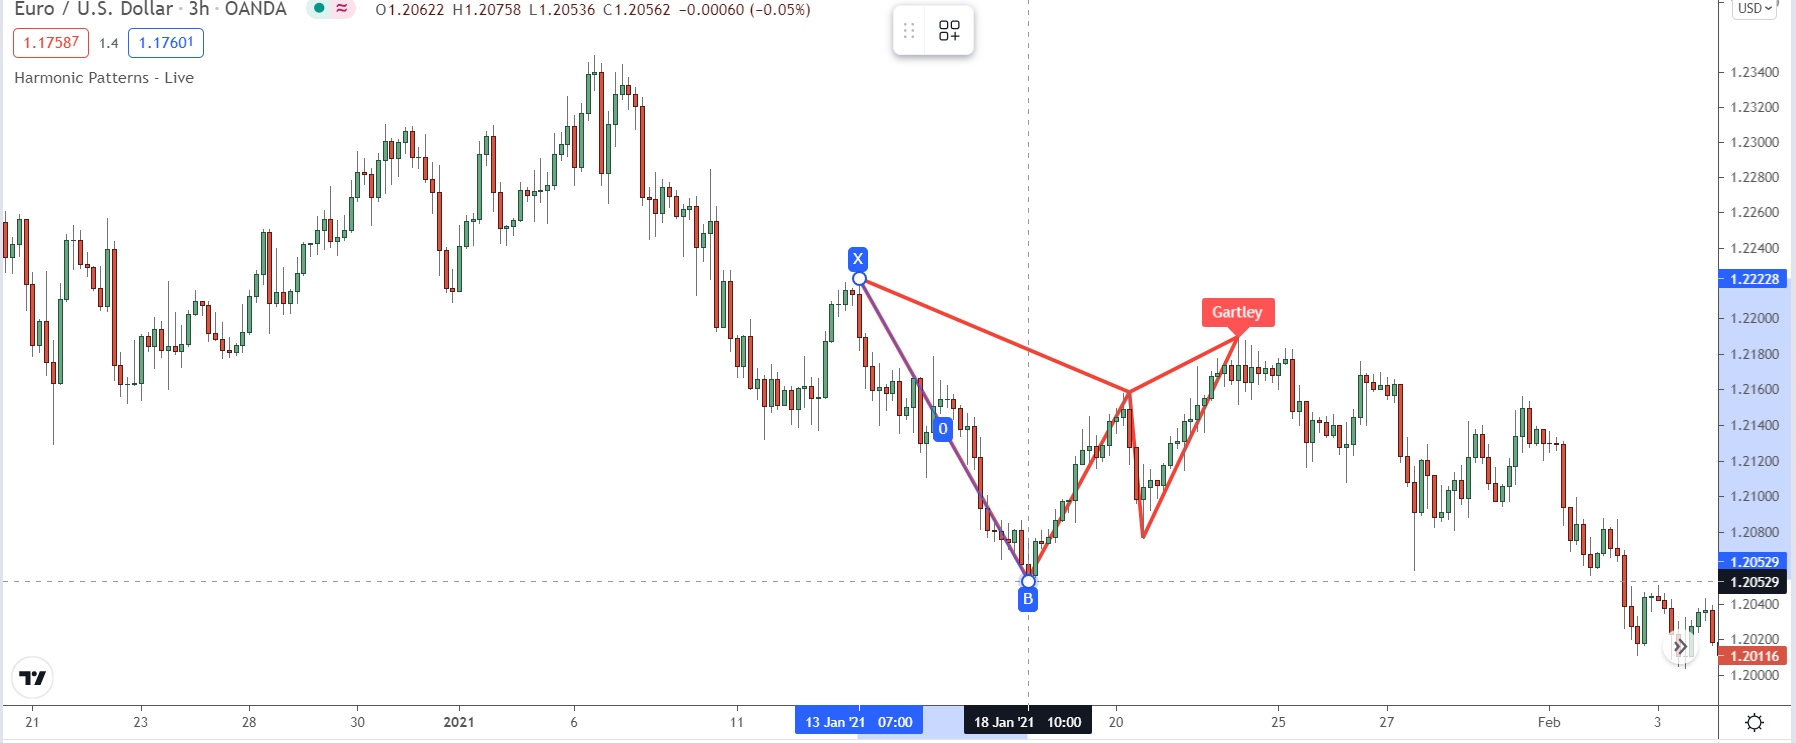
Step 1:
The first step is to locate swing 1, aka the swing from points from X – A.
- For bullish Gartley’s, this will always be a upswing.
- For bearish Gartley’s, it’ll always be an downswing.
We must place our harmonic tool on the swing high and drag down to the swing low before clicking. That sets the swings as X – A and allows to find the fibs for A – B.
Here’s how it looks…
Step 2:
Now we must check if swing A – B (the retracement) reaches the 61.8% level of X – A and reverses. That confirms the first part of the pattern and adds validity to this being a real Gartley.
In our case…
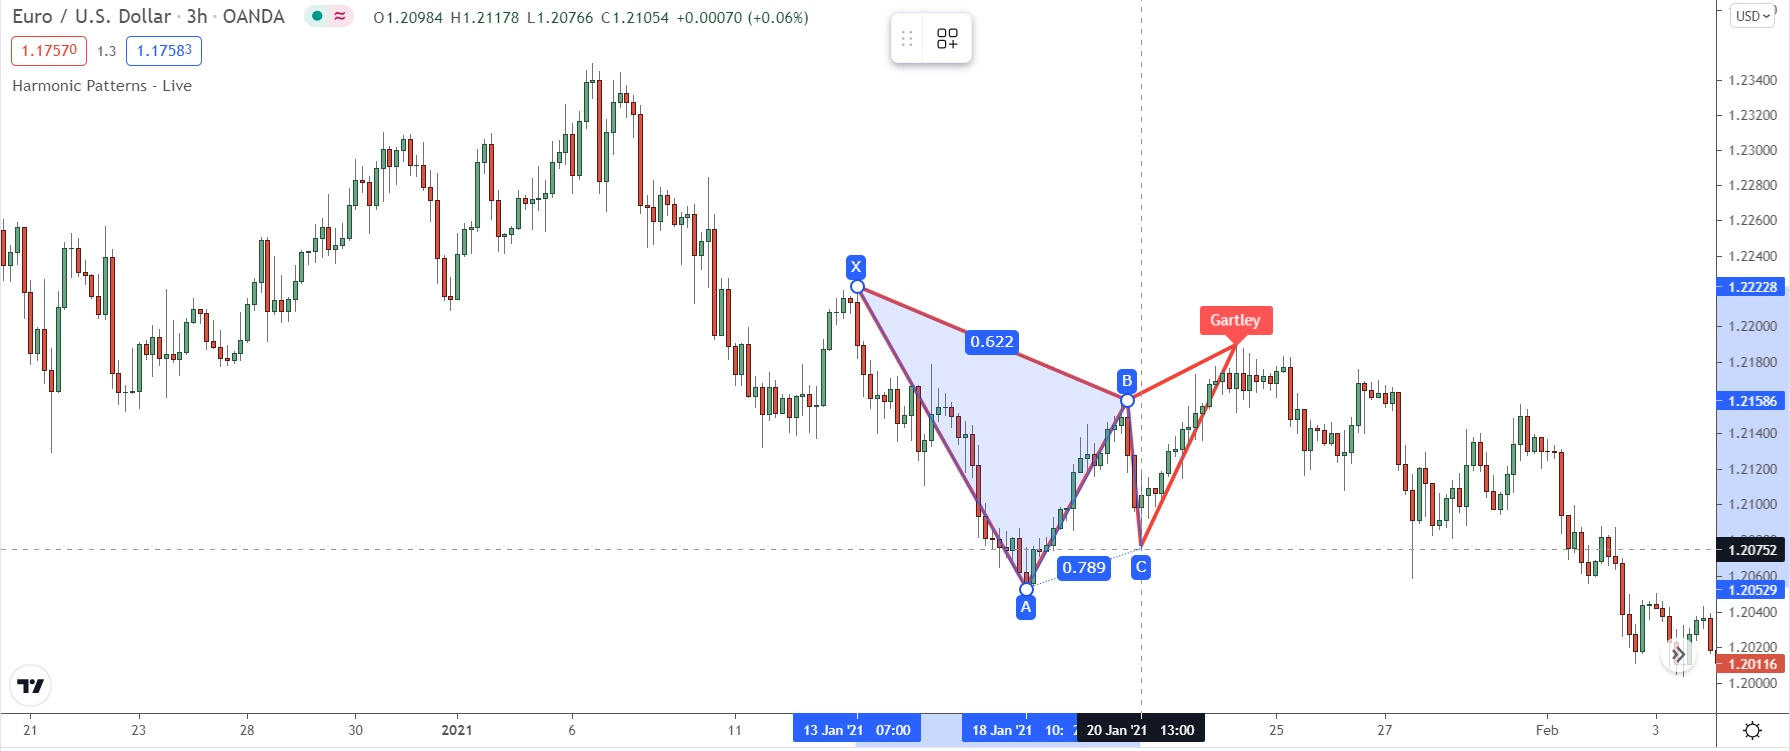
The retracement meets the 61.8% levels, confirming the A – B swing.
Click the retracement high to confirm point B.
Step 3:
Next up, swing B-C…
For this swing, price MUST retrace between the 38.2% – 88.6% levels of swing A – B.
Our swing comes in at 78.9%, qualifying the swing as valid.
Step 4:
Depending on which fib level swing B-C terminates at, swing C-D will extend either the 1.27.2 or 1.68.2 level of swing B-C.
If B-C reversed close to the 38.2% level, C-D should terminate around the 1.272% level.
If B-C reversed close to the 88.6% level, C-D should end near the 1.618% level.
In our case, the B-C swing terminated close to the 88.6% level.
And low and behold…
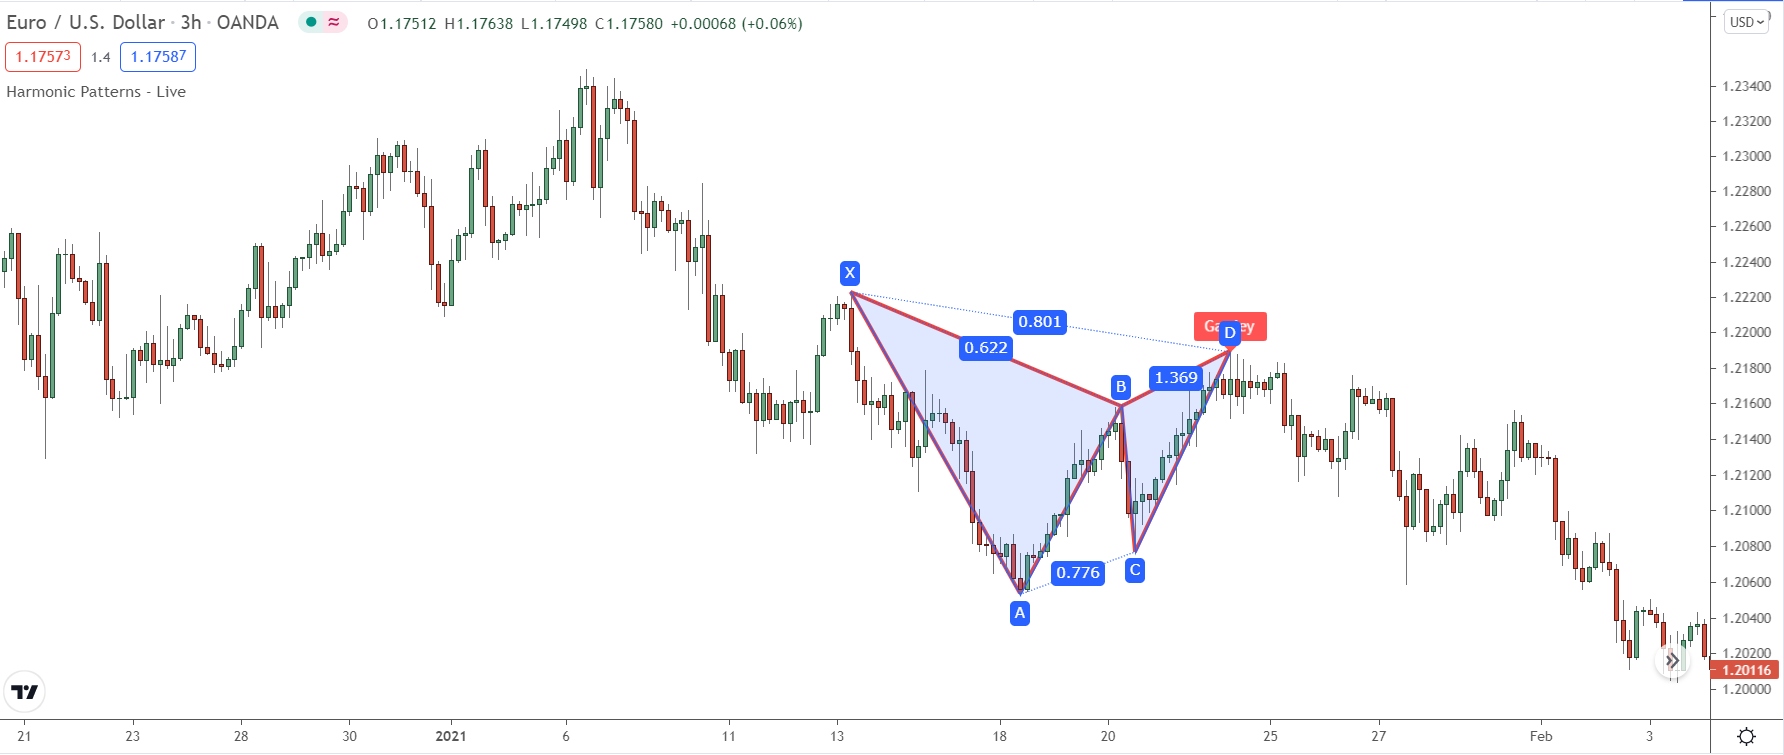
C-D proceeded to terminate at the 1.369% level, very close to the 1.272% level.
We can now watch for a trade entry, and hopefully, get into this reversal.
Just like clockwork, eh?
Key Characteristics Of A Great Gartley
Forex is more of an art than a science, being that nothing is ever exact.
And just like most patterns, that’s true with the Gartley. While never appearing identical, the Gartley will always contain the same basic structure but follow the same Fibonacci ratio.
To identify the best Gartley, watch for these charactisicts…
#1: Move AB should be the .618 retracement of move XA.
#2: Move BC should be either .382 or .886 retracement of move AB.
#3: If the retracement of move BC is .382 of move AB, then CD should be 1.272 of move BC. Consequently, if move BC is .886 of move AB, then CD should extend 1.618 of move BC.
#4: Move CD should be .786 retracement of move XA.
How To Trade The Gartley Pattern
While identifying the Gartley can be a bit of a pain, trading the pattern is surprisingly easy.
There are two ways to trade the Gartley, one being the “classic” method and the other being my own method that uses supply and demand zones.
Here’s the classic method…
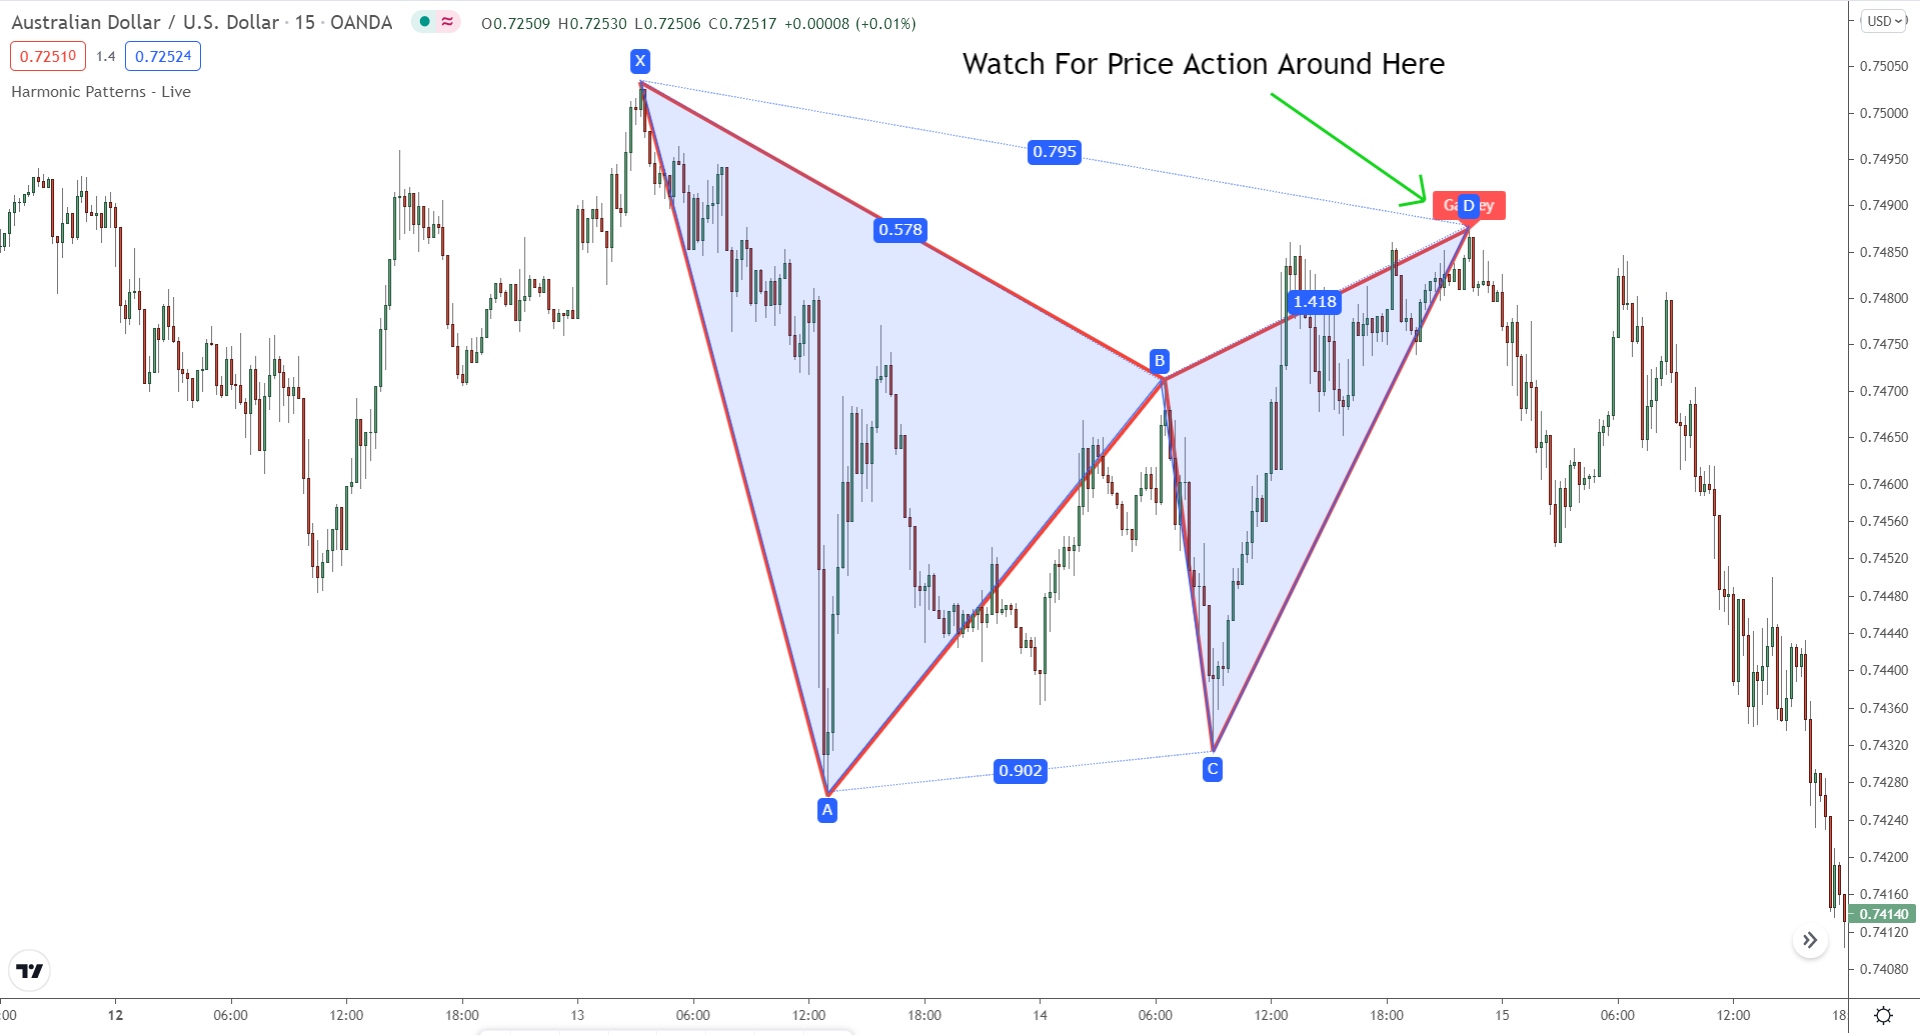
FIRST: See if swing C-D finds support at 127.1% or 161.8% of swing B-C.
NEXT: Wait if price action to confirm a move away from the level.
FINALLY: Enter a trade and place a stop loss.
- For bullish Gartleys, place the stop BELOW the D swing low.
- For bearish Gartleys, place the stop ABOVE the D swing high.
The classic method works well – the signals are easy to spot, and the stop location is clear to all. However, with one minor change, you can make this entry strategy 10x better than before.
And this is where my method comes in…
For the most part, my way mirrors the classic method…
But with a key difference: we use supply and demand zones.
Usually, swing C -D will terminate inside a supply or demand zone. The swing will extent to the 127.4% level and terminate inside the zone.
That provides additional confluence price will reverse AND makes them easier far easier.
Because now, we can wait for a signal inside the zone rather than using the exact fib level.
For example…
Price taps the 127.6% level, confirming swing C – D is valid.
Now we must wait for bearish price action – pin bars engulfs, etc.
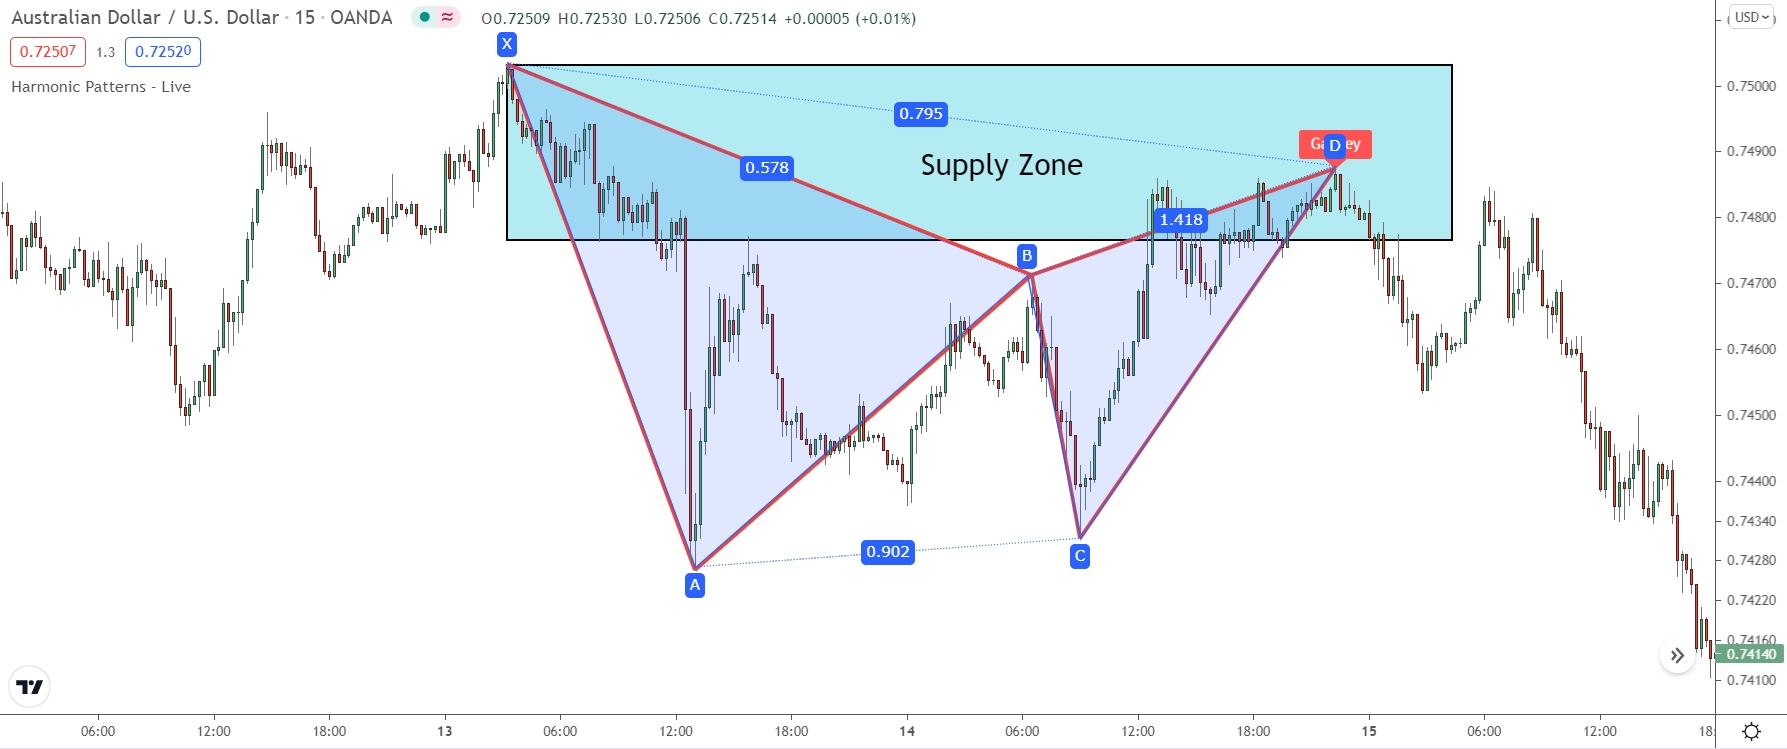
Problem is, what if these signals form above the level?
How will we know these signals are valid if they don’t touch the level?
Does that mean you can’t enter?
If you use the classic method, you won’t know.
If you use S & D zones, however, it doesn’t matter.
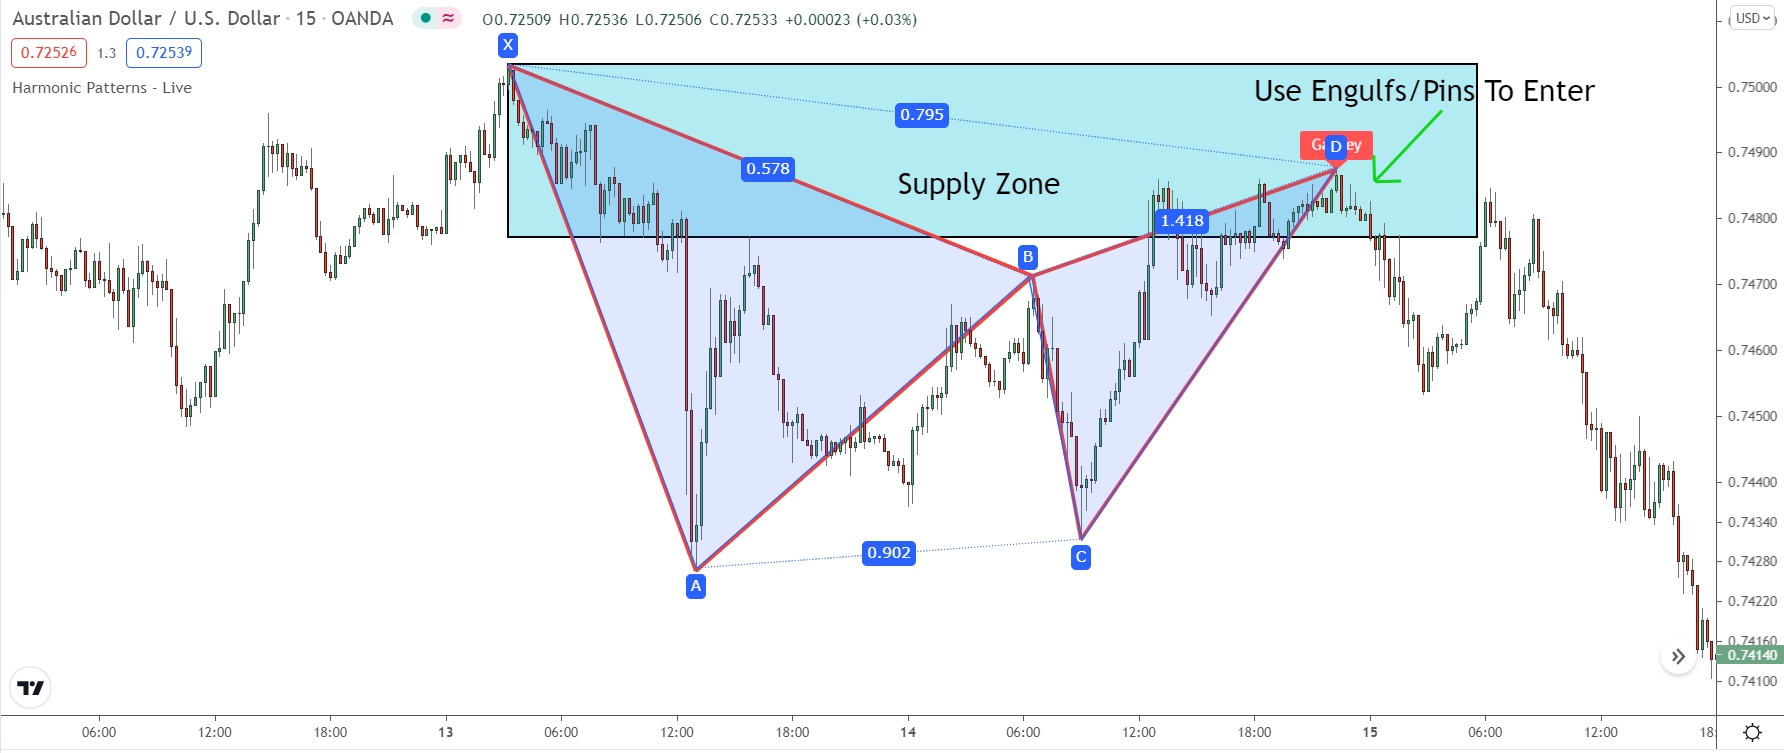
The width and height of the zone increase the area price can produce a signal.
We now know any signal that forms inside is valid for trading, removing the uncertainty and making the pattern far easier to trade. We also get a tighter entry because we enter at the source of the continuation swing (D), increasing our potential profit.
That’s not all either…
See the stop position?
When you use a zone, your stop goes above or below the zone – the same as trading S & D normally.
This decreases your risk because the zone gives price a defined area to reverse in.
We don’t need to worry about price spiking the swing high (or low for bearish Gartley) at D because our stop will be above or below the zone.
Meet The Family: Breaking Down 3 Gartley Types
The Gartley pattern has been around for decades now. Over time, disciples of harmonics discovered their own types of Gartley. These sub-patterns all follow the same structure but abide by different fib ratios, which changes their appearance slightly.
Best of all, they’re all named after animals.
Here are the 3 Gartley types…
The Crab
Perhaps the most famous Gartley formation, the Crab pattern was discovered in 2000 by our friend Scott Carney.
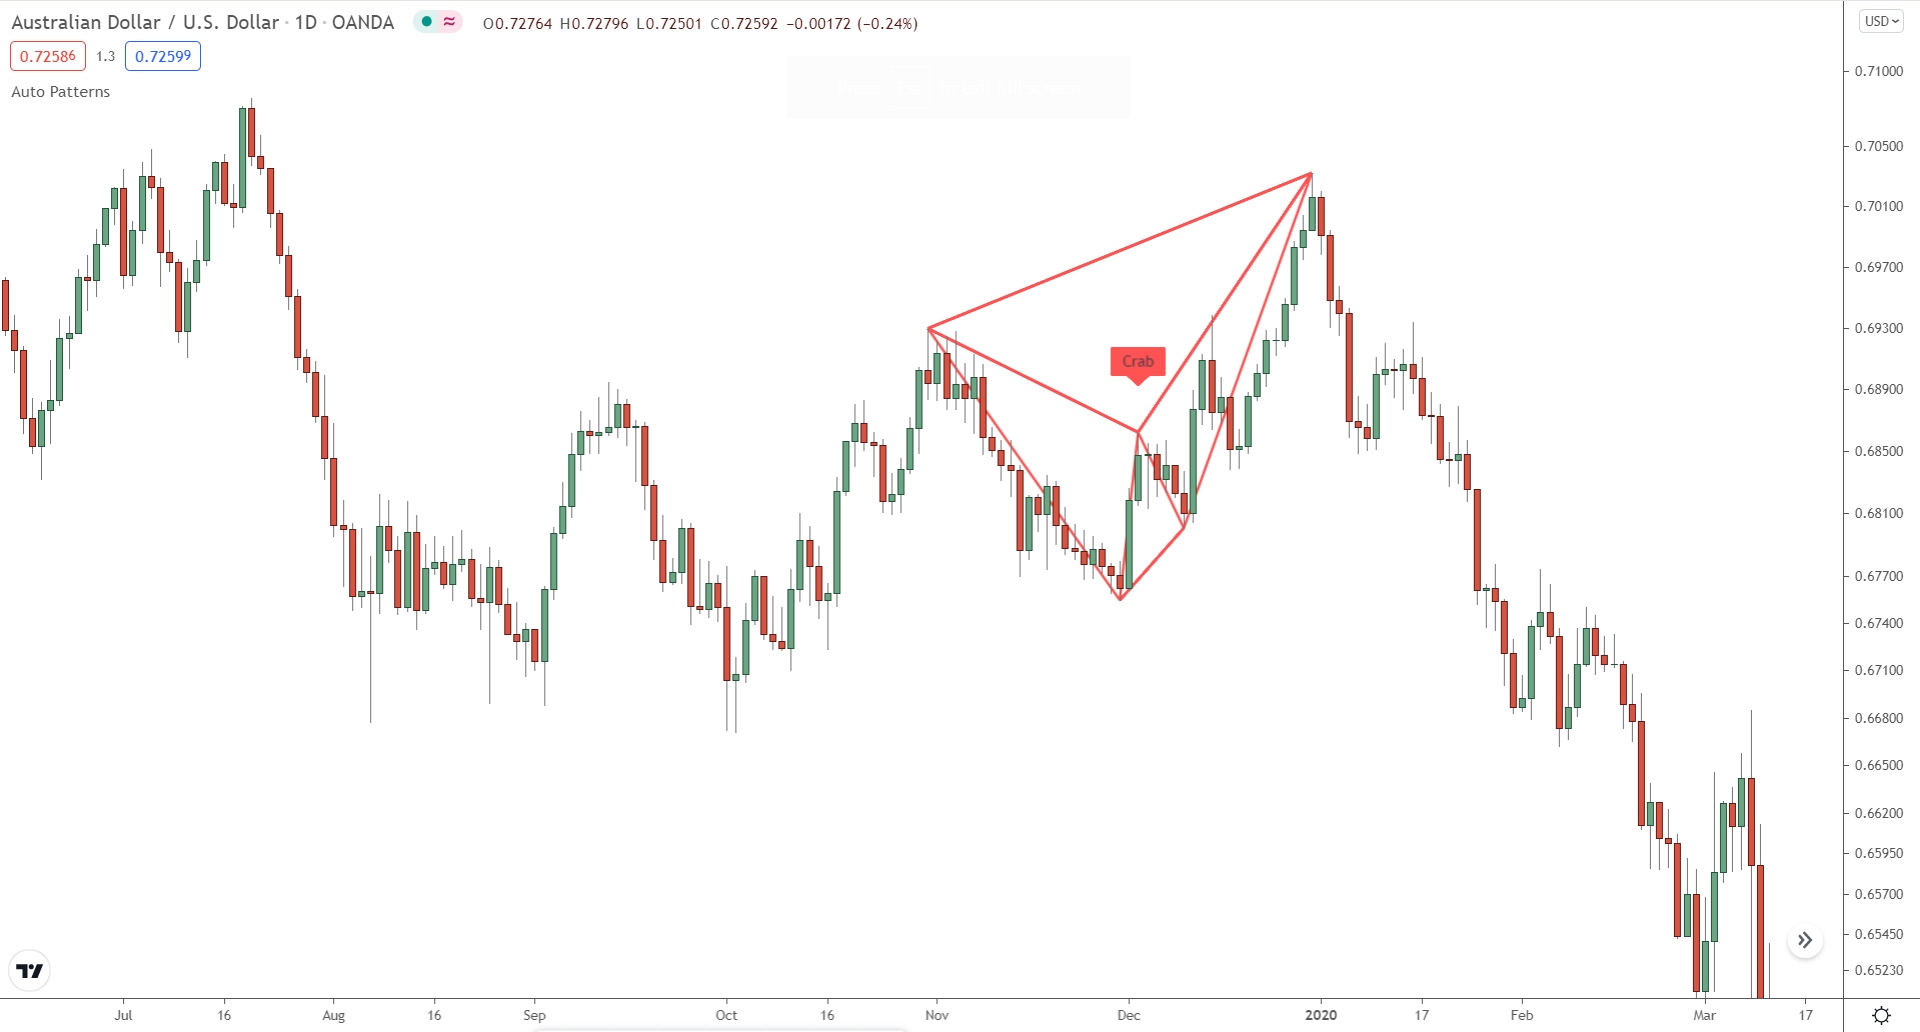
Scott describes the crab as the most accurate Gartley formation, being that the Price Reversal Zone is extremely wide and often leads to huge reversals.
Again, like the other patterns, you trade the crab using the same steps explained earlier.
- Check the pattern has formed,
- See if swing C – D terminates inside an S or D zone.
- Enter once you see the right price action.
Key Characteristics Of The Crab
To identify a crab pattern, check the ratios below…
#1: Swing A – B must be 38.2 or 61.8 retracement of swing X – A
#2: Swing B – C must be either 38.2% 88.6% of move A – B
#3: If retracement of B – C is 38.2% of A – B, swing C – D should terminate at 2.24% level of B – C
If swing B – C is 0.88.6 of A – B, swing C – D should extend to 3.618 of swing B -C
#4: Swing C – D must be 0.886 of move XA.
The Bat
No prizes for what this pattern looks like…
The Bat pattern was identified by our friend Scott Carney, an avid harmonics disciple who also discovered the Crab pattern.
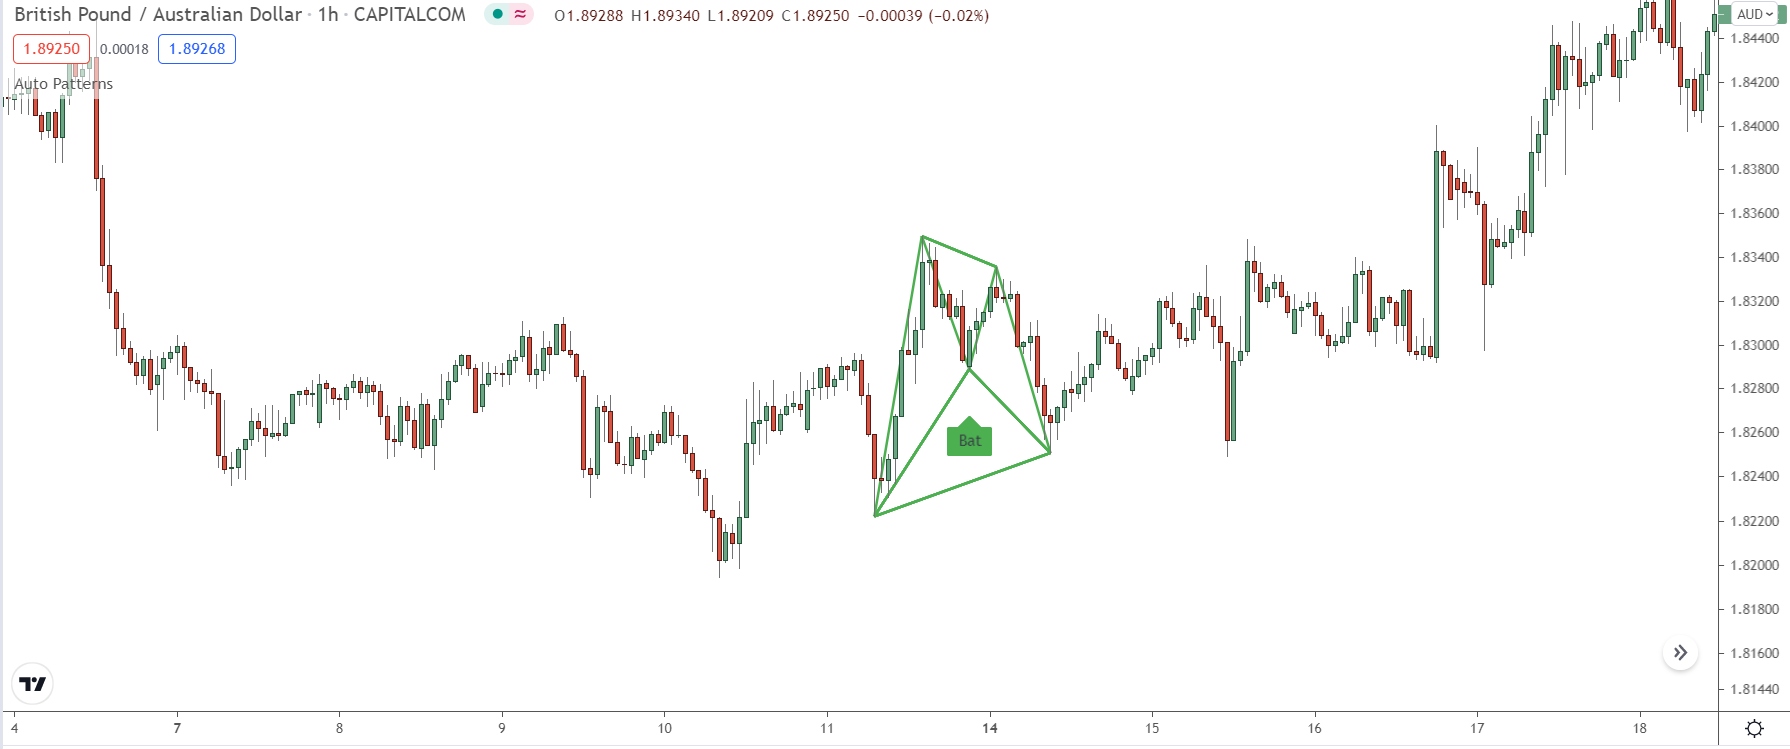
Structurally, the Bat pattern looks like… a bat!
The swings are almost even, making the pattern look like a bat with its wings spread.
Being sub-variety of the Gatley, the Bat follows slightly different fib ratios. However, to trade the pattern, you follow the same steps explained earlier: watch for PA signals to form inside an S & D zone once swing C – D terminates.
Key Characteristics Of The Bat
To identify a Bat pattern, check the ratio’s below…
#1: Swing A – B must be a 38.2 0r 50% retracement of point X – A
#2: Swing B – C must be 38.2% 88.6% of move A – B
#3: If retracement of B – C is 38.2% of A – B, swing C – D should terminate at 1.6% level of B – C
If swing B – C is 0.88.6 of A – B, swing C – D should extend to 2.618 of swing B -C
#4: Swing C – D must be 0.886 of move XA.
The Butterfly
And finally, we have the Butterfly pattern.
Discovered by Chris Boyce, the Butterfly is another Gartley variation that can provide you with high probability entries into existing trends.
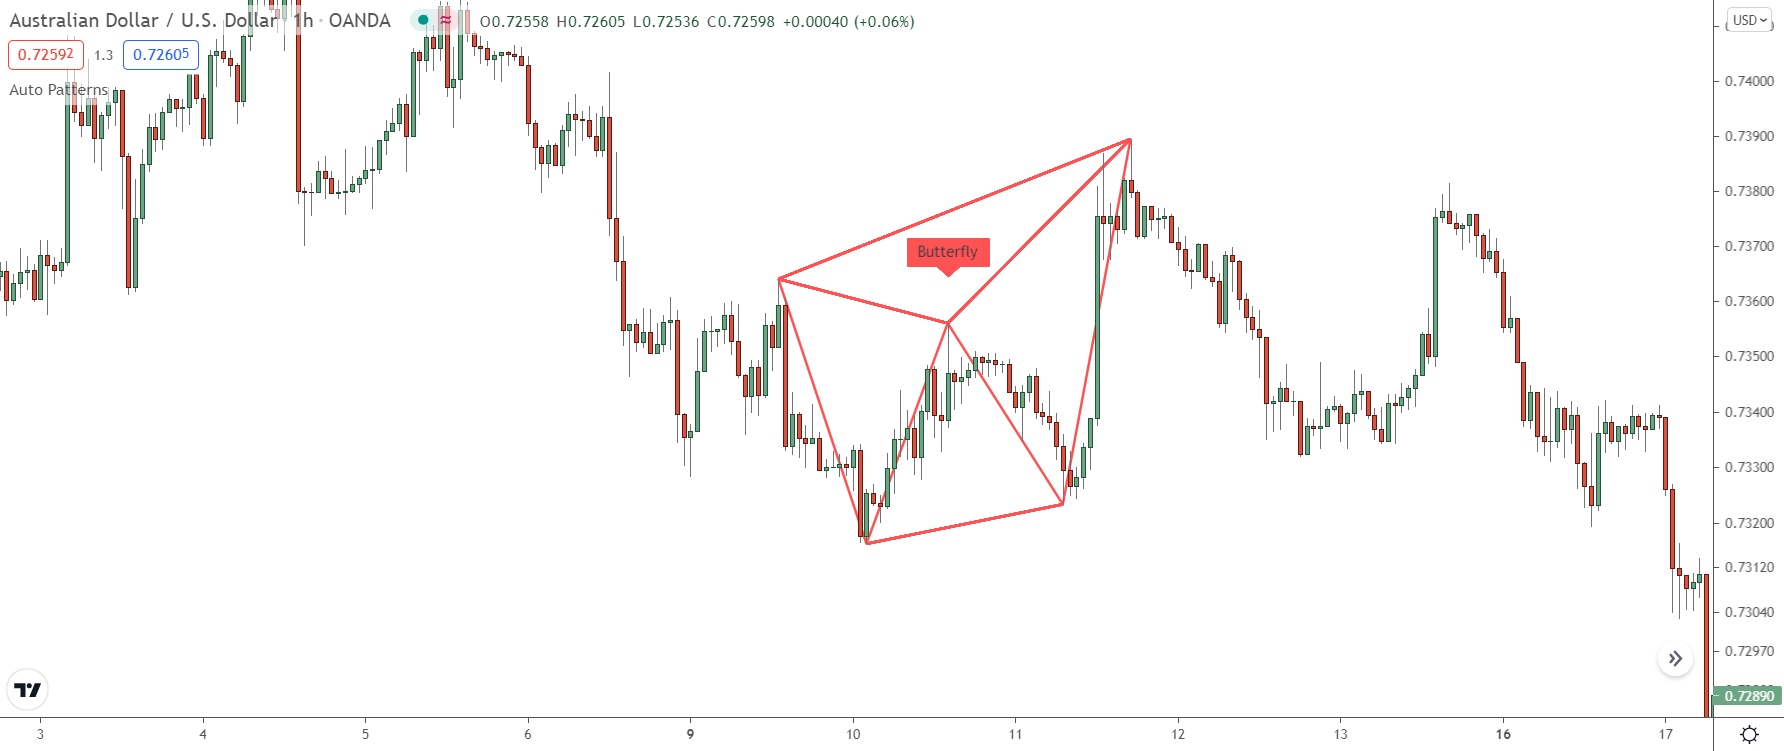
In this pattern, the ratios and swing structure combine to resemble a butterfly.
Here’s what to look for…
Key Characteristics Of The Butterfly
To identify a butterfly pattern, check the ratio’s below…
#1: Swing A – B must be a 0.768 retracement of swing X – A
#2: Swing B – C must be 38.2% 88.6% of move A – B
#3: If retracement of B – C is 38.2% of A – B, swing C – D should terminate at 1.6% level of B – C
If swing B – C is 0.88.6 of A – B, swing C – D should extend to 2.618 of swing B -C
#4: Swing C – D must be 0.886 of move XA.
Summary
Go back and see if you can identify some old Gartley patterns on your charts. That’ll get your eyes accustomed to their complex structure, making them easier to pick out and then trade.
Check how price reverses after the pattern forms too.
You’ll notice, price usually reverses from a S & D zone, as I said earlier.
That’s where you always want to watch for your entry signal.
Entering at the fib level works fine too, but zones make the pattern 10x easier to use not mention more profitable to trade.
So, that’s the Gartley for ya – not bad, eh?