
So, you’ve been staring at your chart, when suddenly, a candlestick with a long lower shadow appears.
You squint at it, puzzled.
What’s this mysterious candle trying to tell you?
Is it a bullish signal, a bearish signal, or just a funky-looking candlestick?
Well, buckle up, because we’re about to journey deep into the world of “long lower shadow” candlesticks.
We’ll decode these enigmatic patterns, shed light on their formation, and unveil how they can provide clues on what the banks and other big players are upto.
Sound cool?
Let’s get cracking!
Overview: What Are Long Upper Shadow Candlesticks?
Canldesticks come in all kinds of weird shapes, colours, and sizes, but have you ever seen a candlesticks with a little line sticking out above their body.
Candlesticks, like these, for example….
Seen these before?
Ladies and gentlemen, I present…
Long upper shadow candlesticks.
Let’s break them down:
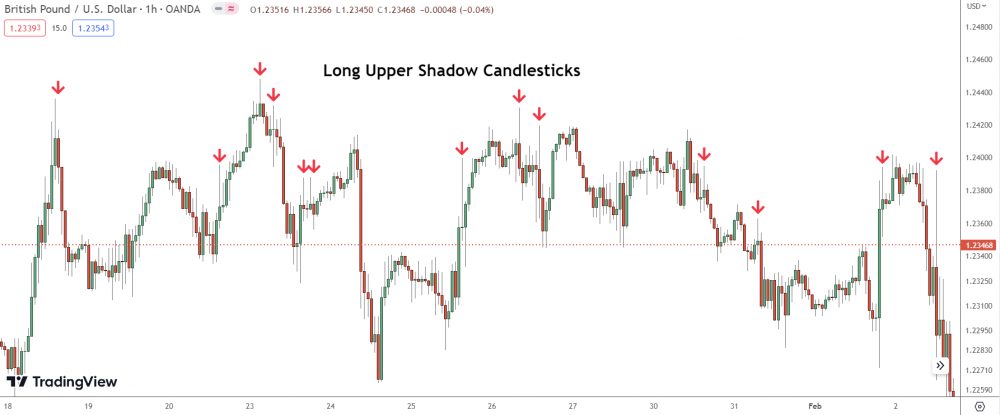
Long upper shadow candlesticks are candlesticks that form with a long shadow (or wick, as some call it) above the candle body. These candles form frequently in forex and stocks, usually appearing towards the end of uptrends or large upswings.
See the tiny thin line sticking out above the body?
YEH – That’s the long upper shadow.
The shadow shows price initally increased during the candlesticks formation but then declined, leaving a long thin line where price managed to reach.
Here’s some more long upper shadown candlesticks:
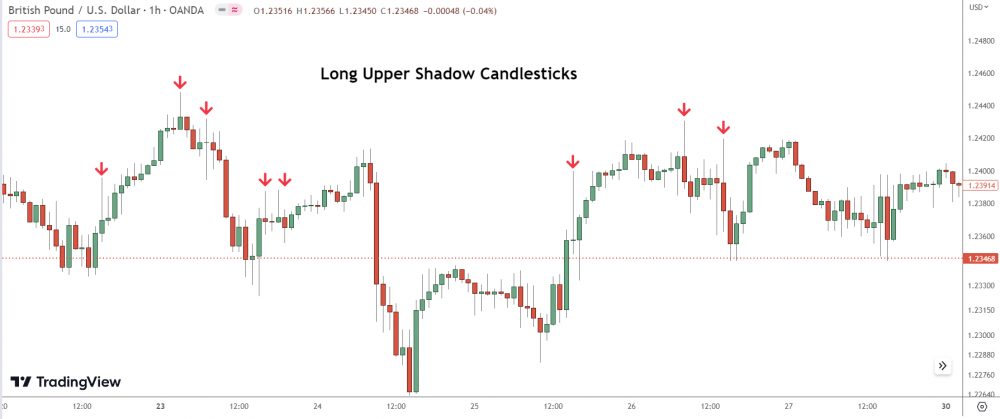
Keep in mind: Long upper shadow canldesticks are generally considered bearish, however, the candle itself can appear bullish (green) or bearish (red).
In either case, the candle signals weakness to the upside.
The shadow indicates heavy selling entered the market to stop price moving higher. That’s why price declined and formed the long upper shadow. The question is…
Who started selling?
And why did they want price to fall?
(We’ll come back to this in the next section)
What Do Long Upper Shadow Candlesticks Signal?
Here’s the deal:
Knowing a long upper candlestick has formed won’t give you much useful information for your analysis; you need to know why the candle has appeared.
But wait, the candles form due to selling right?
Correct!
But who’s doing the selling?
And why are they selling?
Let me break it down….
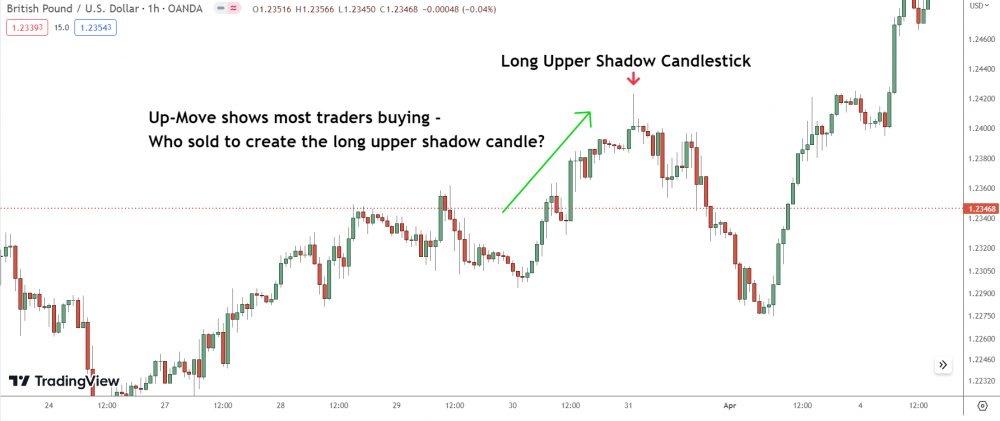
Long upper shadow candlesticks form due to the banks and other big traders selling. Only the big players can push price down during a strong rise. Normal retail traders (you and me) don’t have the funds or co-ordination to move price, so the candles always form due to the banks.
Now, here’s the important part:
The selling that creates long upper wick candlesticks can come from the banks executing 3 different trading actions:
- Taking profits off long positions.
- Closing open long postions.
- Entering new sell trades.
Each action requries thousands of buyers – what we see during the inital rise creating the wick – so the banks use the buyers to execute one of these actions. Once they execute, price reverses, and we see a long upper shadown form.
What does this mean?
In short: Long upper shadow candlesticks reveal where and when the banks have exectued one of three trading actions.
*Mindblown*
For example:
Almost all the long upper shadow candlesticks above formed at a point when large market moving traders (banks, hedge funds etc) would want to take profits.
And how do you take profits off a buy?
By selling some of what you bought!
When the banks and other big players take profits, the selling consumes all the buy orders. Price then falls back towards the candle open, creating a long upper shadow. The shadow shows the big players have taken profits off their open long trades.
This could mean a couple of things:
- #1: The banks are expecting the uptrend to reverse.
- #2: The banks want a retracement to reposition at a better price.
Which one could it be?
Well, that’s where things get tricky…
To determine which scenerio is most likely we’d have to analysis the nearby technical levels (specifically S/D zones, as they form due to the banks) and factor where we are in the context of the higher timeframe trends, since higher timeframe bank traders have different goals than lower timeframe traders.
- LT traders may only seek to profit from the current swing.
- HT traders may view the current swing as a retracement to reposition in the HT downtrend.
See my point now?
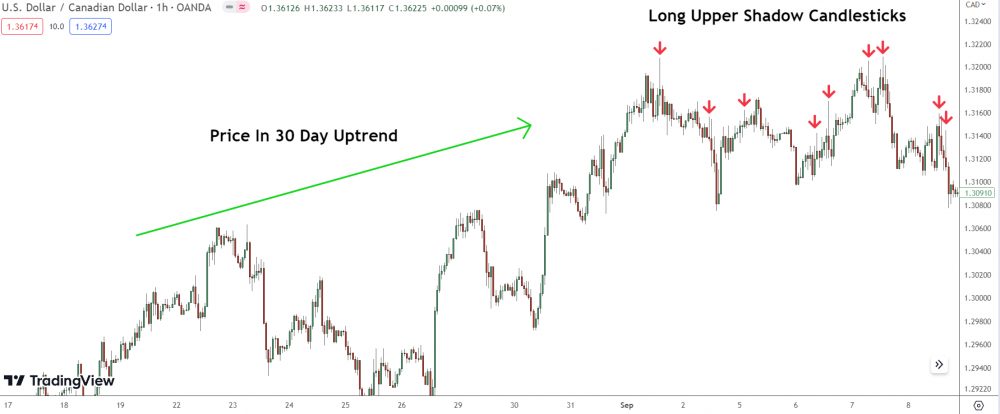
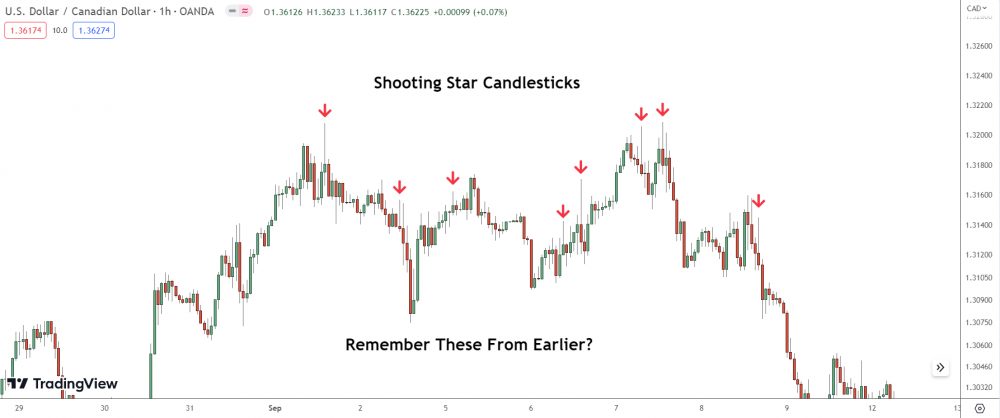
One thing I can say: Most long upper shadow candlesticks indicates banks taking profits, suggesting a minor retracement or pause is imminent.
(This is especially true if multiple long upper shadow candlesticks form)
The more candles = the stronger chance of a retracement or pause.
Each candle shows the banks taking profits, which indicates they expect price to reverse in the short term. Most likely because they want to reposition themselves in the current trend.
Watch for price to reverse at a nearby technical level, such as:
- Supply Zones.
- Resistance levels.
- Pschological numbers.
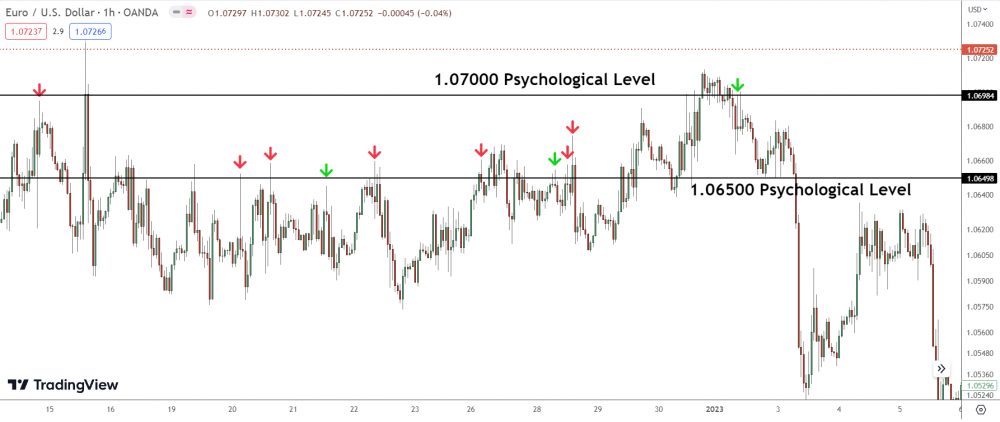
In our case…
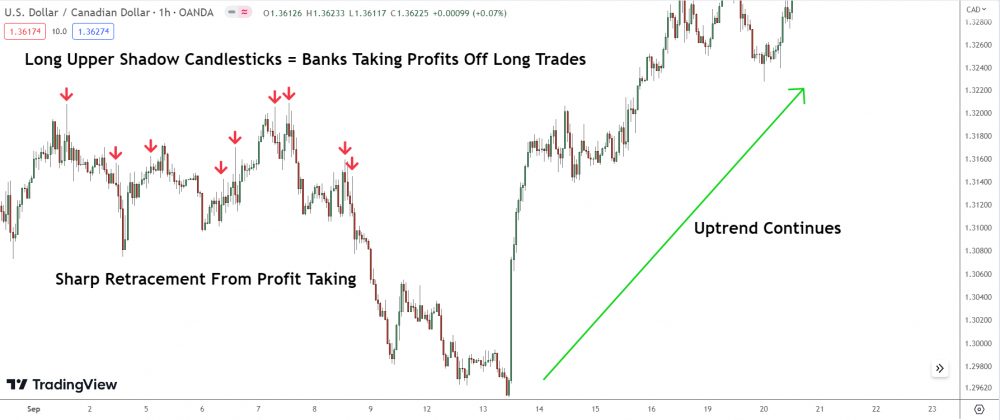
After a few long upper shadow canlesticks form (suggesting profit taking), we see a false break lower into the 1.30000 pschological level, before price reverses.
Then, a significant upmove begins.
Simple, eh?
But wait… what about full blown reversals?
Which long upper shadow candlesticks show that?
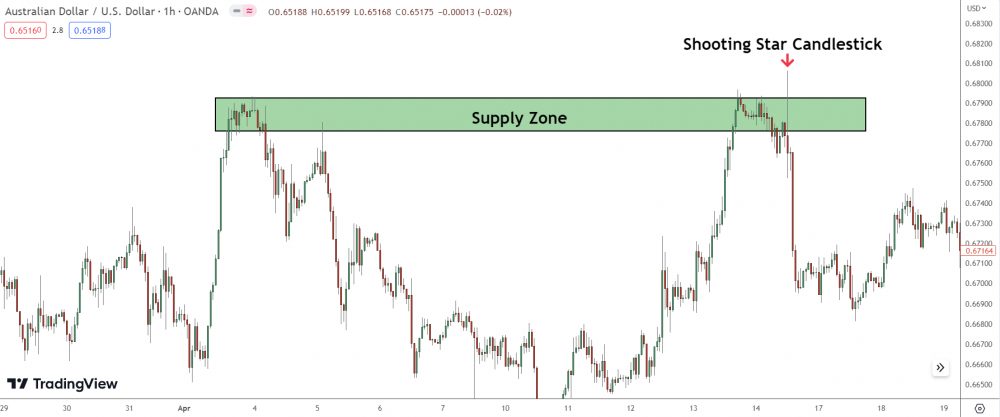
Well, again, that takes a little more analysis than simply looking at the candles themselves. However, one common factor are candles with a massive upper shadow.
For example:
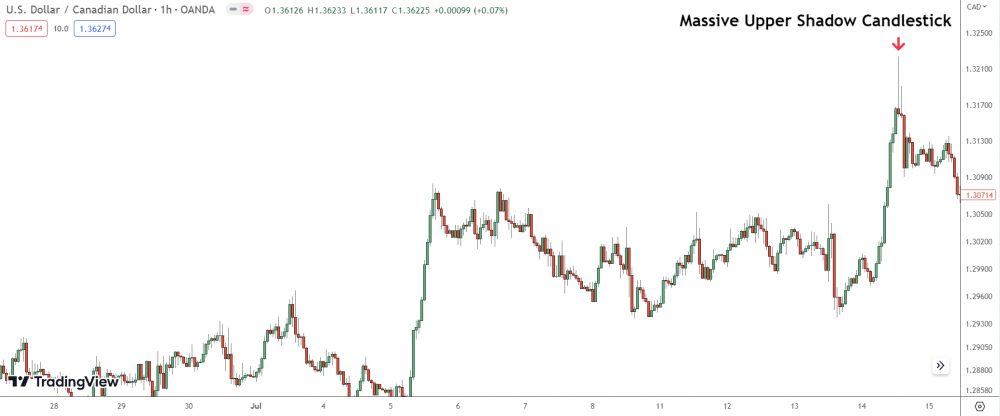
See how the candle above has a massive shadow compared to the long upper shadow candlesticks seen in the previous example?
These are the sorts of candles to look for.
The huge shadow reveals the upside momentum was super strong, meaning the banks had to sell much more to push price down to form the upper shadow. While that could have been profit taking, the fact price had been climbing for almost a week previous, indicated a signifcant reversal was more likley.
And, what do you know..
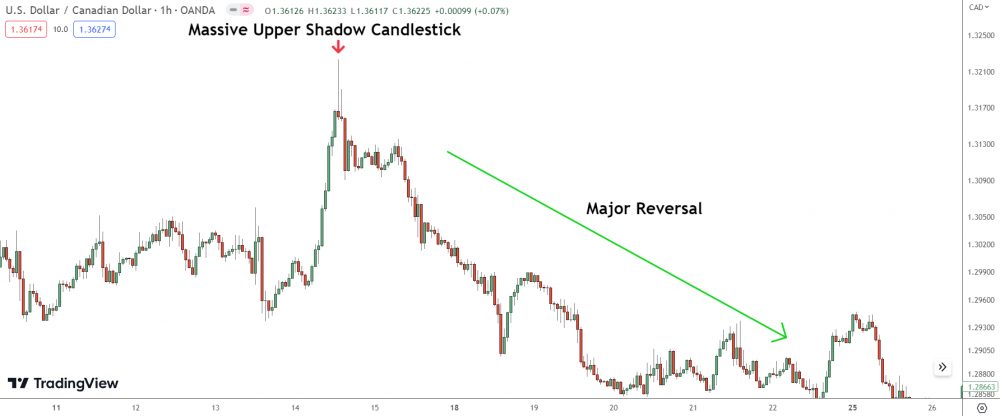
Price dived into a very deep retracement after the candle formed?
See my point now?
3 Common Types Of Long Upper Shadow Candlesticks (And How To Use Them)
Any candlestick with a long upper shadow falls under the long upper shadow candlestcick umbrella, however, there are 3 common types of candle:
- Shooting stars Candlesticks.
- Bearish Doji Candlesticks.
- Profit taking Candlesticks.
Shooting Stars (Aka Bearish Pin Bars)
Ever seen a candlestick with a long upper shadow and tiny body form at the end of a signficant upmove or uptrend?
Congrats, you’ve found a shooting star!
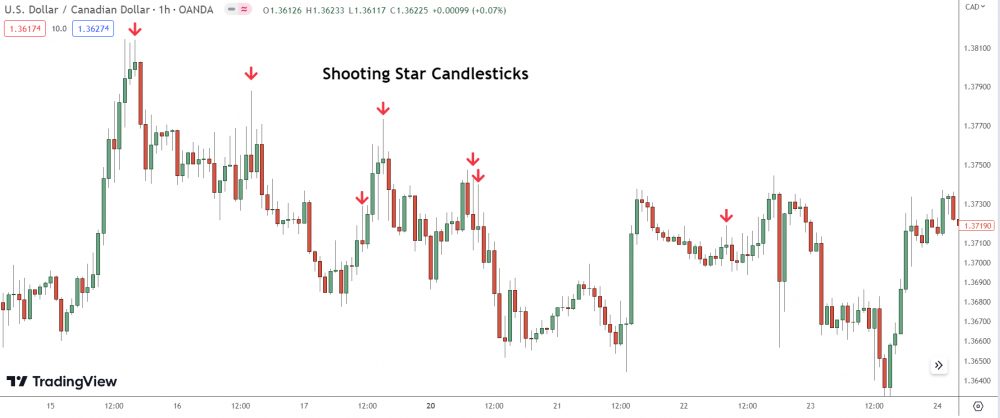
Known in price action circles as a bearish pin bar, shooting star patterns are one of the most common long upper shadow candlesticks in forex. These candles usually appear late into uptrends/upmoves where they signal a reversal to the downside.
Here’s a few more…
Shooting star patterns form when price shoots higher, but then retraces almost back to the candle open, leaving a long upper shadow protuding from the surrounding price action.
The shadow shows heavy selling stopped price moving higher, suggesting a reversal *could* be on the cards.
How To Interprete Shooting Stars
Shooting stars can signal one of the 3 actions mentioned earlier, however, indiviudal candles with massive upper shadows usually indicate a reversal.
For example:
The shooting star above formed with a gigantic upper shadow inside a powerful supply zone – a clear sign a reversal could be building.
The outcome?
Yep, you guessed it…
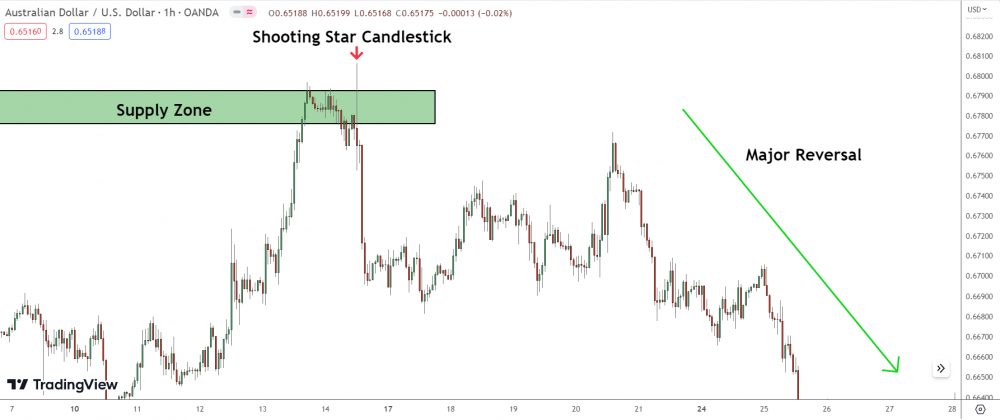
Price tanked right after the shooting star formed.
Pretty neat, right?
Trading shooting star patterns requies little technical skill or knoweldge. Just make sure the pattern forms with a massive upper shadow at a key technical point (check the list I gave earlier).
That’ll increase the chance of the pattern causing a reversal.
Key Point: Always wait for a shooting star to close before entering. A surge of momenum may cause the candle to change before the close, leaving you high and dry in null trade.
Trust me, I speak from experiance!
Here’s a quick step by step breakdown on how to trade shooting stars:
- See if a shooting star forms at a key technical point.
- Enter when the candle closes i.e the next candle opens.
- Place a stop above the nearest swing high – or other key POI.
- Wait for price to reverse and take profits as price falls.
Don’t forget: The key to trading shooting star patterns successfully comes mainly from analyzing other market factors to determine why the pattern has formed. Explaing the process lies outside the scope of this article, but be sure to check my other posts (and course) for more info.
Bearish Doji Candlesticks
Another super common upper long shadow candlestick…
Bearish doji candlesticks.
These candles have an identical construction to the shooting stars we just looked at, however, with one main difference: The candlestick has no body – price retraces back to the open, causing the candle to close at or near the opening price.
The result?
A shooting star patterns with no candle body.
See for yourself…
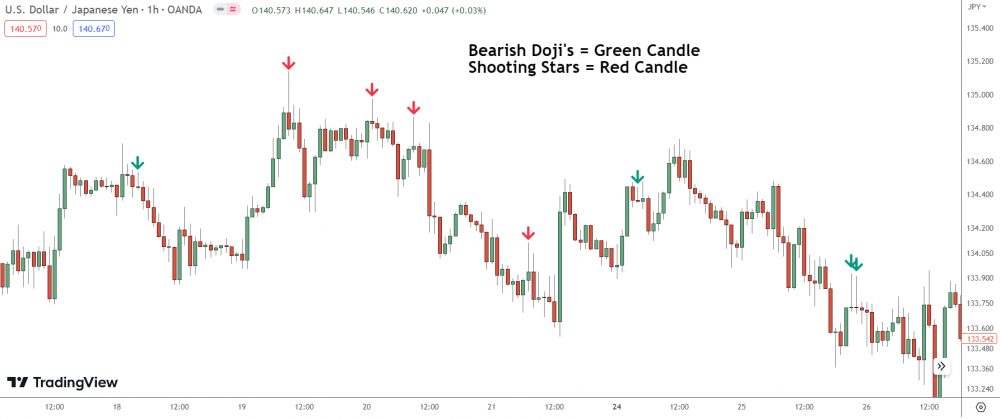
See how similar they are?
Like shooting star patterns, bearish dojis also form due to the banks selling and signal a reversal or retracement upon formation. The creation process is the same, only the banks manage to push price deeper into the candle, which give the doji’s it’s signiture apperance.
(Note: the lack of body doesn’t mean the banks sold more to form the candle).
How To Interprate Doji Candlestkicks
Since bearish doji candlesticks are essentially shooting star patterns – minus a candle body – we interprate them the same way. The candle reveals the banks executed 3 actions listed earlier, with the most common being the banks taking profits to cause a retracement.
Here’s a quick example…
Don’t forget: Bearish doji candlesticks always provide more powerful signals upon forming at key technical levels, such as a major pschology levels like you see above.
Trading the patterns follows the same rules as shooting stars:
- Wait for a doji to form at a key technical level
- Wait for the candle to close via the next candle opening.
- Enter and place a stop above the nearest swing high.
- Taking profits as price reverses and moves in your favour.
Simple, eh?
Onto our final long upper candlestick now…
Profit Taking Candlesticks
Profit taking candlesticks aren’t a technical candlestick per say, but my name for any candle with a long upper shadow that doesn’t fall under the two other types.
For example:
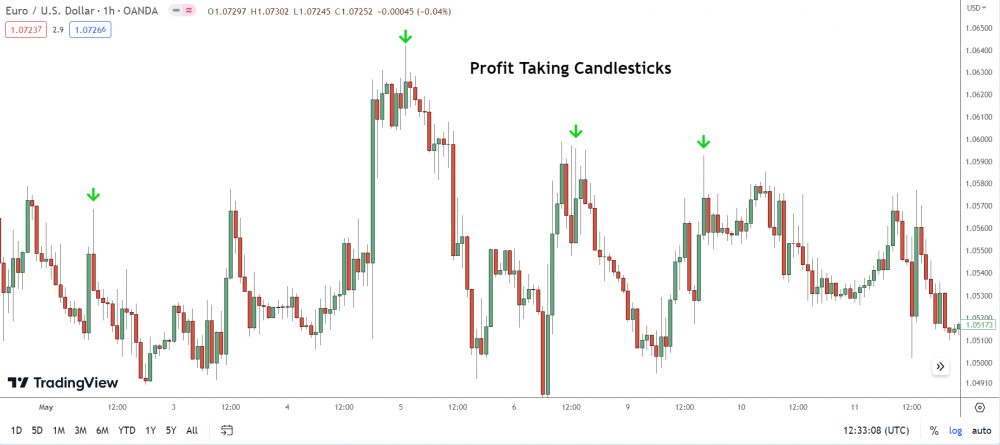
The candles marked above are all long upper shadown candlesticks, however, notice how none can be called bearish doji’s or shooting stars? They all have a long upper shadow, sure, but the candle body appears far larger than the other types.
For these reason, I call these profit taking candlesticks.
Plus, these candles usually form due to profit taking.
While they form under the same process as the other types, the larger candle body indicates buy side momentum remained strong even after the banks sold.
The selling doesn’t overwhelm the buying, like we see with the other types, which suggests the banks created the candle by taking profits off open long trades. They’re content with buy side momentum remaining high as they want and expect price to move higher.
Does that make sense?
Profit taking candles don’t appear often compared to the other types, but are still worth watching for to help with analysis.
The Bottom Line
And there you have it, fellow traders!
We’ve journeyed through the intriguing world of long lower shadow candlesticks, decoded their secret signals, and discovered how they can light the way to profitable trading. These patterns reveal powerful clues about the banks, if you know how to listen.
Keep your eyes peeled, your mind open, and your trading game sharp!
Until next time, traders…
Hi i just bought a 97 dollar vip and i don’t get anything. no email, no product nothing
Check your email, Rai. I’ve left a link for you to create the membership.