
Being a price action site, I’m NOT a fan of technical indicators.
They lag way too far behind price, rarely tell you anything you can’t know from simply looking at a blank price chart, and just generally aren’t that useful to use when trading.
But not all indicators are bad…
Some can actually be really useful, giving you important info for entering or managing trades, which can help you out immensely when it comes to making money.
I’ve found a few of these indicators over the years, and today, I’m going to share them with you.
With these 5 price action indicators, you’ll have a much better idea of when (and where) to move your stop, find it easier to predict where a retracement may begin, and be able stay in trades for 2x – 3x times as long as before, plus more…
They’ll give you a big leg up in your trading, and make your life A LOT easier.
Let’s jump in with indicator #1…
Support And Resistance By Patternsmart Indicator
Finding the right swing highs and lows, whether to identify the trendline, move a stop loss, or to set a profit target isn’t easy – for new traders especially.
Lows and highs form everywhere, so how do you know which are the right ones?
Time and experience obviously helps. But what if you don’t have that? What if you’re a new trader who needs to find the right highs and lows to know wher the trend going?
Well, one way is to use the Swing High/Low Patternsmart indicator…
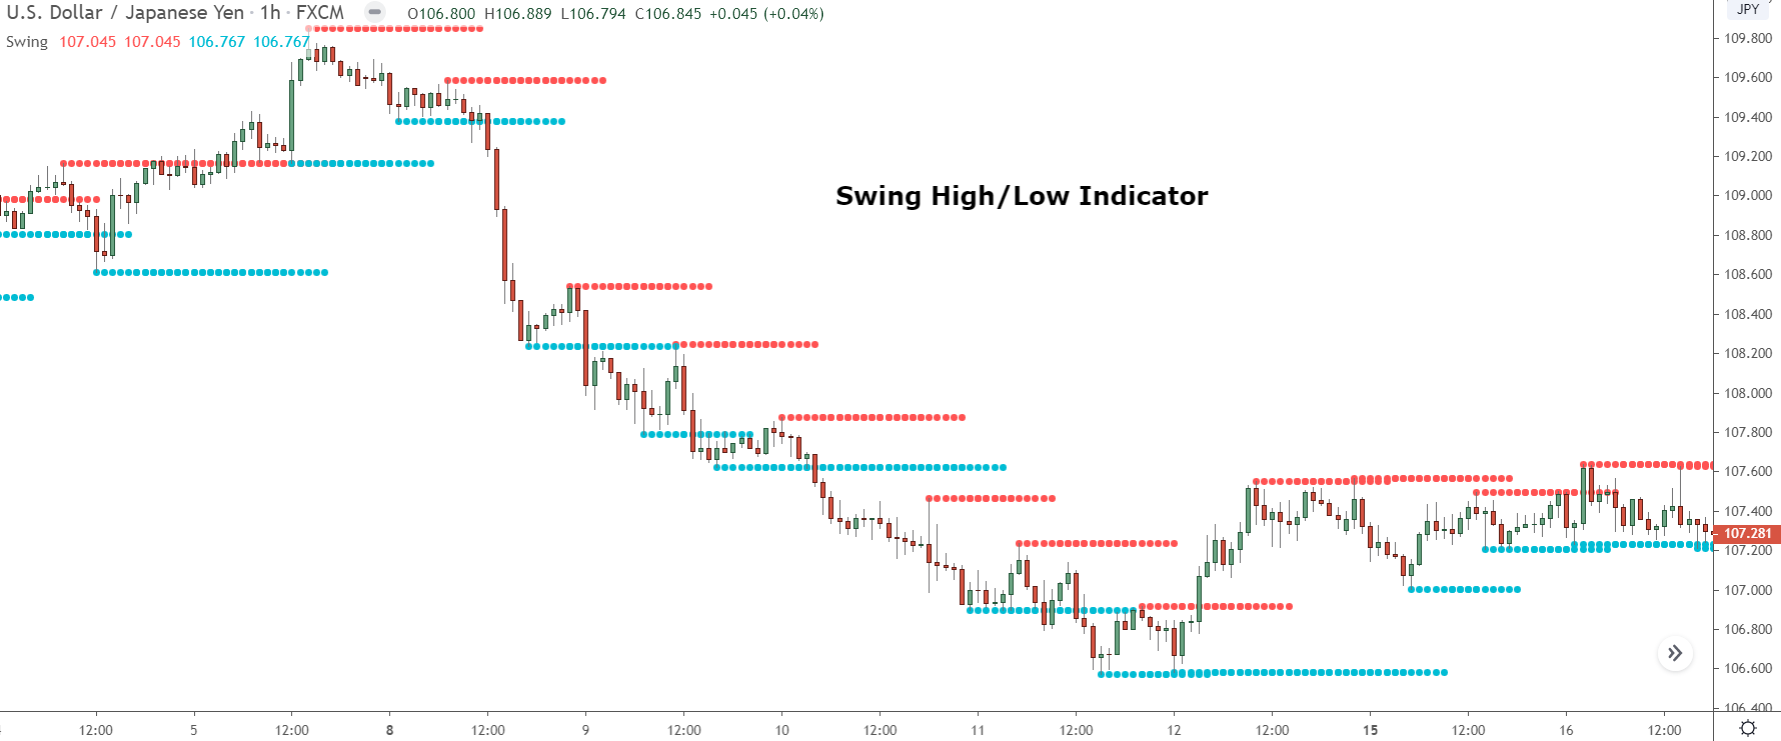
The hardest part of identifying swing highs and lows is just that: identifying them.
But the swing high/low patternsmart indicator makes this easy by marking the swings AUTOMATICALLY. It calculates which highs and lows are swings by looking at how many candles have formed since the low/high, and then marks them on the chart via dotted lines.
So no more scratching your head trying to figure out which highs and lows are swings… just add the indicator and every swing high and low appears for you on the chart.
Pretty cool, right?
Now don’t get me wrong… the indicator isn’t perfect.
It doesn’t show EVERY swing high or low that’s formed. Sometimes it misses a few because of how the indicator calculates which highs and lows are swings. This is only a minor issue mind you. Most of the time, the indicator shows the right lows and highs, so you shouldn’t have much of a problem.
How To Use This Tool
The Patternsmart indicator marks the swings automatically. What it doesn’t do, however, is mark the right swings highs and lows for every timeframe. You instead need to open the options menu and change a few settings for the correct highs and lows to appear on whatever timeframe you’re using.
To do this, add the indicator to the chart by searching for patternsmart in the indicators tab on Tradingview. Then, open up the settings menu by right-clicking one of the lines.
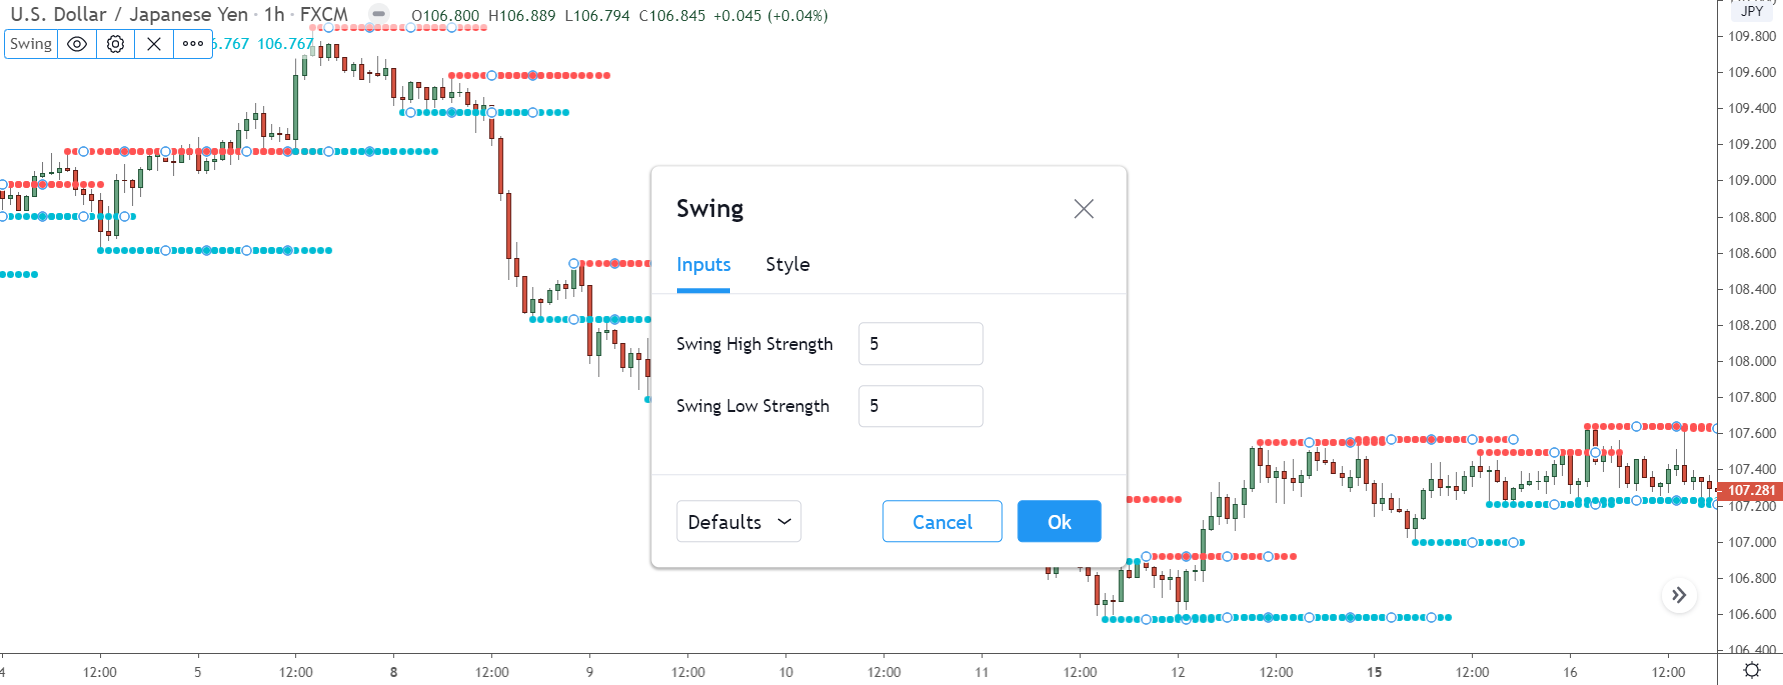
Inside the inputs tab, you should see the two options: “Swing High Strength” and “Swing Low Strength”.
These change how the indicator determines which highs and lows are swings.
For high timeframes, you typically want a lower setting – as the high/lows are much more spread out. And for lower timeframes, you want to use a higher setting, between 1 and 5, I’d say. We’re watching for smaller swings, so a lower setting is needed.
If you’re not sure which setting to use, here’s a helpful list:
1 – 5 Min – 7
15 Min – 7
1 hour/4 hour – 5
Daily – 4
Williams VIX Fix Bollinger Band Indicator
Being a price action site, the last thing you probably expect to see on this list is a nasty lagging indicator. But that’s exactly what this next indicator is, and you know what…
It’s actually useful.
While the Williams VIX Fix sounds like something you’d find 5 pages deep into a long-forgotten thread of forexfactory, in reality, it’s a simple little indicator that hints at market tops and bottoms.
Now, don’t be fooled… this isn’t volume we’re seeing here, even though it looks that way.
The Williams VIX indicator instead shows the volatility in the market.
Basically, rather calculate the volatility over a set period – ala bollinger bands – it takes the current volatility from the lowest low and highest high and extrapolates that out 30 days – or whatever period you select.
The result is then shown via bars, which through their size and color, give you a sense of the volatility in the market.
But wait… why would we want to see the volatility anyway?
Well, volatility is a measure of how greedy or fearful traders are.
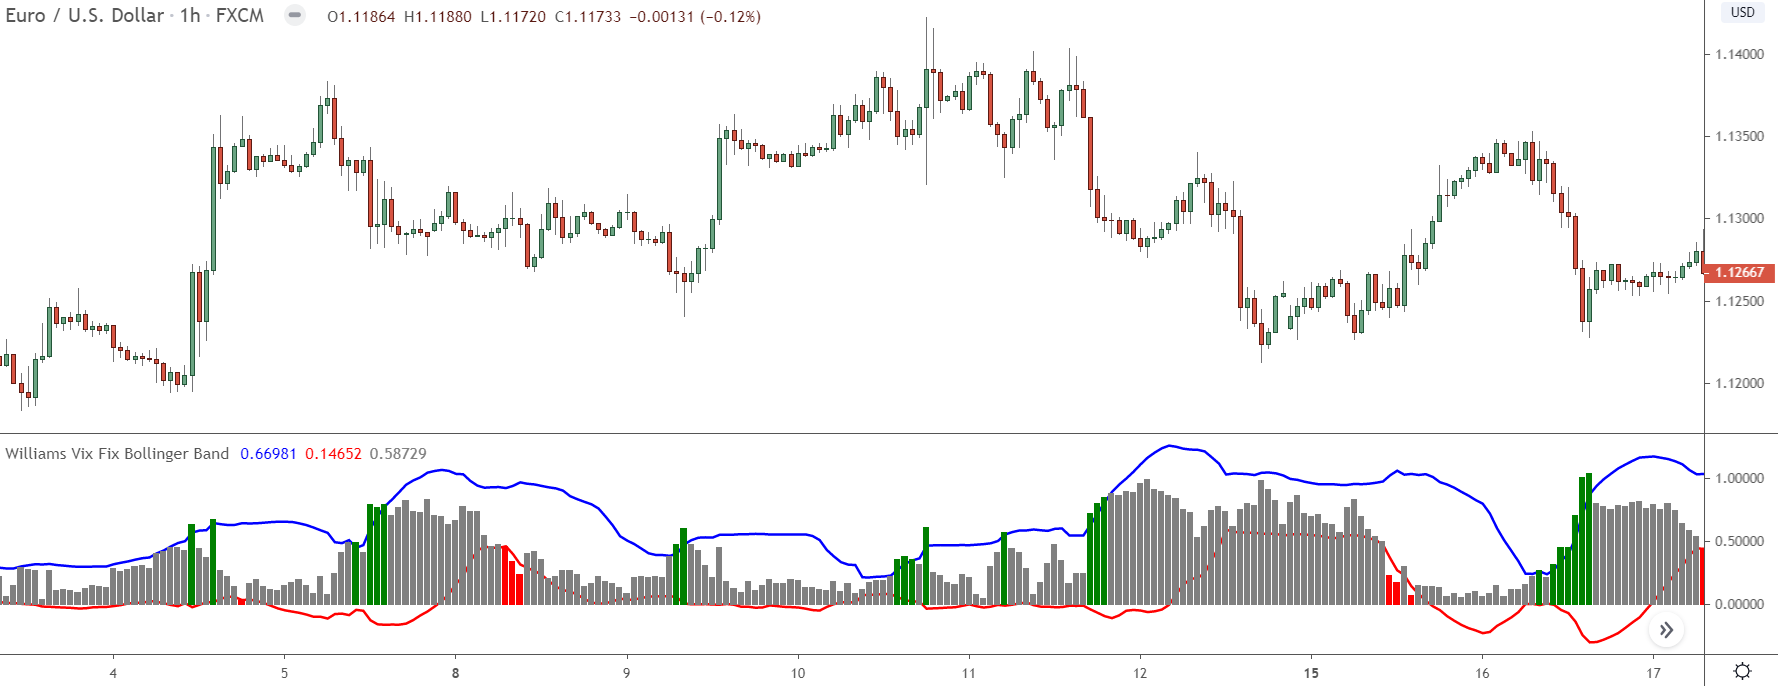
It’s at its highest just before big turning points, as that’s when traders are the most fearful or most greedy about the future. That’s why if you look at the graph, you’ll see most of the big bars (which show high volatility i.e fear/greed) appear just before price reverses.
With fear and greed at a maximum, the banks have a big incentive to take the market the other way, either to make money – in the case of a reversal – or take profits or close trades, for retracements and consolidations.
What the VIX allows us to do, then, is get a sense of when price may be reversing by quantifying the level of fear and greed in the market.
The question now is, how do we use that in our trading?
Let’s take a look…
How To Use This Tool
I’m quite new to Williams VIX Fix indicator, so I don’t know all of it’s uses just yet.
That said, from the small-time I’ve had at with it so far, it seems like the indicator is great for confirming when and where a retracement or reversal is beginning.
See for yourself…
Right before most of the above retracements and reversals began, the volatility was high – big bars started appearing, indicating traders were getting very fearful or greedy about the future. Since that gave the banks an incentive to enter the market, it made a reversal highly likely, which is what we then see.
So that’s a wrap then, we just wait for the bars to turn green and then enter the reversal, right?
Well, not exactly…
See, while the Williams VIX indicator does do a good job of telling us when a reversal could be underway, it’s not reliable enough to be used on its own; we have to combine with other techniques, i.e look for confluence.
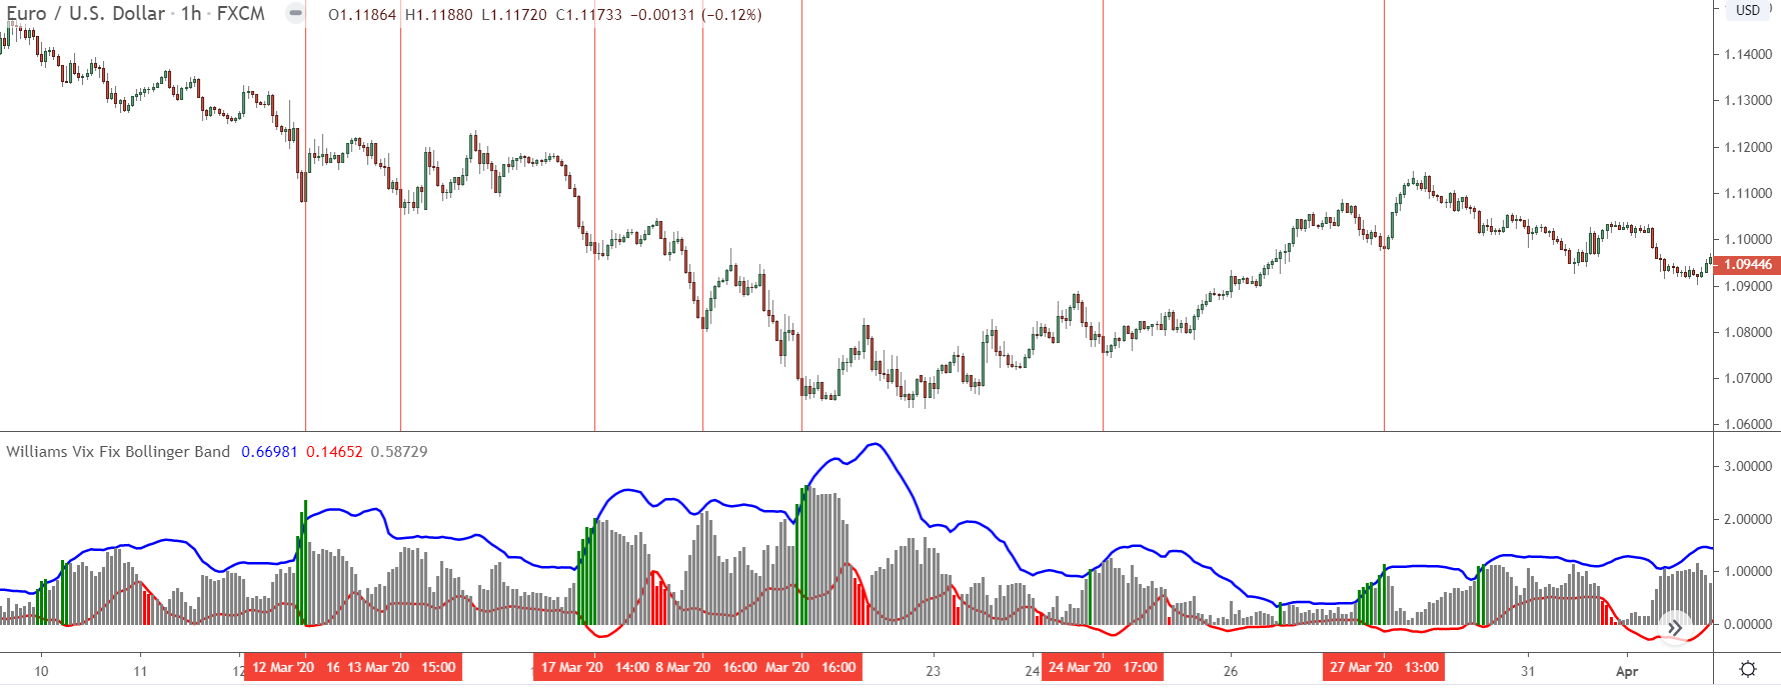
In this case, I suggest watching for a rise in volatility (big bars) when price enters a supply or demand zone.
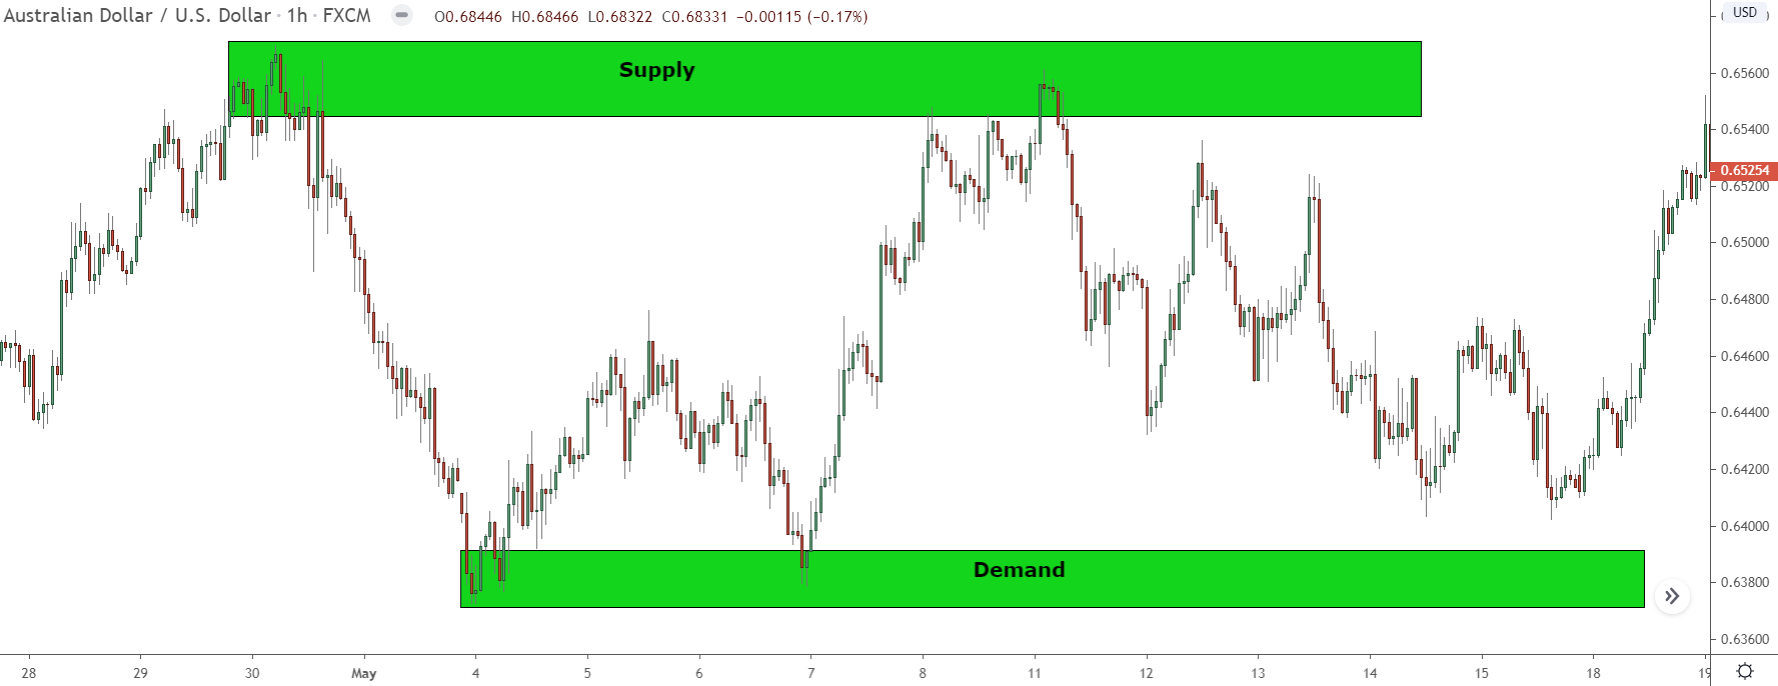
Supply and demand zones form from the banks either placing trades, taking profits, or closing trades. But as I explained, the banks usually do one of the above when the volatility is high. That’s when traders are most fearful or greedy about the future, therefore, the banks have lots of orders to use to buy and sell with.
By putting two and two together then, we know when and where price could reverse.
The VIX tells us whether the banks are interested in making price reverse (hence the high volatility – big bars). And supply and demand zones give us the point where it could reverse.
Here’s an example…
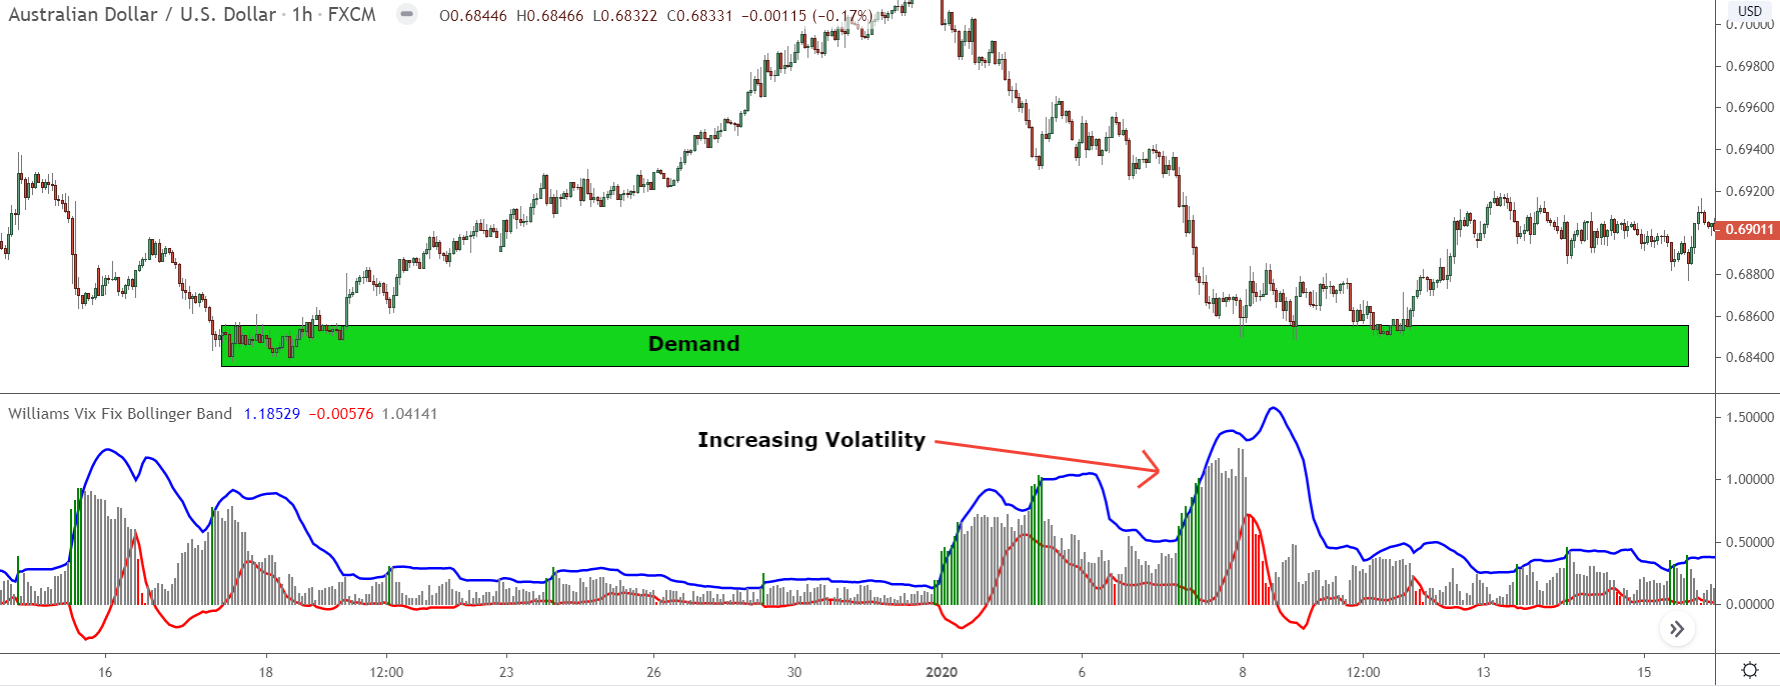
Before price entered the zone above, the volatility was rising, hence the big bars.
That tells us traders are getting greedy about the future – the sharp decline probably made them think price would keep falling. With all these retail traders getting short, the banks have a huge number of sell orders to use for their own devices. In this case, taking profits off their sell trades, which requires lots of traders selling.
What happens when they take profits?
Price reverses and begins rising, making most short traders lose, and giving the banks a retracement they can now use to get more sell trades placed – pretty smart, huh?
So, that’s the Williams VIX Fix indicator for you.
It’s best used with supply and demand zones, but you can use it with other key points of confluence – support and resistance levels, big round numbers, Fibonacci retracements – work just as well too.
Give it a try yourself, see what works best for you.
Heiken Ashi Candlesticks
As any professional trader will tell you, taking profits at the right time can be the difference between a good trade and a bad one.
And in my time trading, I’ve never found a way to take them consistently at the right time…
I’ve tried taking profits at support and resistance levels, at big round numbers, when indicators show different signals… nothing worked. I could never find a method that got me out at the right time. However, a couple of years ago, I stumbled across something that actually worked quite well…
The Heiken Ashi chart.
If you’re not familiar with the heiken ashi, you’re probably wondering what’s so special about it – especially since it looks (almost) identical to a normal candlestick chart.
The answer lies in what it shows.
The heiken ashi chart shows the price, just like a normal candlestick does.
However, rather than show the REAL price, it shows the AVERAGE price. It calculates the average, and then each candle appears bullish or bearish according to whether the average price rose or fell for that period of time.
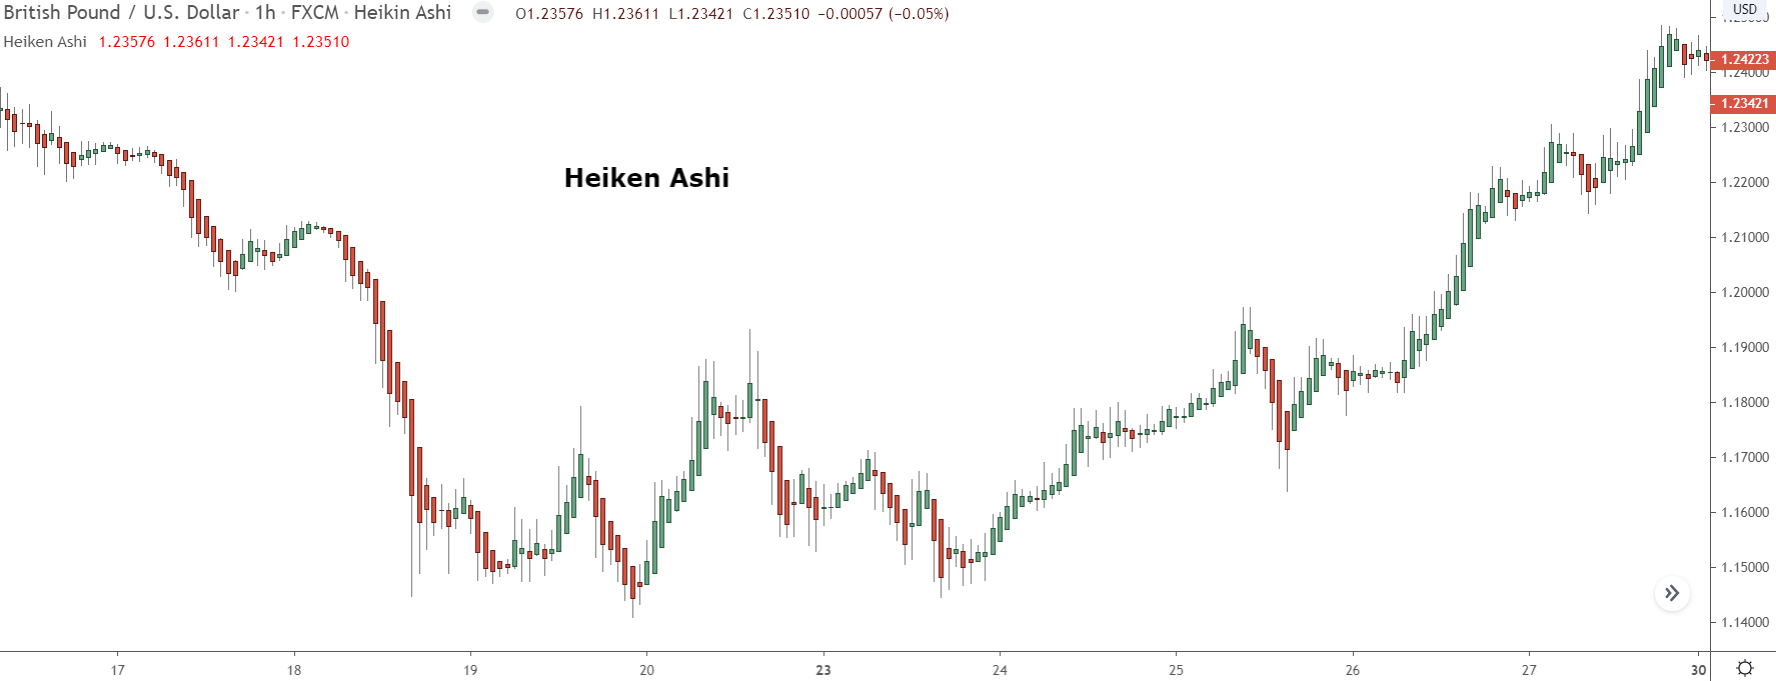
If you look at two charts side by side, you’ll see the Heiken Ashi has a much smoother look to it.
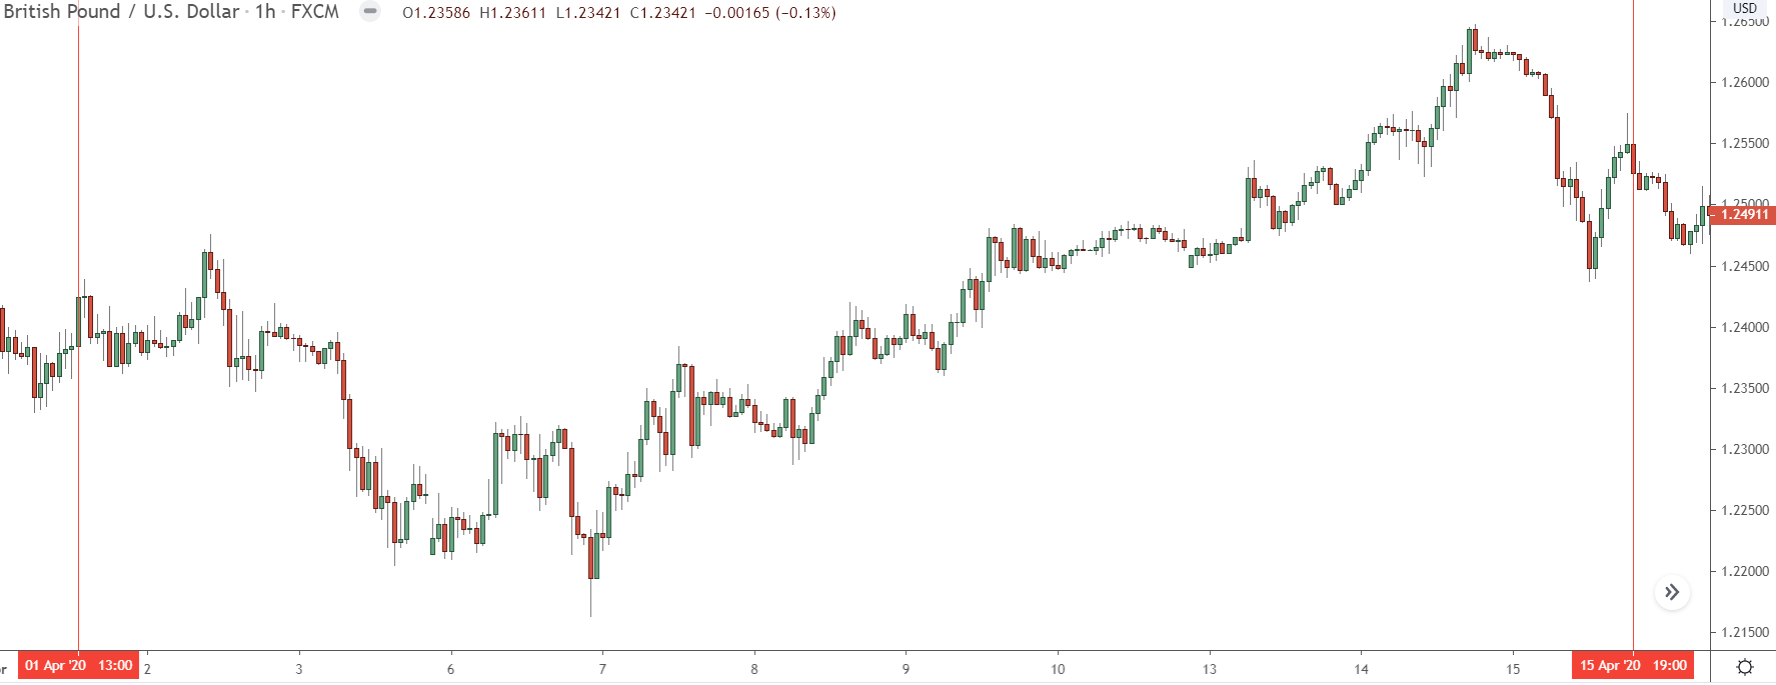
Here’s a normal candlestick chart.
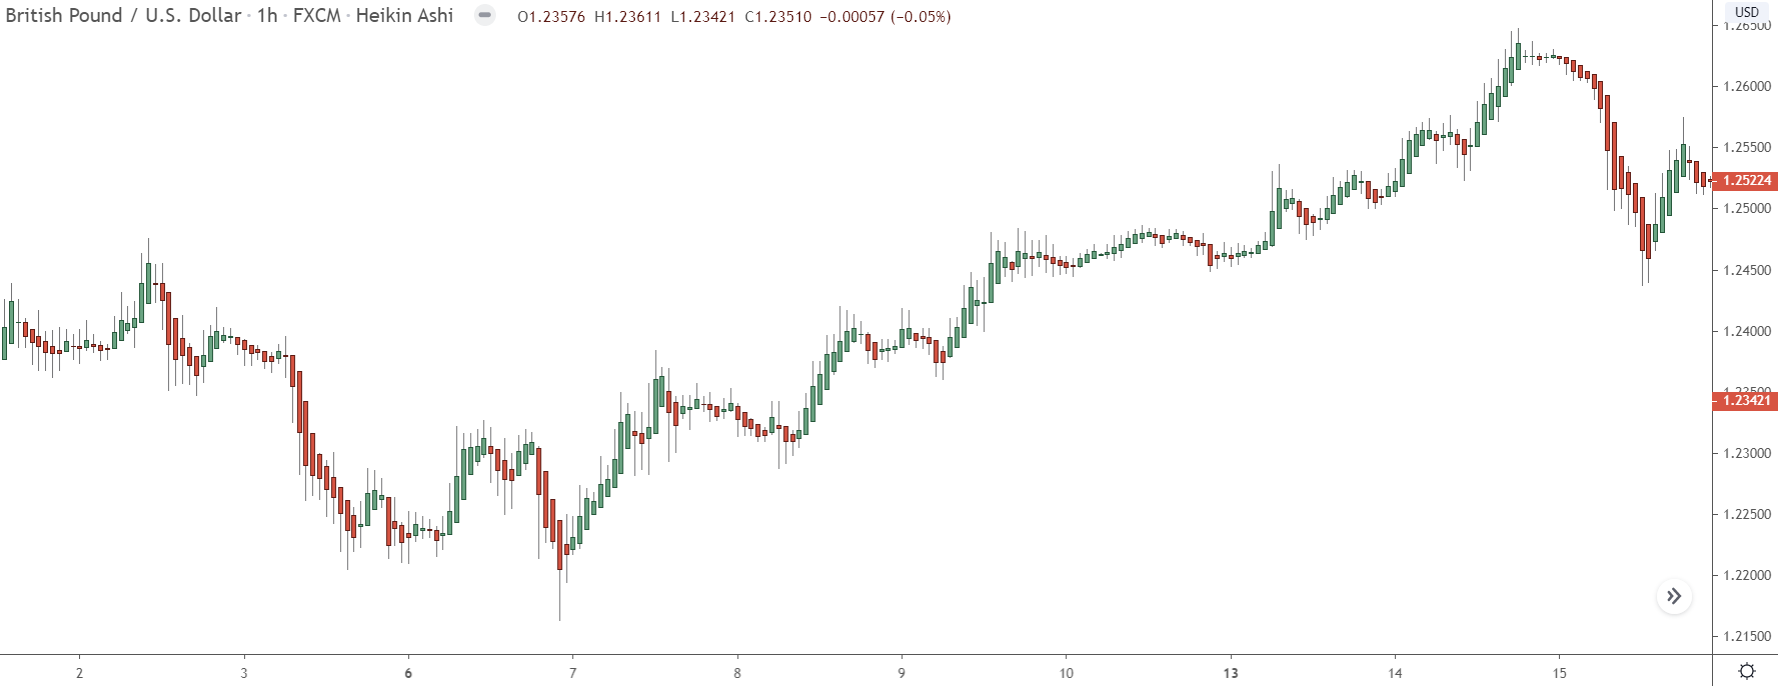
And here’s the same piece of price action, but seen on the Heiken Ashi.
Notice how many of the candles on the candlestick are the opposite colour on the heiken ashi… showing price continued rising/falling for much longer?
That’s because, on average, price didn’t rise or fall on those candles. The real price did, which is why the candles changed colour on the candlestick chart, but the average price didn’t, leading the heiken ashi candles to stay the same rather than change. Giving you a better idea of what the current trend is.
That’s how the heiken works then, but how do we use it to take profits?
Well, let’s take a look…
How To Take Profits With Heiken Ashi
You might well wonder how we take profits using the Heiken Ashi, given that it doesn’t show a traditional signal like a technical indicator would. But that’s the funny part about it…
The chart doesn’t give us a signal, it is the signal.
The chart tells us to take profits whenever the candles change colour.
Remember, the Heiken Ashi shows the average price of a currency; it’s not the real price, it’s averaged out. That means the candles stay the same colour for much longer than usual, which gives us a better idea of the current trend. If the candles change colour, we know a new trend or big move could be about to begin.
So, to take profits with the Heiken Ashi, you simply wait for the candles to change colour…
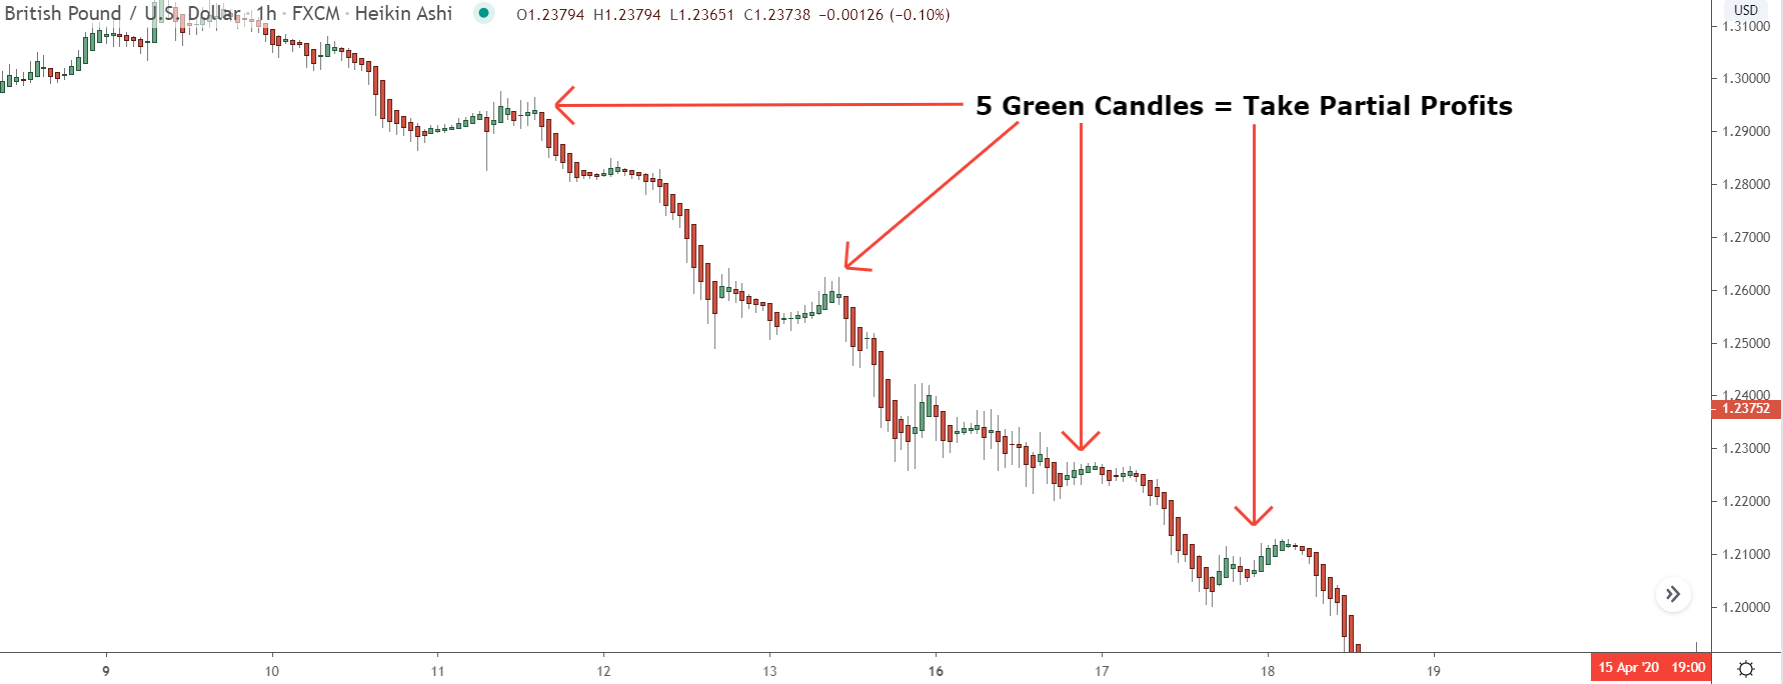
When they change, you take some profits because it shows the average price has changed;, price has a high probability of moving in the opposite direction for a while.
If the candles turn green, you take profits off your long trade.
If the candles turn red, you take them off your short trade.
It’s easy enough, but the key point to remember is only take profits once you see a minimum of THREE opposing candles form consecutively, e.g three bull candles during a decline.
On its own, one candle isn’t enough to signal a change; you must wait for confirmation from more forming afterwards.
Another thing is, don’t take all your profits off as soon as the candles change.
Just move your stops closer to price – the volatility stop (see below) would be ideal for this. While three candles forming indicates a counter-movement, it’s not necessarily a reversal; it might just be a retracement or consolidation.
So by only taking a partial amount off, you can stay in the trade and continue to profit if price the trend stays the same.
Volume Profile
You need the Pro or Pro+ version of Tradingview to access this next tool, but for those who know how to use it – all you volume junkies out there – it’s well worth the price.
Volume Profile shows the volume, but not in the way you’d think…
Rather than show the volume via bars in a graph at the bottom, it shows them horizontally on the right-hand side of the chart.
Why this strange change, you ask?
It all comes down to what the bars show…
Unlike the normal volume graph, these bars don’t show candle volume, but PRICE volume.
The bars reveal how much volume came in at each price, not on specific candlesticks. You’re seeing the aggregate amount of volume that occurred around that price from all the candles currently on screen. That’s why the bars display horizontally, rather than vertically, each represents a different price range.
Also, can you see how the bars are both green and red?
On top of showing price volume, the tool also shows whether the volume came from the buy-side (green) or sell-side (red), allowing to see what traders were up to around that price.
So essentially, Volume Profile is like the jacked-up bodybuilder version of the normal volume tool.
By seeing the volume at each price rather than candles, it’s much easier to get a sense of where the important levels are in the market – something that’s difficult to do with the normal volume tool. Combine that with the buy and sell volume, and you can pinpoint exactly what traders were up to during that time.
How To Use Volume Profile
You’ll find volume profile inside in the indicators tab, right at the bottom below “My Scripts”. As I said, it’s a paid tool, so you’ll need a Pro account with Tradingview to access it – or get the 30 free trial to test it yourself.
You don’t have to be expert with volume to use the volume profile tool either – I’m no pro, believe me.
All you need is a basic understanding of what the bars show and what that means for the price level.
For example, big bars indicate high volume – obviously. That shows there was A LOT of activity around that price, meaning it must have some importance in the market. The opposite is true for small bars. They show a lack of activity at a price, so that price can’t be too important to traders.
There are a few ways you can use the volume profile tool in your trading…
One of the easiest, however, is to help identify support and resistance points.
As we all know, support and resistance levels (mostly) form the banks buying and selling. They perform some kind of action (placing trades, taking profits, closing trades), and that causes a reversal, resulting in a level forming.
On the graph, that shows up as period of extremely high volume – it can show as low volume too, but that’s for another day.
So, seeing high volume typically indicates a strong level of support or resistance.
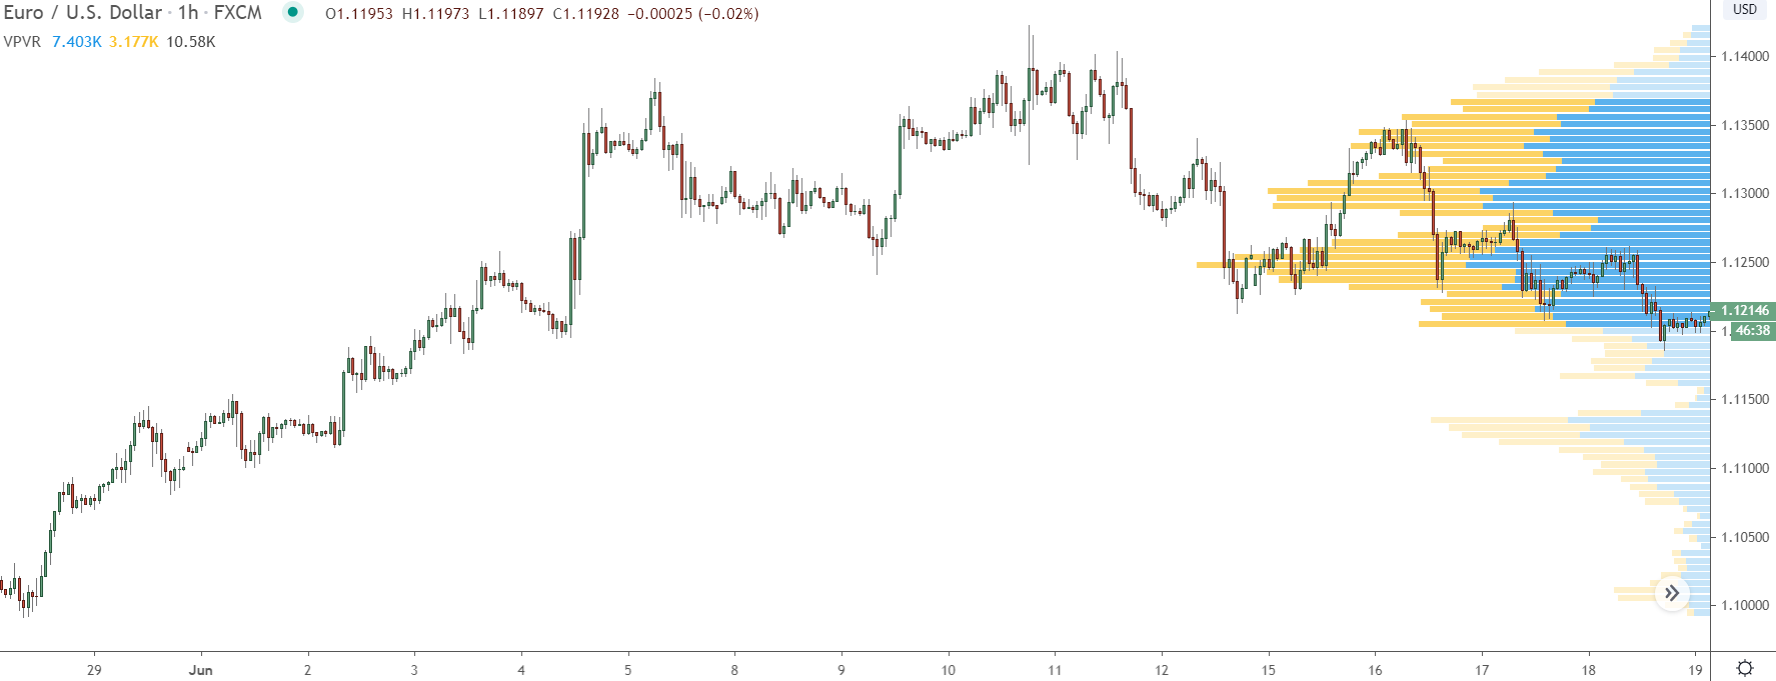
Take the piece of price action below, for example…
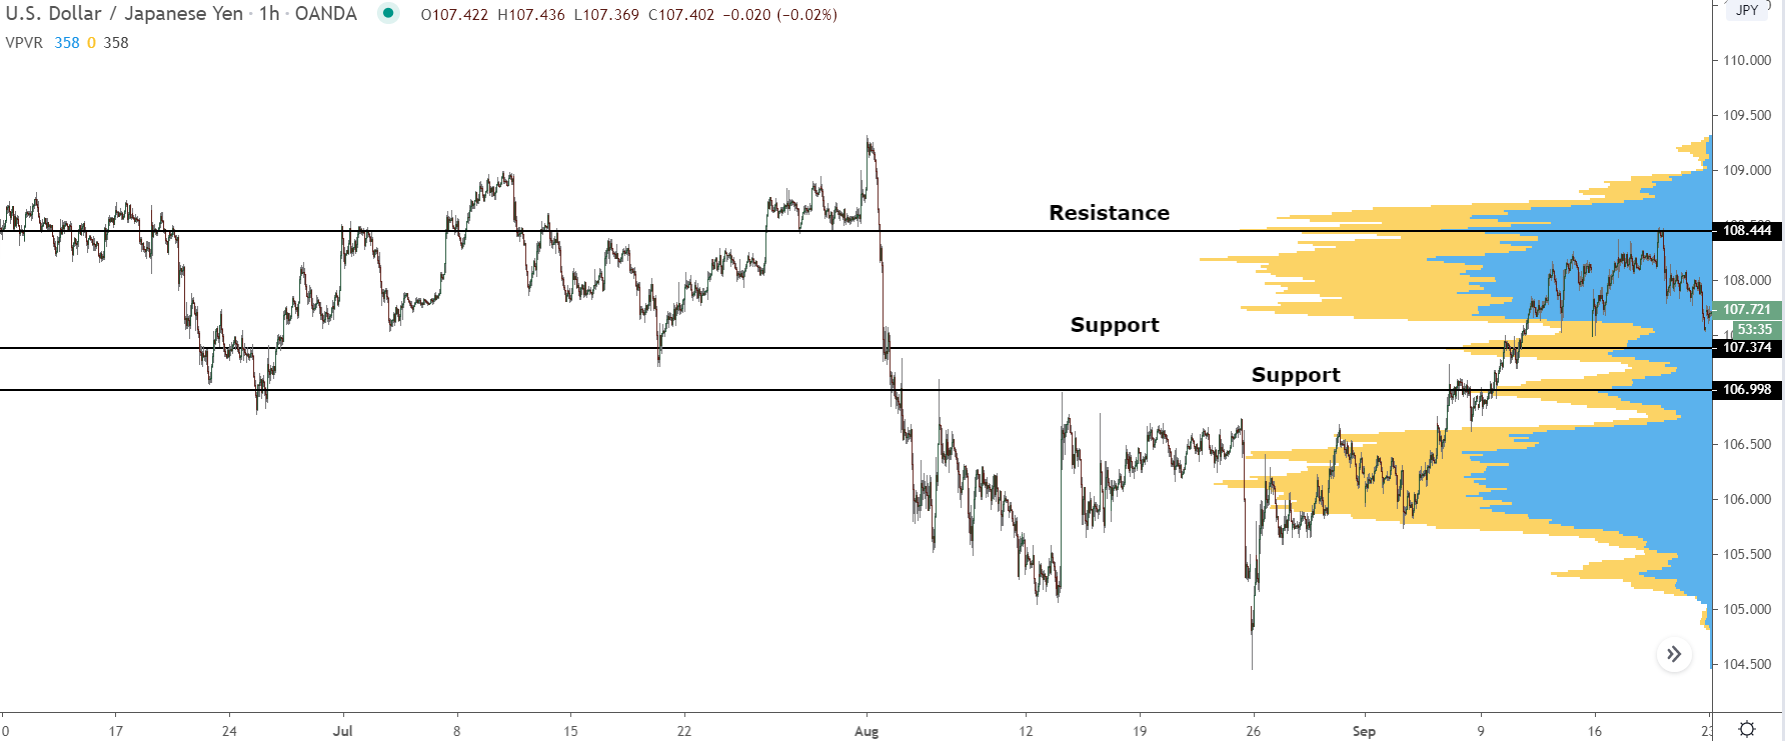
See how we have three high volume clusters here that I’ve marked with support and resistance?
These clusters show that a significant amount of volume came into the market in and around those prices. But who could be behind such high volume? Only the banks, of course. They decided to come in and take some sort of action, like place trades or take profits, at those prices
That resulted in a period of high volume and caused a support and resistance level to form.
Now watch what happens when price returns…
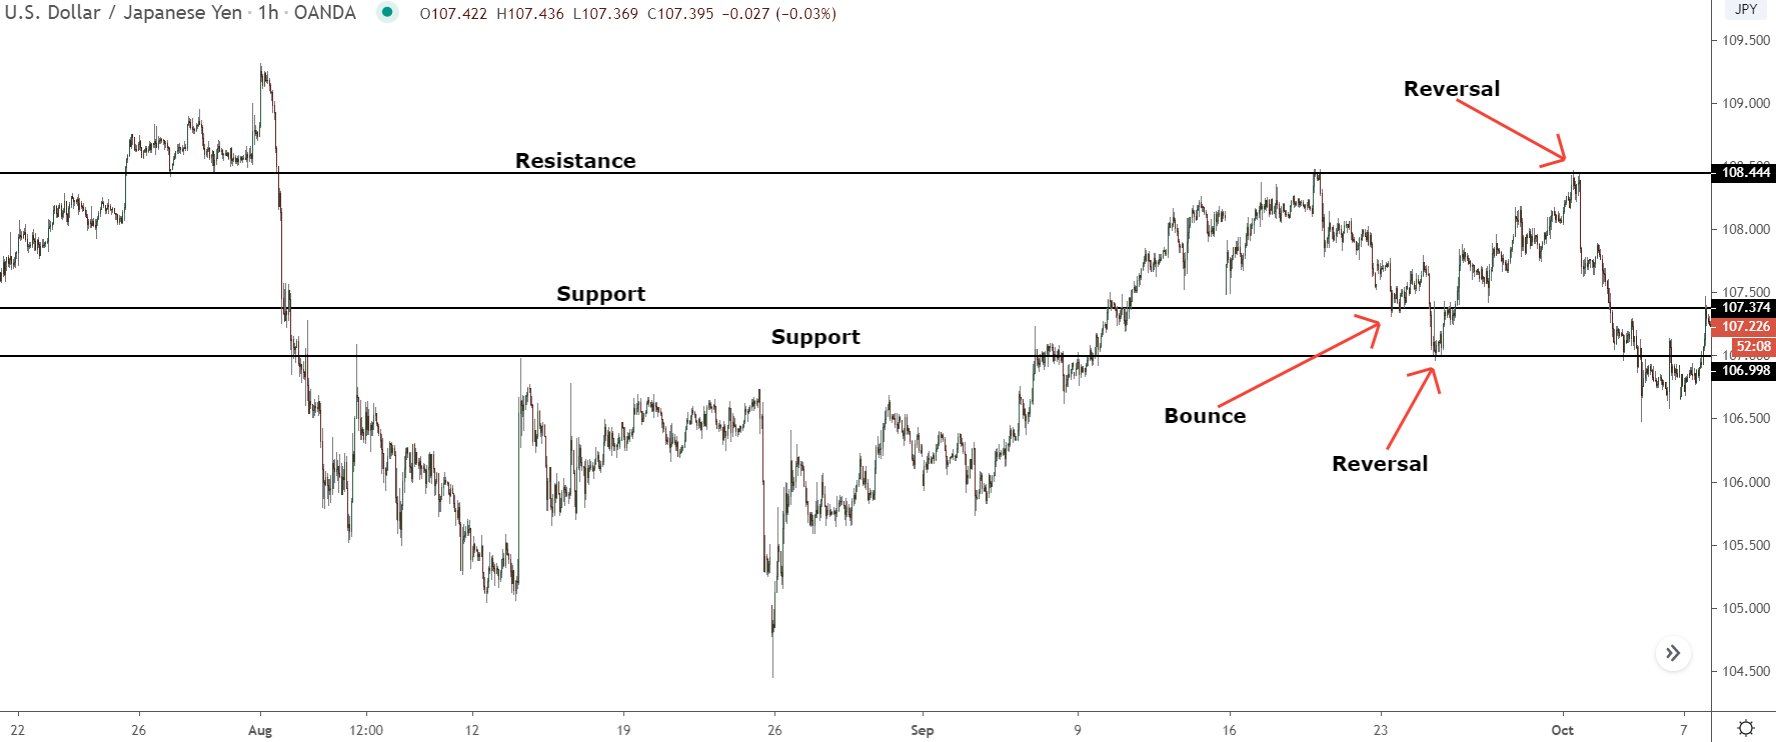
Each level causes either a bounce or reversal, confirming the bank’s interest resulted in the high volume.
Not bad, huh?
Keep in mind, this is using the Visible Range Volume Profile tool – you’ll see it in the indicators tab.
It shows the volume according to all the candles currently on screen at that price – so if you zoom in/out, the bars will change to include the volume on the new candles displayed. Keep the tool at zoom level 3 with the row size set to 80 for best results. Just head into the settings menu, change the row size, then zoom out 3 times from default.
This will give you a good look at the volume without including too much dead volume – volume on old candles that aren’t significant anymore.
Volatility Stop
I don’t know what’s worse, having a winner closed early due to moving the stop to close, or having a large win made smaller because due to not moving the stop close enough?
Knowing the right time and place to move our stops is something even the best traders struggle with.
Even as we’ve advanced so far, the age-old adage of “move your stop each time a new low or high forms” that still gets beat into us rings true, despite it now being a way for the banks to make money from us – stop runs anyone?
What we need is a new way to know when and where to place our stop, a way that limits our risk ontop of being easy to implement.
And I think I have it…
It’s called a Volatility Stop.
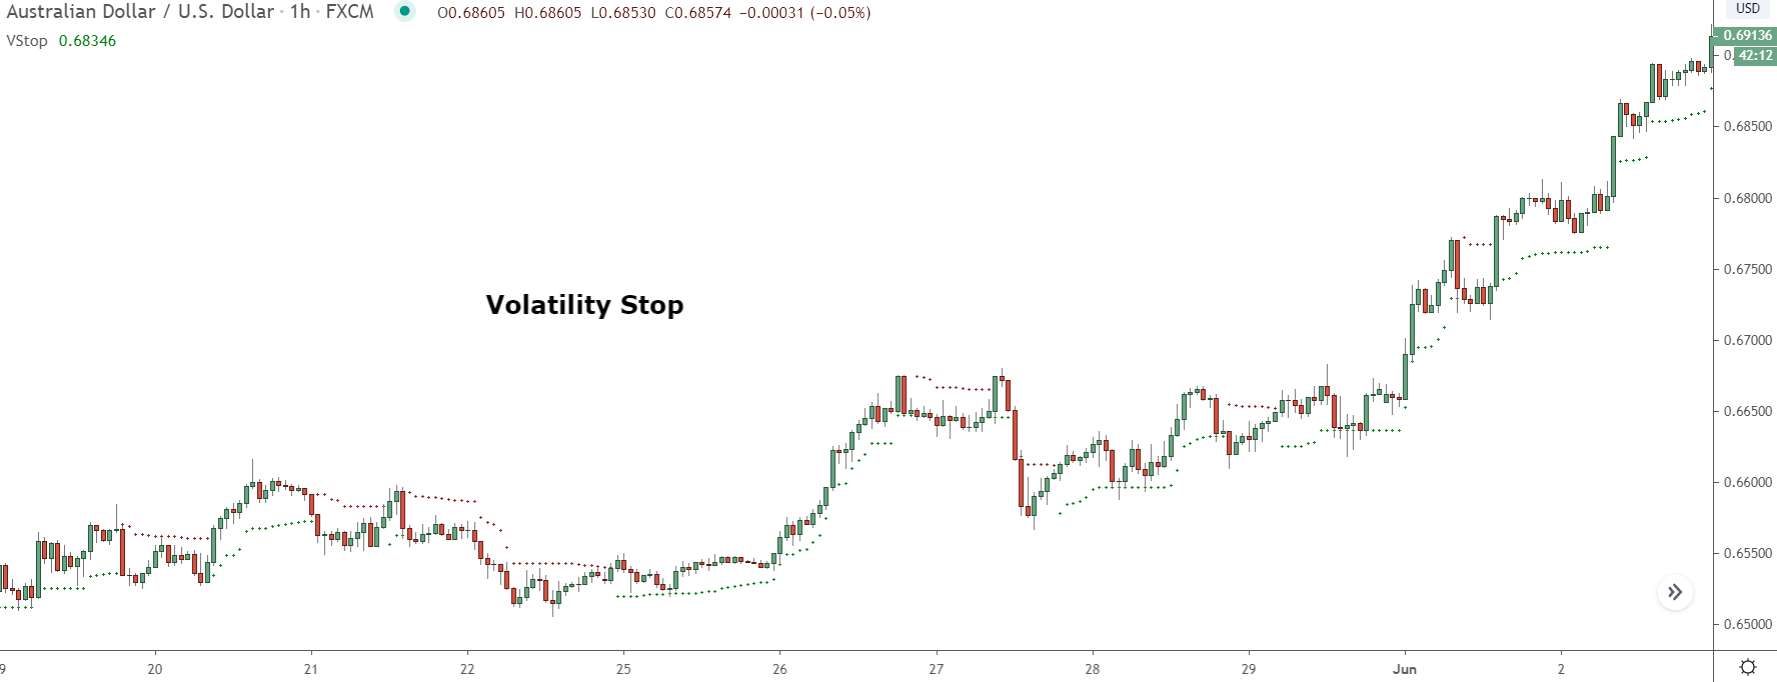
This simple little indicator is normally used to show when the trend might be changing, but it’s also great way to know when and where to move your stop loss.
The volatility stop is based on two indicators: the ATR and EMA.
Using some fancy math, it combines the ATR – which shows the volatility – with the EMA – a trend indicator. The result is a volatility adjusted picture of the current trend, as shown by the dots. Seeing price break these is usually a signal the trend could be changing, but that’s not how we’re going to use it today.
So, what makes the volatility stop such a good tool for moving our stops?
The answer is because it takes into account the current volatility in the market… it gives you a more accurate view of the current trend, allowing you to keep your stop much closer to price when in a trade.
Tell me, how many times after entering a trade, has price shot off without forming a new swing low/high for you to move your stop to?
All the time, right!
And often, price reverses soon after, wiping out much of your profit.
With the volatility stop, this rarely happens because your stop moves as the volatility and trend changes. Rather than it being stuck at a low or high until another forms, it moves with price, securing you consistency more profit and keeping you a safe distance away from the small fluctuations.
How To Use The Volatility Stop
The volatility stop has been around for a while now. It’s a common indicator, so you should be able to find it on MT4 and most other popular charting sites.
On Tradingview, the tool is found inside the indicators menu.
However, it’s under the “Built In’s” tab, not the custom indicators tab like most other indicators we’ve looked at today – just enter “Volatility” into the search bar, and you’ll see it pop up in the menu.
Once the indicator is on the chart, you need to change its settings.
By default, the tool doesn’t display the right length; the dots appear too close to price. You need to make it longer, so they appear further away and don’t spike your stops.
So, open up the settings menu by right-clicking and selecting “Settings” from the drop-down list.
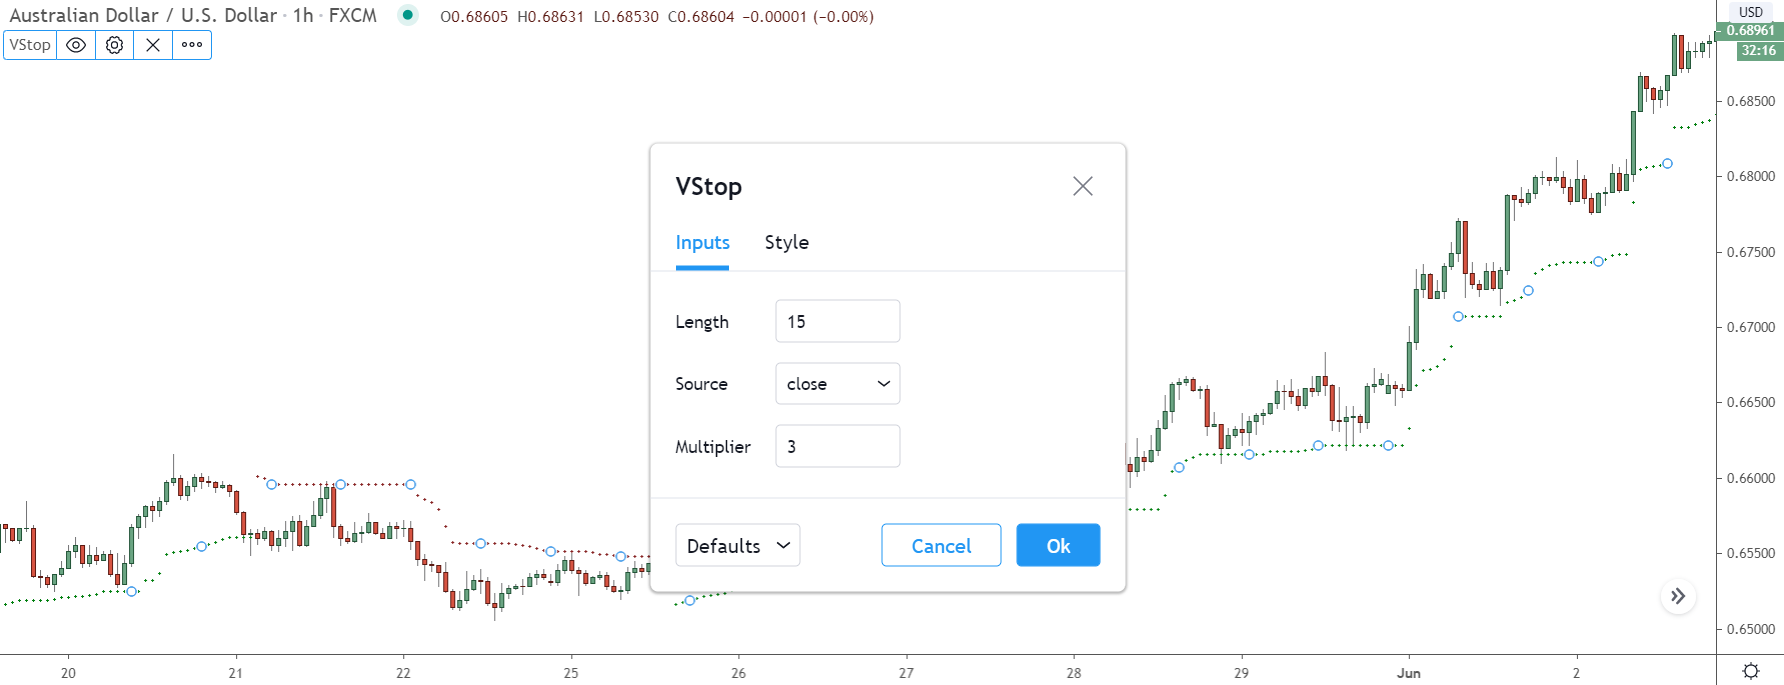
Inside the menu, head over to the inputs box and change the multiplier to 3 and the Length to the following based on which timeframe you use:
5 Min – 20 (Multiplier 6)
15 Min – 20 (Multiplier 6)
30 Min – 20 (Multiplier 5)
1 Hour – 20
4 Hour – 5
Daily – 2
Now hit the okay button…
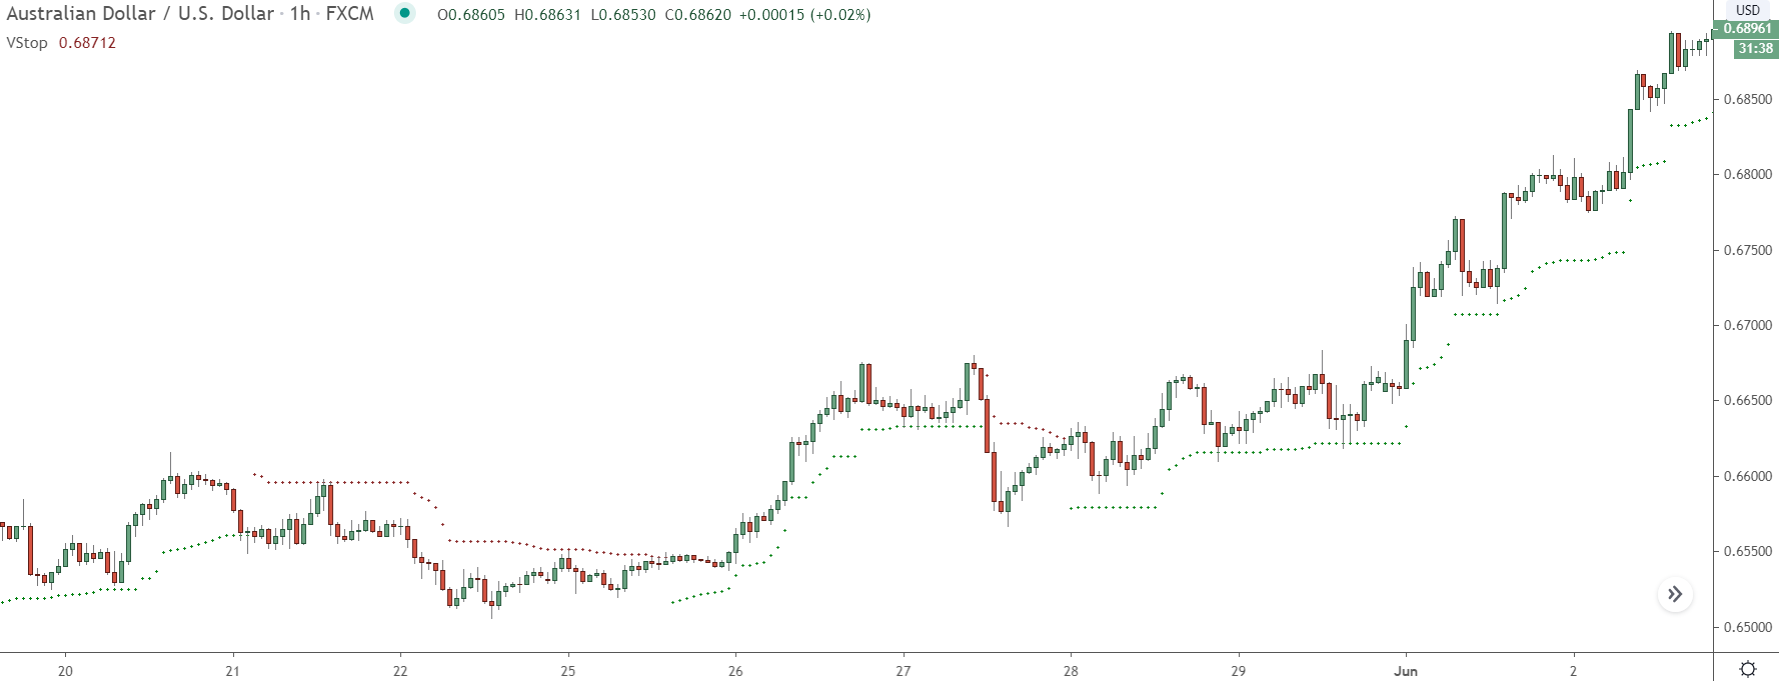
All the dots should see the dots on the chart move further away.
Now, whenever you see a new dot form, you simply move your stop loss up or down… you’ll be able to cut your risk drastically while, at the same time, secure much more profit.
Cool, right?
One key thing to remember, though: Don’t move your stop to the exact price of the dot.
Keep it just below (or above if you’re short) until the next one forms and then do the same again; move it just above/below the new dot. Doing this will help you avoid being spiked out, which can happen from time to time – usually during big news releases, but sometimes during retracements and consolidations.
The Bottom Line
Technical indicators will never be my cup of tea.
However, the 5 listed here are worth taking a look at and have served me well in my time using them. Try them out yourself for a while and see what you think.
I’ll have posts on some of the more complex tools, like volume profile and the Vix indicator, out in the near future; stay tuned.
The Next Step? Learn The 5 Rules For Trading Supply Demand Like A PRO Trader...
Take your trading to the next level. Sign up today to download my FREE E-Book and learn how the pro's trade supply and demand - Includes Order Block PDF and S & D Guide PDF
hi for swing 5 5 or swing high and low in chart there are some dot circle and some of them is long and short what that dott circle means?
To be honest – I’m not sure, Mo. I think it’s just how the indicator works. I don’t think there’s any tangible reason why some lows/highs are smaller/longer; it’s just the way the indicator paints them on the chart. I wouldn’t look too much into it; I’ve never had any issues with it.