
If you trade supply and demand, no doubt, you’ve heard of Sam Seiden.
One of the top S & D guru’s, Sam Seiden created the supply and demand strategy in 2010. Since then, he has gone on to create his own trading site – OTA Academy – that teaches traders all over the world – including me at one point – how to trade supply and demand using his methods.
We must thank Sam, as without him, supply and demand as we now know it (and probably this site too) would not exist.
However, hold the applause… please…
While Sam does get props for coming up with supply and demand trading, the way he teaches people to trade the strategy contains THREE MAJOR FLAWS:
- Old zones have the potential to cause reversals (they don’t).
- Banks place pending orders at zones to make price reverse. (hint… they don’t)
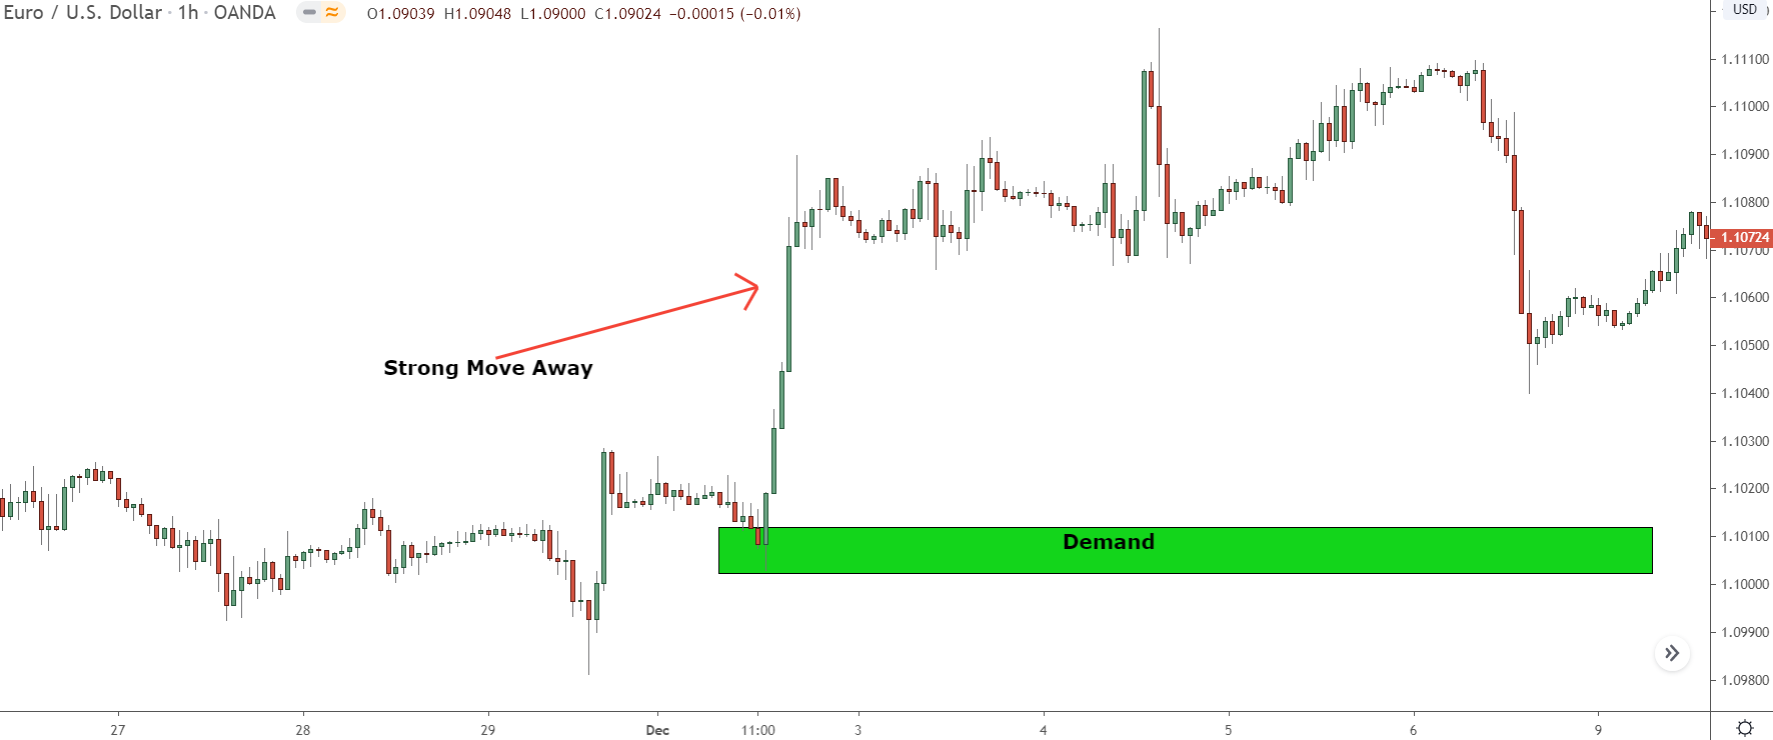
- Zones with a strong move away are more likely to work than zones with a weak move away. (duh, what do you think?)
I’m sure you’ve heard of these before?
On the surface, these 3 facts make sense – I mean, old zones cause reversals all the time, right?
However, when you take a step back, and think;
How does the market work?
And why does Sam believe these facts?
You begin to realize they don’t make any sense at all!
I know, from my own experience, trading S & D under these facts (beliefs) is a sure-fire way to suffer many, many losses.
To help you avoid this, today, I’m going to explain:
Why Sam gets these 3 facts wrong and, what you should use instead?
Sound interesting?
Let’s take a look at fact #1…
Saying Price Reverses From Supply & Demand Zones Because The Banks Have Left Over Orders
Anyone familiar with Sam Seiden knows he came up with supply and demand trading while working as an order runner in the Chicago stock exchange.
As a runner, Sam’s job was to place trades on behalf of the banks and institutions – kind of like a market maker, but more personal. It was during this time he (supposedly) saw the banks tend to place their trades at specific levels – what we know as supply and demand zones.
Sam says the banks would place their trades, causing price to reverse – creating the zone – and then they would make the price return to the same point later on to get the remaining trades placed. There are not enough orders to get all of their trades placed in one go.
Many of you have probably heard this before, especially if you’ve read my books.
Much of this is correct…
Sam is speaking sense here.
The banks do place their trades at specific levels, creating supply and demand zones. And because of how the market works, it’s true they never have enough orders available to place them all in one go – forcing them to make price return later on.
But, it’s how they place their leftover trades that Sam gets wrong and he gives people the incorrect way of trading supply and demand…
When the banks place their left over trades, Sam says they do so using pending orders – an order to buy or sell at a specific price. They place the order at the zone – as that’s where their initial batch of trades was placed. When price returns, the pending order executes, resulting in a reversal.
It makes a lot of sense, but here’s the thing:
The banks don’t use pending orders to enter trades…
They can’t because of how risky it is.
If the banks place a pending order at a zone, how do they know if enough opposing orders will be coming in by the time it returns for their orders to fully execute and place their remaining trades?
There’s no way for them to know. The same situation could repeat again and again and again.
Price might come back, and since not enough orders are coming in, only execute a few of the bank’s trades. That means they have to make it return again – wasting precious time and resources – just to get those remaining few trades placed.
So if the banks don’t use pending orders to get in, what do they use?
The answer: market orders.
Market orders allow you to enter instantly at the current price – you probably use these all the time. By using these, the banks can tailor their remaining trades to EXACTLY the number of orders available. This removes the risk of having to repeatedly return to a specific price to get all their trades placed.
With market orders, the banks have much more control over their positions and the effect they have on the market. They can tailor their trades around the orders coming in, rather than risk using pending orders.
On top of that, with market orders, the banks don’t advertise their positions to other traders. Other entities like hedges funds, pro traders, governments, etc can use pending orders as information about what price may do in the future.
For example:
If a hedge fund sees that a large pending order to buy has come in at 1.24000 on EUR/USD, they know someone must really believe price is about to rise, hence the big order.
They could then use that to their advantage, either by trading in the same direction or by rounding up opposing players to trigger the order themselves and then take the market in the other direction, causing the bank to lose.
I know it’s easy to look at the above and think “Hmm… is this really important for S & D trading?”
However, this idea that the banks place pending orders to cause price to reverse away from supply and demand zones underpins the entire strategy.
Most of the rules and guidelines for trading the zones, especially those that come from Sam, are based on this idea the banks have pending orders at the zone ready to cause a reversal. The fact that isn’t truth, means none of these rules hold any weight…
They shouldn’t be followed because they don’t make sense.
And the perfect example: The idea old zones cause reversals…
The Idea Old Zones Cause Reversals
Take one look at your charts, and you’ll see old supply and demand zones cause reversals all the time. Days, weeks, even zones that are years old seem to work perfectly fine and result in reversals.
But is it really the zones causing the reversals, or is it something else?
In Sam’s mind, it’s the zone…
He says old supply and demand zones have just as much chance of causing a reversal as new zones. His evidence for this comes from this fact: as a runner, he often saw the banks place their orders around old zones.
Therefore; old zones must cause reversals too – why else would the banks place their orders there?
Like a lot of things Sam says about supply and demand, on the surface, this seems like it makes sense. If you look at your charts, old zones seem like they cause reversals all the time.
However, in reality, this is an illusion…
While it looks like price reverses from old supply and demand zones, it’s not actually the zone causing the reversal, but something else – some other technical concept that has nothing to do with S & D.
And if you just stop to think about it for a minute, you will realize why it doesn’t make any sense.
Why would the banks wait months or years for price to return to a zone?
So they could get a few left over trades placed?
If the banks have left over trades, they want them placed ASAP!
They would not wait. The market could change, and invalidate their reasoning for entering.
Think about this …
If you enter a trade because you think price will rise, but you haven’t been able to get all the trades placed, you would want price to return to the same spot to get the rest executed quickly.
If you wait weeks and weeks, the reason you think price will rise may change, making it pointless getting the rest placed.
So, that’s why old zones don’t cause reversals. They look like they do – and for a long time I thought they did – but it’s not really the zone causing the reversal, it’s something else.
What that could be depends on where price is.
It could be a support or resistance level, big round number, a bunch of stop orders, a news release… etc,.
If you’re not sure whether a zone is old or not, check out the list below:
1 min/5 min/15 min charts – 1 day,
30 min/1 hour/4 hour charts – 20 days,
Daily chart– 3 months.
These are the times (roughly) of when a zone becomes old and should not be traded. They’re not exact times – be sure to give a little leeway for each – but they should keep you trading the right zones.
Saying The Best Zones Are Those With A Strong Move Away
Back in the day, I took a lot of flak for saying zones with a strong move away aren’t necessarily strong. Yet it’s absolutely true, and one of the main reasons people still lose money with supply and demand.
For those not in the know, Sam repeatedly says the best zones are those that form from a strong move away.
Zones like this for example…
Ever traded these before?
Sam says these zones have a higher than average probability of causing a reversal because they show the banks have a large number of left over orders (trades) at the zone, as the sharp move away meant they weren’t able to get them all placed.
Now technically speaking, Sam is correct about this…
When price shoots up or down, it shows a big order came in – hence the huge jump in price. So it is highly unlikely the banks were able to get all of their trades placed and did indeed have some leftover.
Where he gets it wrong, however, is what I explained earlier:
The banks don’t use pending orders to enter trades…
The banks use market orders.
If the banks place pending orders at the zone to execute once price returns, they can’t know if enough opposing orders will be available for their own orders to get placed. They could have a situation where not enough orders are coming in, which would mean not all of their trades get executed, resulting in the same situation all over again.
So, this idea that zones with a sharp move away are strong because they show the banks have lots of left over orders at the zone… doesn’t make sense. I can see why he thinks this way and how it looks that way from the chart, but it’s not the case.
It can’t be because the banks don’t use pending orders to enter trades.
With that, I guess the next question is:
“If zones with a sharp move away aren’t actually strong, which zones are?”
Really, I haven’t got enough time to cover this in-depth today because it involves lots of explaining and technical talk.
However, here’s a small overview anyway, so you have some idea of what to look for:
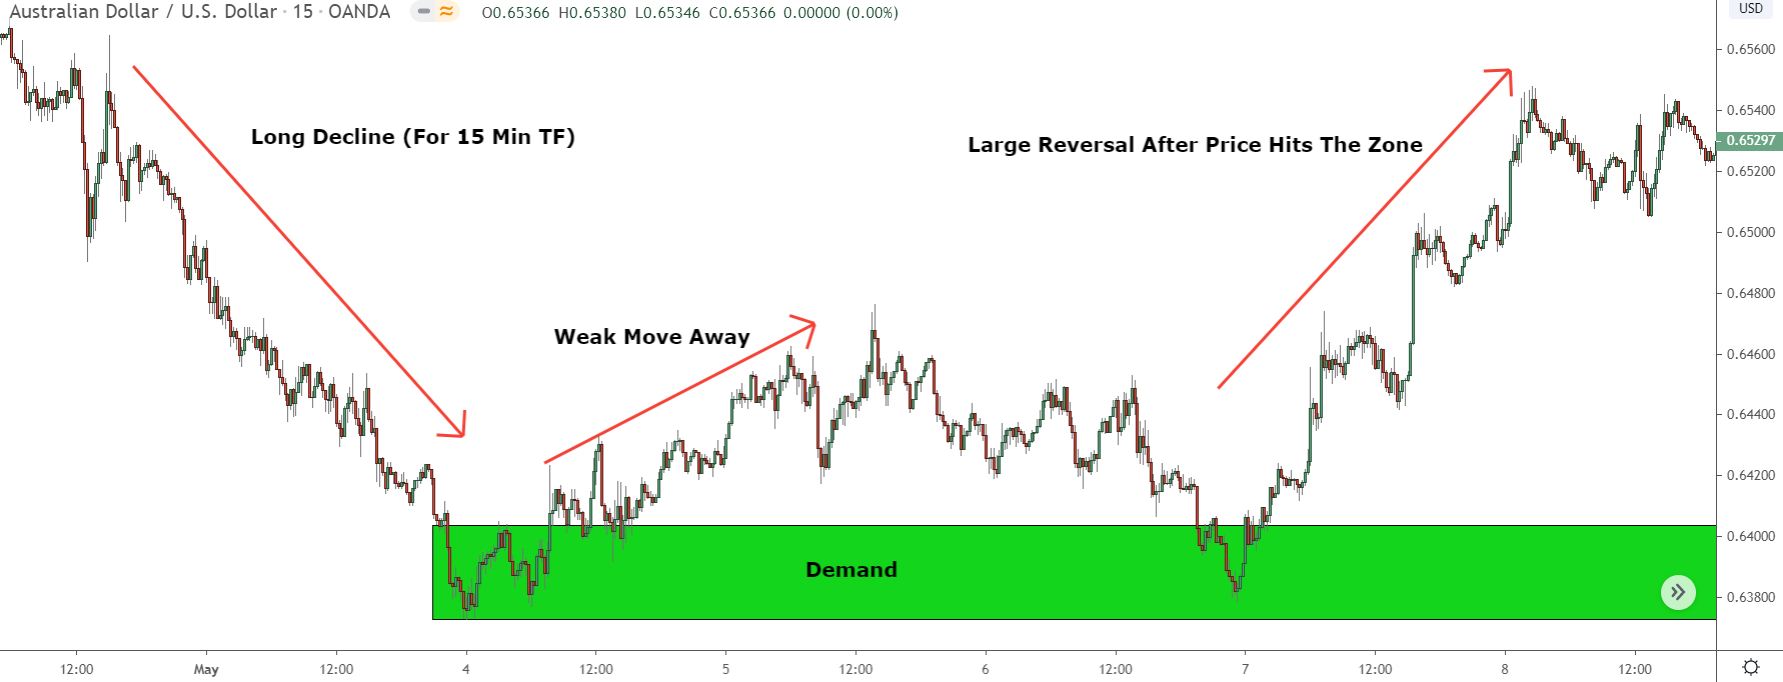
To find the strongest zones, you want to look for zones that are preceded by a long rise or decline. (a sharp move into…)
Without getting into too much detail – otherwise we’ll be here all day – when price rises or falls for a long time, it causes more and more traders to enter trades in the same direction.
This is because most traders believe in the concept of trend, which is: The longer price moves in the same overall direction the more likely it is to continue in that direction rather than reverse.
Like “trend-traders” invented “inertia?”
No doubt you’ve heard this before.
Note: When I say trend, I mean any long movement from one point to another, like a swing, for example. Even though a swing may not be a trend on one timeframe, on the lower timeframes, it is still technically a trend because of how long price has moved in the same direction.
For the banks, the trend is hugely important, as it determines the size of the trades they can place.
Remember, their trades are HUGE.
They require masses and masses of opposing orders (people trading in the opposite direction) to be able to place all of their trades. And the more they need, the more traders they need placing trades against them.
So long movements (trends) give the banks the ability to place much bigger trades, as they have more orders available.
What does this mean for supply and demand zones?
It means zones that form after a long movement in the opposite direction (e.g a demand zone after a long decline) are much stronger than those that form after a small movement or movement in the same direction – like RBR/DBD zones, for example.
After a long movement, the banks have way more orders available due to so many traders placing trades in the trend direction.
This gives them the ability to place much bigger trades, resulting in a stronger zone forming.
As for the move away, it has NO effect on this.
All it shows is that the sell orders (assuming the banks bought) got gobbled up quickly, causing price to jump higher. It doesn’t mean the banks placed a big trade, or that they have lots of left over orders at the zone. So it has nothing to do with how likely it is for price to reverse once it returns
The Bottom Line
Sam Seiden gets a lot right about supply and demand trading, no doubt. However, the 3 facts mentioned today he gets wrong, plain and simple. They sound (and look) like they make sense, but in reality, they just don’t add up with how the market works or how the banks operate.
If you’ve not had much success trading S & D, consider changing your approach using what I’ve explained today.
If you keep losing money from trading old zones, stop trading them, and focus on newer zones.
If you always take trades from zones with strong moves away, forget them and start trading the zones preceded by long rises and declines.
Most of my losses came from zones like those above, so if you cut them out of your trading, you should dramatically lower your losses and improve your win rate.

Grab Your FREE E-Book:
5 Pro Rules For Trading Supply And Demand
- Master the core principles of supply & demand.
- Advanced techniques for trading SD zones.
- Exclusive new lessons/books/tools every week!
Sign Up Now To Download Your FREE Guide:
🛡️ Spam-Free Promise: No spam, ever. We'll only send you relevant updates and content. Unsubscribe at any time.
HI, i am little confused with the Liam(the YouTube channel you recommend about the event chain strategy of the supply demand zone trading).
can you explain a little, why does the price backtest the higher timeframe s/d zone, then go down to the lower timeframe, play the event chain, then it result successful trade.
I am very confused with that. can you tell me what’s the idea behind it.
Thx
To be honest, John, I’m really not the expert when it comes to the event chain. Atlas – who runs the channel – trades in a different way to me, so I don’t have a great understanding of the event chain or how it works. If you leave a comment on his next video asking what he means, he’ll probably get back to you. He always responds to comments pretty fast, so he should be able to clear it up.
HI, Liam
as you said. the longer the move before. the stronger then zone is. so. in your way. how long the trend should move before the s/d zone, in order to forms the strong s/d zone
thx
really confused
Hi tony its pretty simple if you understand the concept of the trend.
Herding more ppl (retail traders)place traders late .so if the market falls for 5 days most ppl wont say its trending a long time but if it falls 20 days more ppl will begin trending the trend.you can see pullbacks and more pullbacks .keep learning .
les banques ont un reseau ip spécifique et travaillent de concert pour que ça marche il doit y avoir un depot de chacune d’elle pour que l ordre informatique déclenche tous les dépôts de chaque partie en même temps .
d’ou les ordres en attentes de déclenchement.