
If you’ve spent any length of time studying price action, you’ll have come across the concept of support and resistance.
One of the most important trading concepts, support and resistance levels are lines that identify points where the price of a currency has a high probability of reversing. They form on all currencies and time-frames, and are an invaluable tool you need to know to trade price action successfully
Today, I’m going to show you how trade support and resistance levels
While there are lots of guides about the levels available on the web, many don’t properly explain how and why they work, so I want to clear that up today as well as give you some simple ways to use them in your trading.
Here’s a quick overview what you’ll learn…
There’s lots to get into, so without further ado, lets get started
Part 1: Breaking Down Support And Resistance
As price action concepts go, support and resistance is one of the oldest in all of trading.
The levels have been used for (literally) centuries now, way before trading was even conducted online, and are still to this day one of the most popular trading techniques, mainly because of how useful they are.
But what really are support and resistance levels?
Well, in simple terms: horizontal lines that indicate a point where a currency has a high probability of reversing…
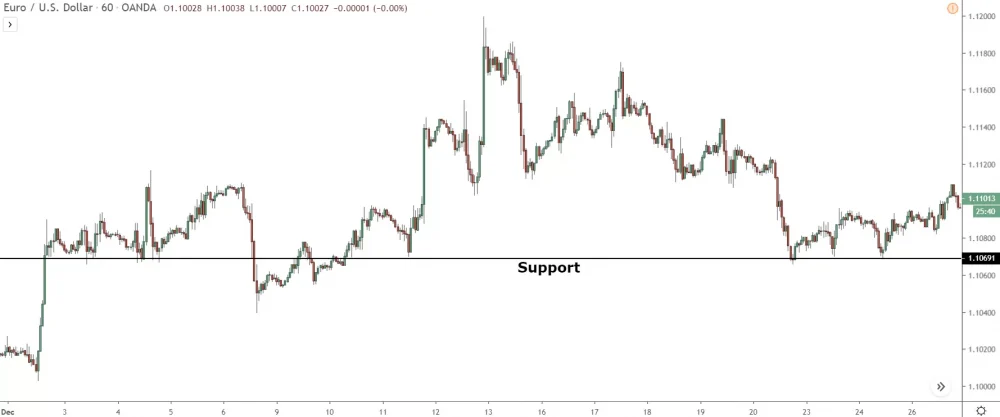
A support level is a point where price is likely to stop falling and start rising – these are always found BELOW the current price.
- Historical Price Level: A support level is often established at a price point where the asset has historically stopped falling and rebounded. The more frequently the price tests a support level without breaking it, the stronger the level is considered.
- Buying Pressure: Support levels indicate a price point where increased buying pressure overcomes selling pressure. This pressure can come from traders who believe that the asset is undervalued at this price, or from traders who are closing their short positions.
- Price Bounces: When the price of an asset reaches the support level, it tends to “bounce” off and start rising. This is because the perception of the asset’s value increases as it approaches support.
- Role Reversal: If a support level is broken, meaning the price falls through it, it’s likely to become a resistance level for future price movements. This happens because traders’ sentiment changes after the price falls below a significant support level.
- Volume Increase: Volume tends to increase at support levels during the downward price movement. High volume indicates that traders have increased interest in the asset at that price level.
- Round Numbers: Support levels often occur at round numbers (like 10, 20, 30 for a stock or 1.3000, 1.2000 for a currency pair) due to the psychological importance.
- Technical Indicators: Moving averages, trendlines, or Fibonacci levels can also serve as dynamic support levels.
- Time Frames: Support levels can exist in any time frame, from intraday charts to long-term multi-year charts. However, those seen on larger time frames are typically considered more significant.
- Support Zones: Rather than a precise price point, support is usually identified as a price zone. Within this zone, numerous market participants often place their buy orders.
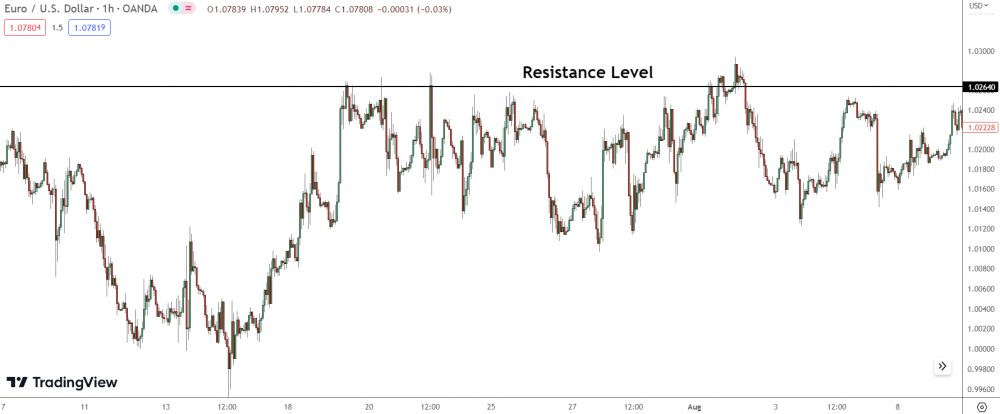
And a resistance level is a point where it’s likely to stop rising and start falling – these are always located ABOVE the current price.
- Historical Price Level: A resistance level is often established at a price point where the asset has historically stopped rising and reversed. The more frequently the price tests a resistance level without breaking it, the stronger the level is considered.
- Selling Pressure: Resistance levels indicate a price point where increased selling pressure overcomes buying pressure. This pressure can come from traders who believe that the asset is overvalued at this price, or from traders taking profits on their existing long positions.
- Price Rejection: When the price of an asset reaches the resistance level, it tends to “reject” the level and start declining. This is because the perception of the asset’s value decreases as it approaches resistance.
- Role Reversal: If a resistance level is broken, meaning the price rises through it, it’s likely to become a support level for future price movements. This happens because traders’ sentiment changes after the price breaks above a significant resistance level.
- Volume Increase: Volume tends to increase at resistance levels during the upward price movement. High volume indicates that traders have increased interest in the asset at that price level.
- Round Numbers: Resistance levels often occur at round numbers (like 50, 100, 150 for a stock or 1.5000, 1.6000 for a currency pair) due to the psychological importance.
- Technical Indicators: Moving averages, trendlines, or Fibonacci levels can also serve as dynamic resistance levels.
- Time Frames: Resistance levels can exist in any time frame, from intraday charts to long-term multi-year charts. However, those seen on larger time frames are typically considered more significant.
- Resistance Zones: Rather than a precise price point, resistance is usually identified as a price zone. Within this zone, numerous market participants often place their sell orders.
What Causes Support And Resistance Levels To Form?
At a glance, you might glance at the information above and muse, “Hmm, support and resistance levels seem pretty straightforward…”
Indeed, they are!
However, there’s a complex backstory to how and why these levels form that’s crucial to grasp before deploying them.
Much like many facets in forex, the formation of support and resistance levels is rooted in the banks’ buying and selling habits.
But it’s not as straightforward as it seems…
See, banks don’t directly influence the formation of these levels.
Instead, they cleverly exploit the orders that accumulate around these levels to execute their trades, scoop up profits, or to close out trades.
I can hear your brain whirring – this all sounds a bit convoluted, right?
Allow me to demystify…
In order to place trades, secure profits or close trades, banks (and us too, though we’re not hugely impacted) require orders.
To put it simply, they need other traders exectuing the opposite action (buying when they want to sell, selling when they’re looking to buy), or they need the price to be at a juncture where a multitude of pending buy or sell orders are poised.
Key Point: Pending orders morph into regular orders upon execution, so they operate much like any buying or selling action.
Thanks to their long-standing popularity a flood of pending orders typically congregates at and around S & R levels. Traders exploit these levels to predict where the next market reversal might commence.
This makes these levels highly attractive to banks when they’re looking to manipulate the price.
By strategically driving price to a specific level, banks can leverage the surplus of orders to help lock in profits, exit open trades, or initiate new reversal trades. Whenever they undertake these actions it triggers a price movement in the opposite direction, hence why we see price reversals at S & R levels.
So, that’s the nitty-gritty on how support and resistance levels function and why they trigger reversals.
Now, let’s delve into how to identify and plot these levels.
Part 2: How To Find And Draw Support And Resistance Levels The Right Way
Ask any trader about their biggest challenge in employing support and resistance levels, and you’re likely to hear a unanimous response:
The task of identifying and sketching those elusive levels.
The irony here?
This should be a walk in the park!
Spot a handful of reversals sprouting from a similar point, then draw a line over the top.
Sounds simple, right?
Well, let me tell you, it’s anything but.
The real hitch in locating and drawing support and resistance levels, primarily the latter, lies in the discrepancies among the reversals. The reversals never perfectly align; some start a tad higher or lower than the others, depending on where they form.
What this implies is a bit of a tightrope act when defining the levels correctly.
You need to thread the line through the aligned reversals, all while keeping it in striking distance of the outliers.
Slip up and plot the line based on the wrong reversals, when others are better aligned, and you’ll end up with an inaccurate level. This can throw a wrench in the works, causing the price to reverse from an unexpected spot and leaving your entry in disarray.
Sadly, there’s no magic bullet for pinpointing and sketching these levels, but I do have a few tricks up my sleeve that might make your journey a tad less grueling.
Ready to dive in?
Let’s explore.
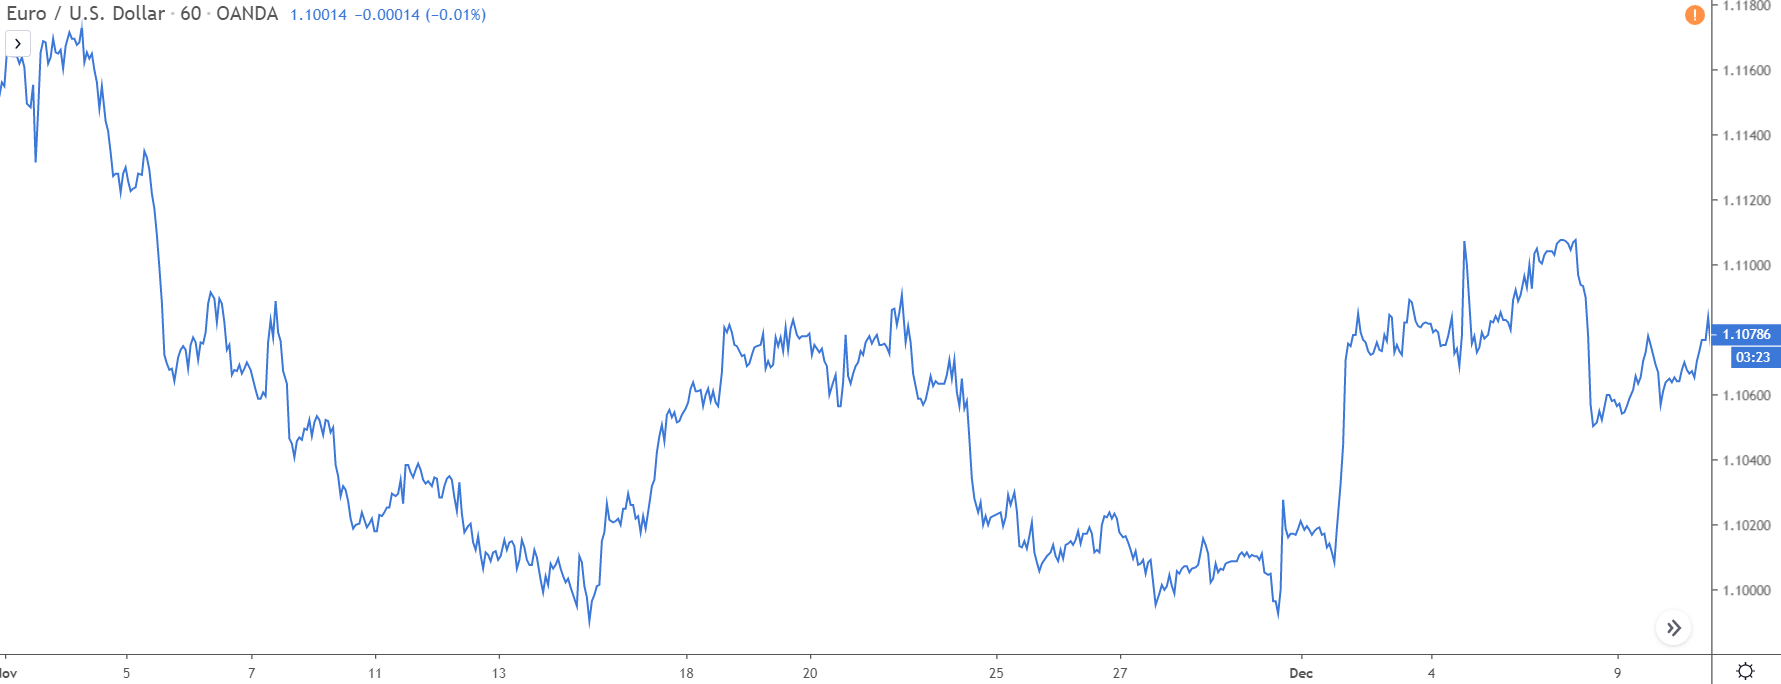
Step 1: Switch To A Line Chart
Before you can even think about drawing these levels, you need to be able to spot them on a chart.
Sounds a bit tricky, right?
But don’t worry, I’ve got a neat little trick up my sleeve to make things a lot simpler.
Enter line charts!
Although they’re not your go-to for trading, they’re your best friend when it comes to spotting support and resistance levels. They provide a clear picture of where each reversal began, which, trust me, makes finding and sketching the levels a breeze compared to the usual approach.
So, how do you switch to a line chart?
Easy peasy!
Just navigate to the chart tab on whatever trading platform you’re using and select “Line” from the drop-down menu.
Done right, your chart should now look something like this…
Step 2: Find Reversals That Take Place From A Similar Point
Now, brace yourself for the more challenging part:
Remember, support and resistance levels materialize due to banks consistently buying and selling around the same point. This happens because that’s where a chunk of orders amass which they can utilize to place trades, close trades, or pocket profits.
What does this mean for you? Well, to identify these levels and then mark them on your chart, you need to scout for multiple reversals (at least a pair) that have sprung from the same or a similar point.
I won’t lie, it’s not a walk in the park, so keep your eyes peeled.
Look at the example above…
Spot any reversals kicking off from a similar price point?
Zooming out may make it a bit tricky, but here’s the breakdown: we’ve got three distinct sets of reversals that unfolded on this chart. One set paved the way for a support level while the remaining two formed resistance levels.
Now, let’s refocus on one set of reversals…
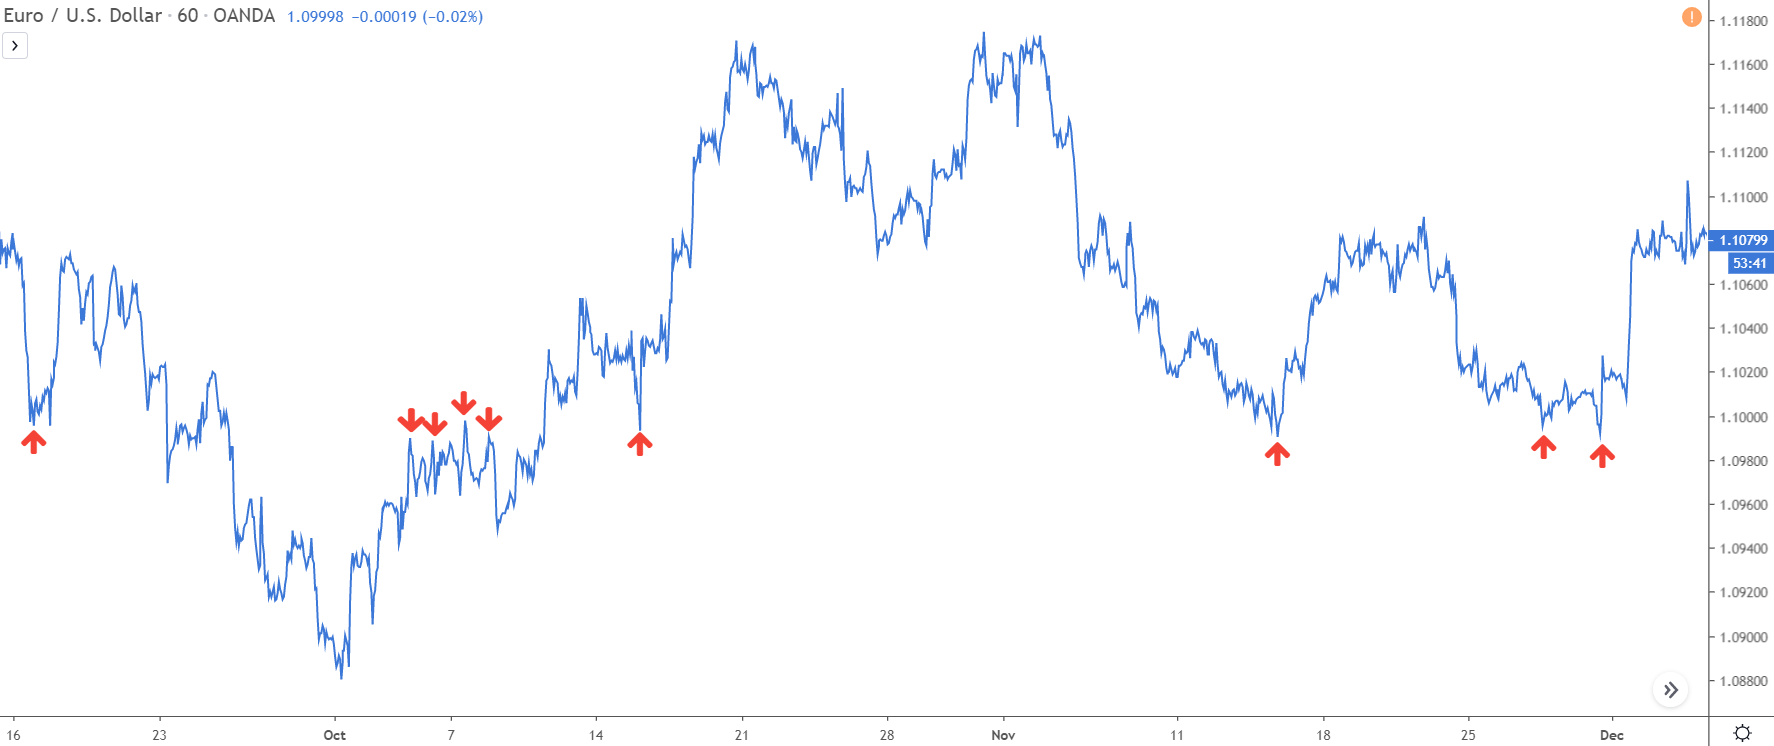
Notice the birthplace of these reversals?
They all formed at similar prices BELOW the current price.
This clustering of reversals indicates a support level in the making. Why? It signals that a hefty amount of orders tends to congregate around this price, hence the multiple reversals mushrooming from the same spot.
So, how do we spot this elusive support level?
Simple.
Draw a horizontal line across the peak of as many reversals as possible.
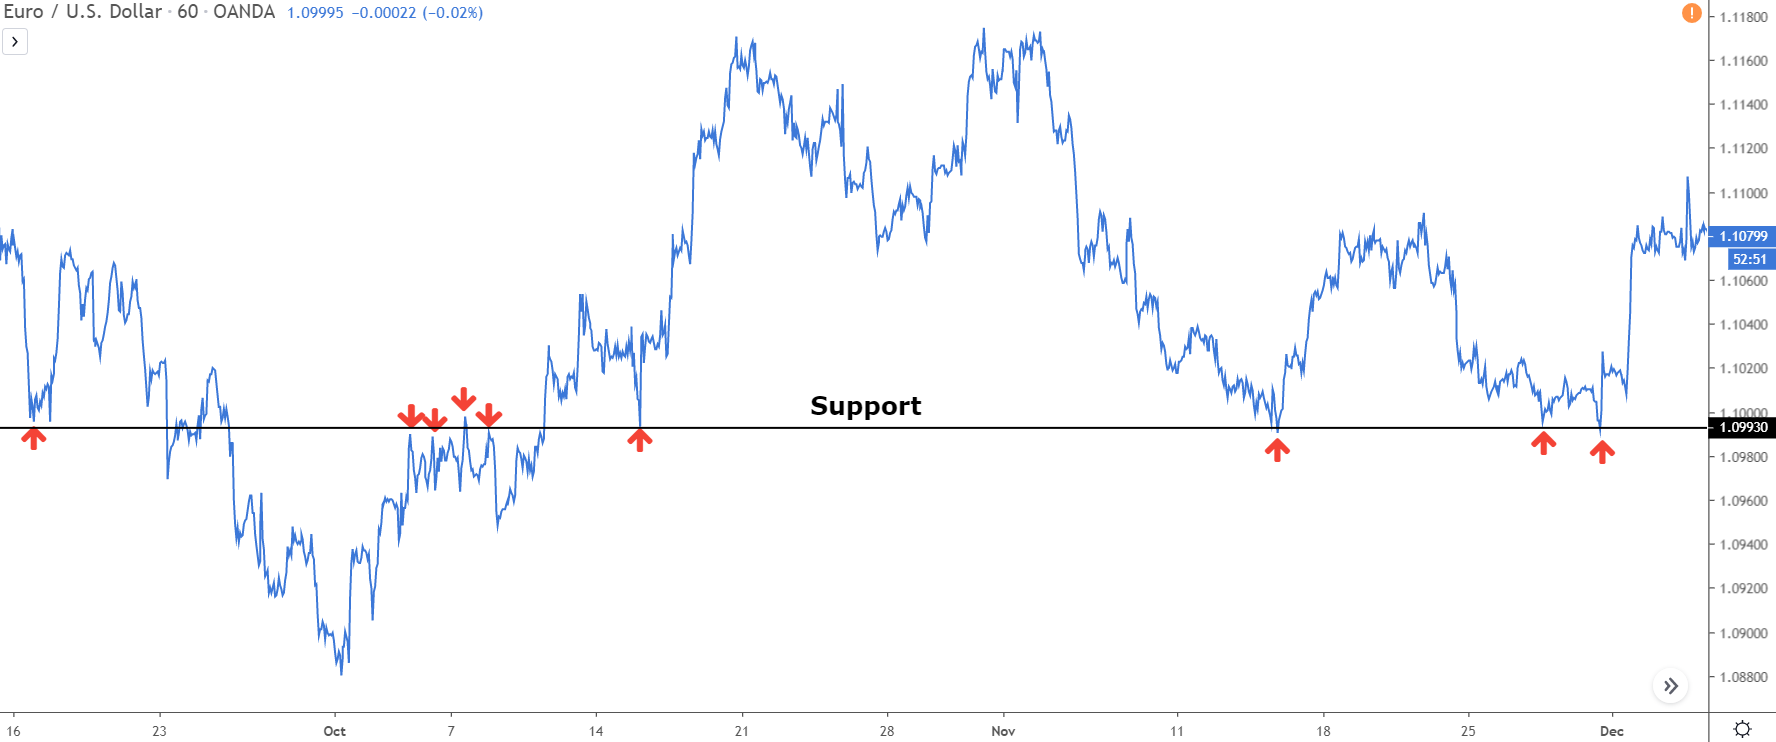
Here’s what it looks like with the line drawn in.
See how our line, despite not perfectly aligning with each reversal’s origin, hovers close to all reversals and nests neatly on those that align?
This is the blueprint for marking your levels.
Aim to align your line with the lined-up reversals, while making sure it remains close to or threads through the non-aligned ones, just as our line does in the image above. Adjust your line until it meshes well with the reversals – voila, you’ve got your support or resistance level.
Let’s roll onto another example…
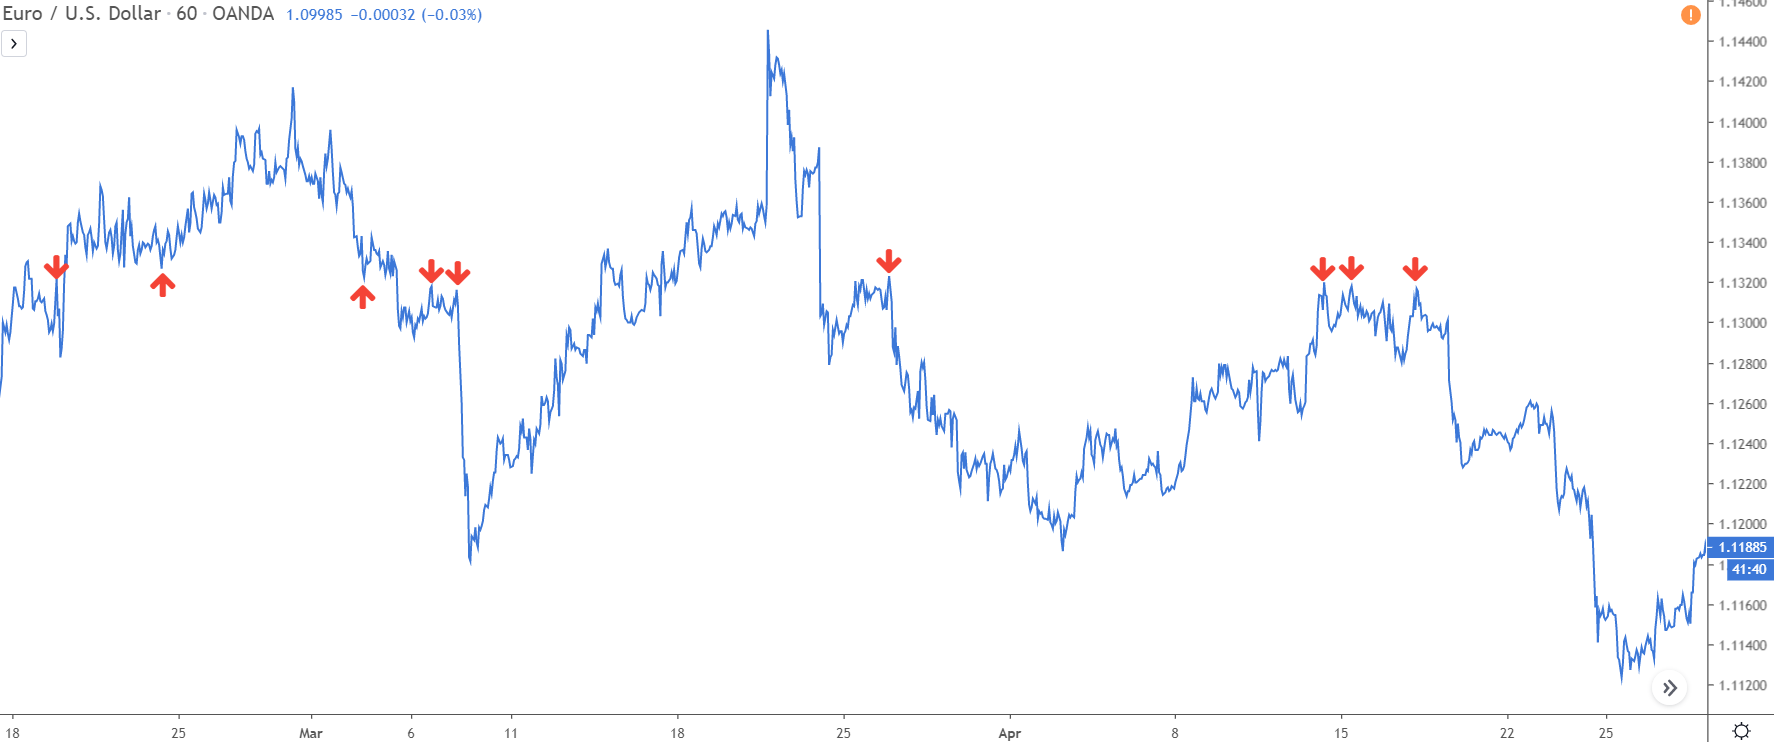
Now, we’re peering at another batch of reversals that popped up on EUR/USD.
As with our previous example, these reversals all sprouted from a similar price point. However, they’re nestled ABOVE the current market price, hinting at a resistance level lurking here.
To hunt down the level, plant a line through the peak of as many reversals as you can.
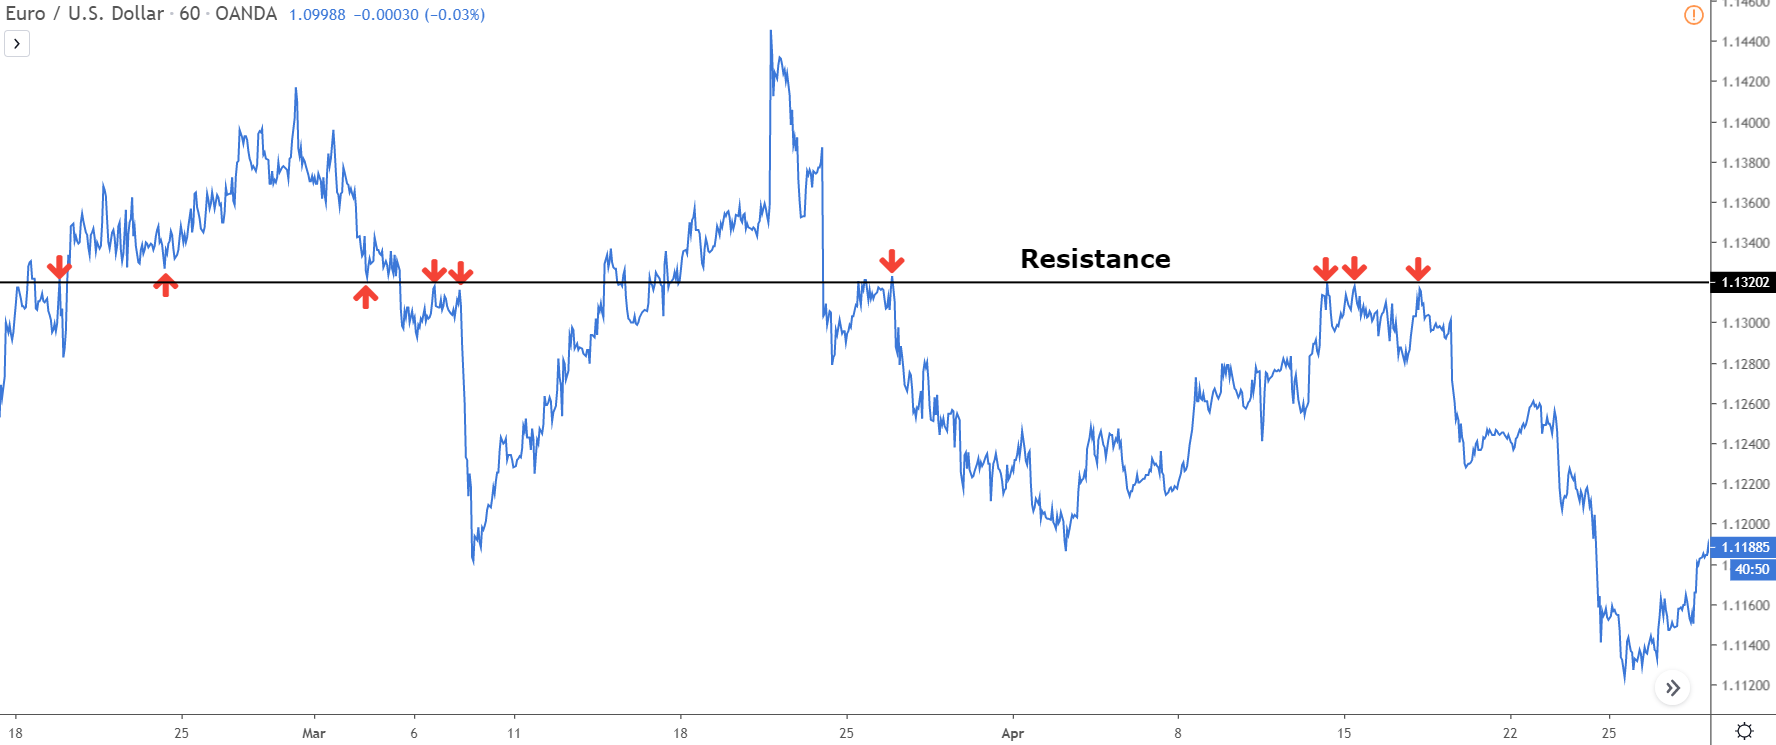
Once again, note how the level doesn’t perch atop each reversal, but it does align with those that line up and either grazes or pierces through the outliers.
Usually, you’ll find reversals split three ways; a few will align, some will shy away from the level, and the rest will be slightly breached by the level. However, keep in mind that there are instances where multiple reversals are intersected by the level while only a handful are touched.
Now, let’s gear up for the final step.
Step 3: Switch Back To A Candlestick Chart
Alright, you’ve got your support and resistance levels all marked up on the line chart. The next step? Switch over to a candlestick chart and let’s see how those levels are holding up.
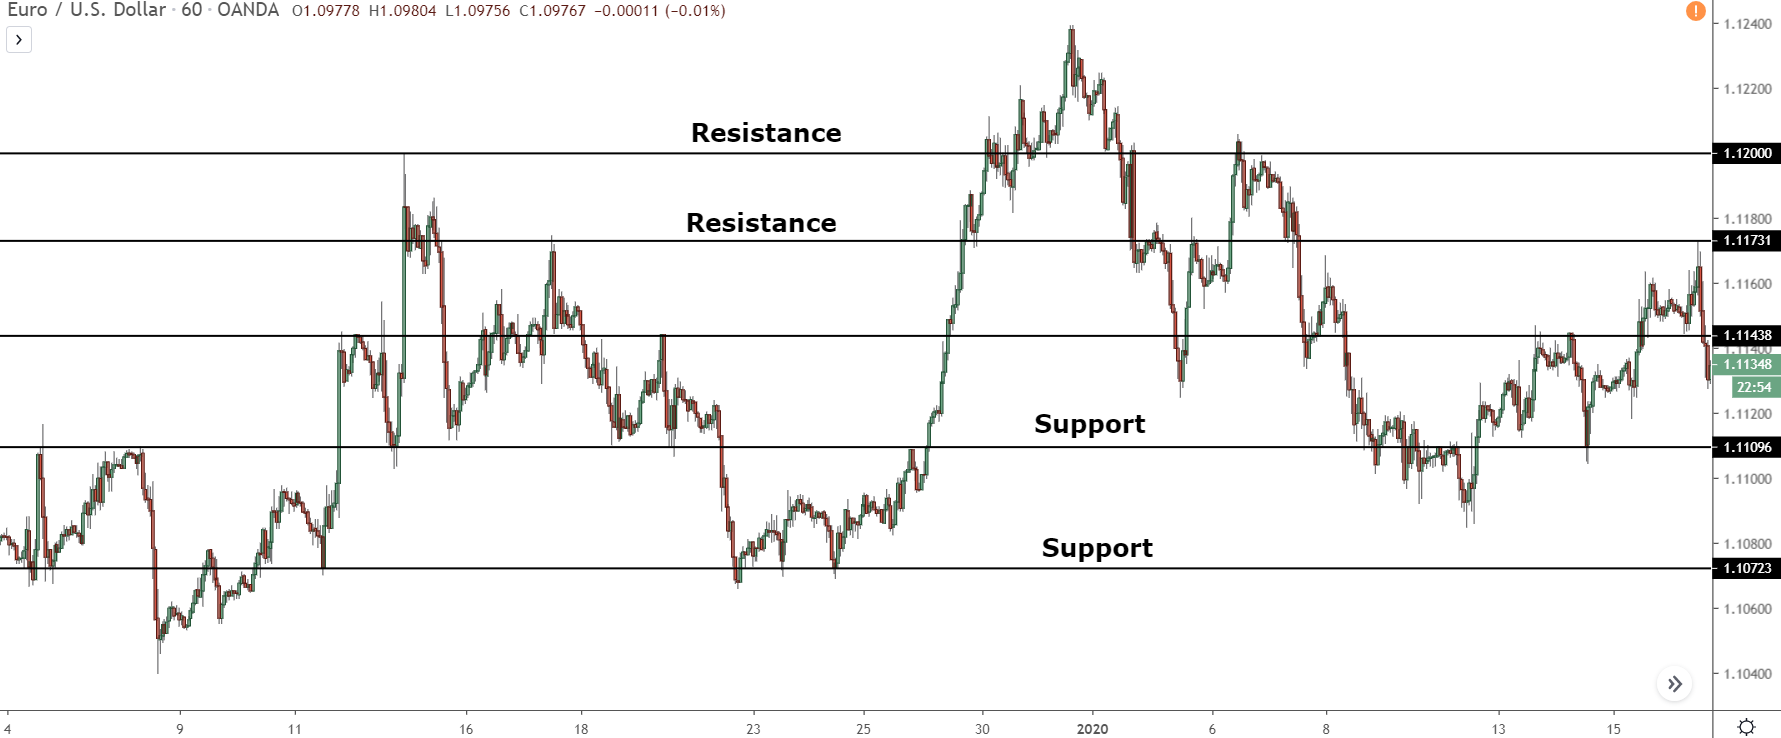
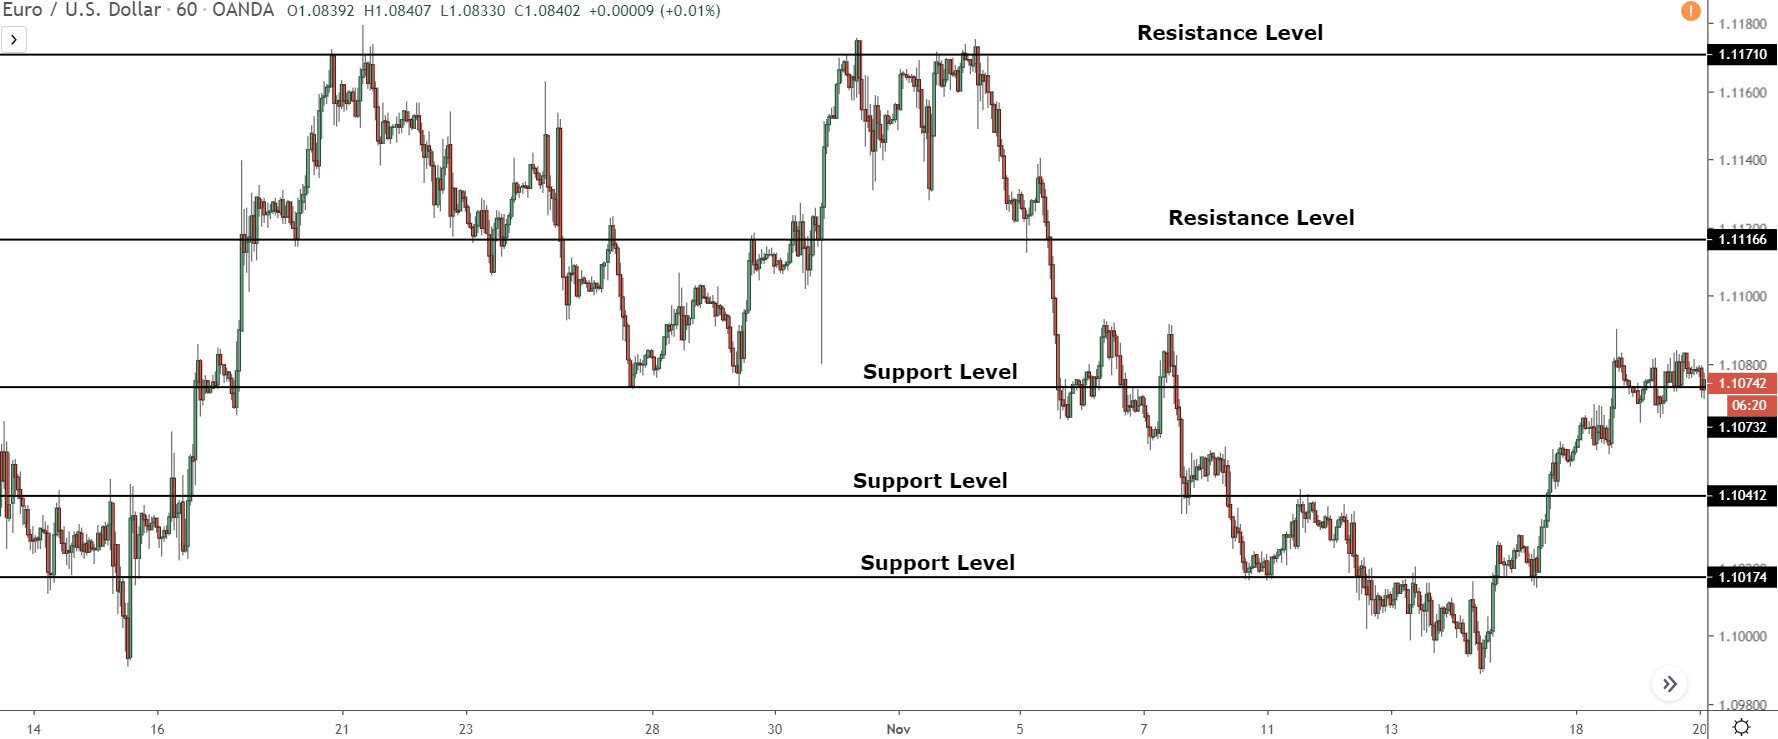
Curious about what 5 support and resistance levels look like on a candlestick chart?
Well, you’re about to find out!
Sure, you can totally mark these levels using a candlestick chart. I mean, that’s how I learned to do it, and it served me pretty well. But let’s be real, it’s a bit more challenging. Why? Those candlestick wicks, my friend. They can turn spotting the start of each reversal into a bit of a guessing game.
But hey, don’t sweat it! Like anything, it gets easier with time and practice. For now, let’s keep it simple and stick to the line chart.
So, there you have it – your beginner’s guide to finding and marking support and resistance levels. Was it as daunting as you thought it would be?
Here’s the reality – it’s gonna take a bit of time to get the hang of picking out the right levels and marking them accurately. Trust me, I’ve been there. But with enough persistence and practice, it’ll become as natural as breathing. You’ll be glancing at charts and those key levels will just pop right out at you. So keep going, you’ve got this!
Was this response better or worse?BetterWorseSame
3 Things To Remember When Finding And Drawing Support And Resistance Levels
Here are a couple of important points you need to remember when finding and drawing support and resistance levels…
- #1: Three’s the Magic Number for Valid Support and Resistance Levels.
In order for a support or resistance level to be considered valid, we need to see at least three recent reversals – or ‘touches’, if you prefer that term – originating from the same, or very similar, price point. If a level doesn’t have three such reversals in recent memory, it’s not up for the trading game and should be benched off your chart.
Now, you might be wondering, what constitutes ‘recent’? Well, that depends on your timeframe:
- For a 5-min chart, look for reversals within the last day.
- For a 15-min chart, consider the last three days.
- For 30-min or 1-hour charts, look back eight days.
- For 4-hour charts, go back 11 days.
- For daily charts, consider the last month.
Once you’ve spotted your three recent reversals – three in the last day for a 5-min chart, for instance – you then backtrack to find five more that kicked off from a similar starting line in the past. Plot your line on the chart, and then tweak it in relation to all eight reversals to pinpoint your support or resistance level.
Just a quick note: For 4-hour and daily charts, you’ll only need to find five total reversals since the action on these timeframes isn’t as frantic.
- #2: Frequency of Reversals Doesn’t Determine the Strength of a Level.
There’s a tall tale floating around in the world of support and resistance that the more frequently a price reverses from a level, the stronger that level becomes. This myth has been making the rounds in books, videos, and even among price action pundits for quite some time, but it’s a red herring. In fact, it doesn’t even hold water when you think about it.
I won’t delve into why this is the case today – for a detailed deconstruction, you can check out my post on S & R secrets – but take my word for it: don’t be fooled into thinking a level is rock-solid just because you see frequent reversals.
- #3: Mark Only Levels Close to Current Price Action.
When it comes to charting support and resistance levels, keep it tidy and focus on the levels closest to your current price action. If you start scribbling levels all over the place, your chart will look like a toddler’s doodle, and you’ll lose track of which levels to keep an eye on and which ones carry more weight.
Your mantra should be: ‘Keep it simple.’ Only mark the two or three levels nearest to your current price, and any fresh ones that crop up.”
Part 3: Using Support And Resistance Levels In Your Trading
So, we’ve delved into the nitty-gritty of support and resistance levels—what they are, why they form, and how to mark them on your chart.
With this information in hand, you’re ready to put these levels to good use.
However, before we wrap this up, I’d like to share a few simple yet highly effective techniques for integrating support and resistance levels into your trading strategy.
Let’s kick off by discussing their role in deciding when to take profits from your trades.
Using S & R To Take Profits
Determining when and where to pocket profits—either partially or in full—is a tricky aspect of trading. Just one small miscalculation, a tiny slip in judgment, can cause you to miss out on substantial profits or even wipe out your gains if you take your profits too late.
Sadly, there’s no surefire strategy—none that I’m aware of, at least—for consistently timing your profit-taking just right.
However, certain situations practically scream “take profits now!”
One such instance is when the price nears a support or resistance level.
Why?
Because S & R levels are essentially price reversal hotspots. Taking profits as the price nears a level could help you sidestep any impending reversal that might eat into your earnings.
Let’s consider a hypothetical scenario…
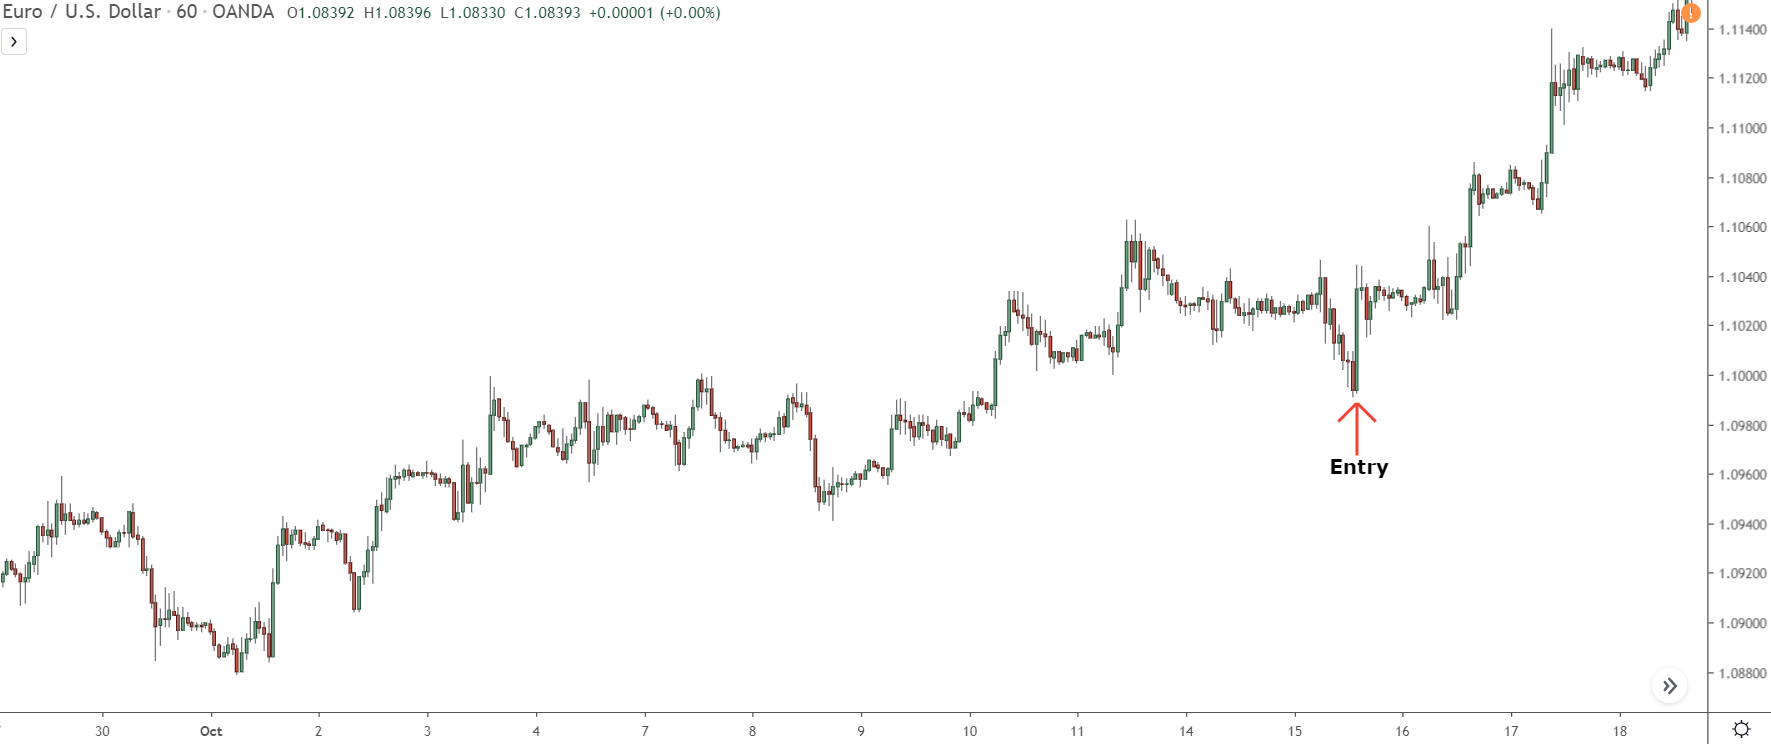
Imagine you entered this uptrend at the black arrow, at around 1.0994.
The price has been on a steady climb, padding your profit. Naturally, you’d want to preserve this gain, but how can you decide if now’s the right time to take some profits off the table?
One approach is to check if the price is inching close to a resistance level.
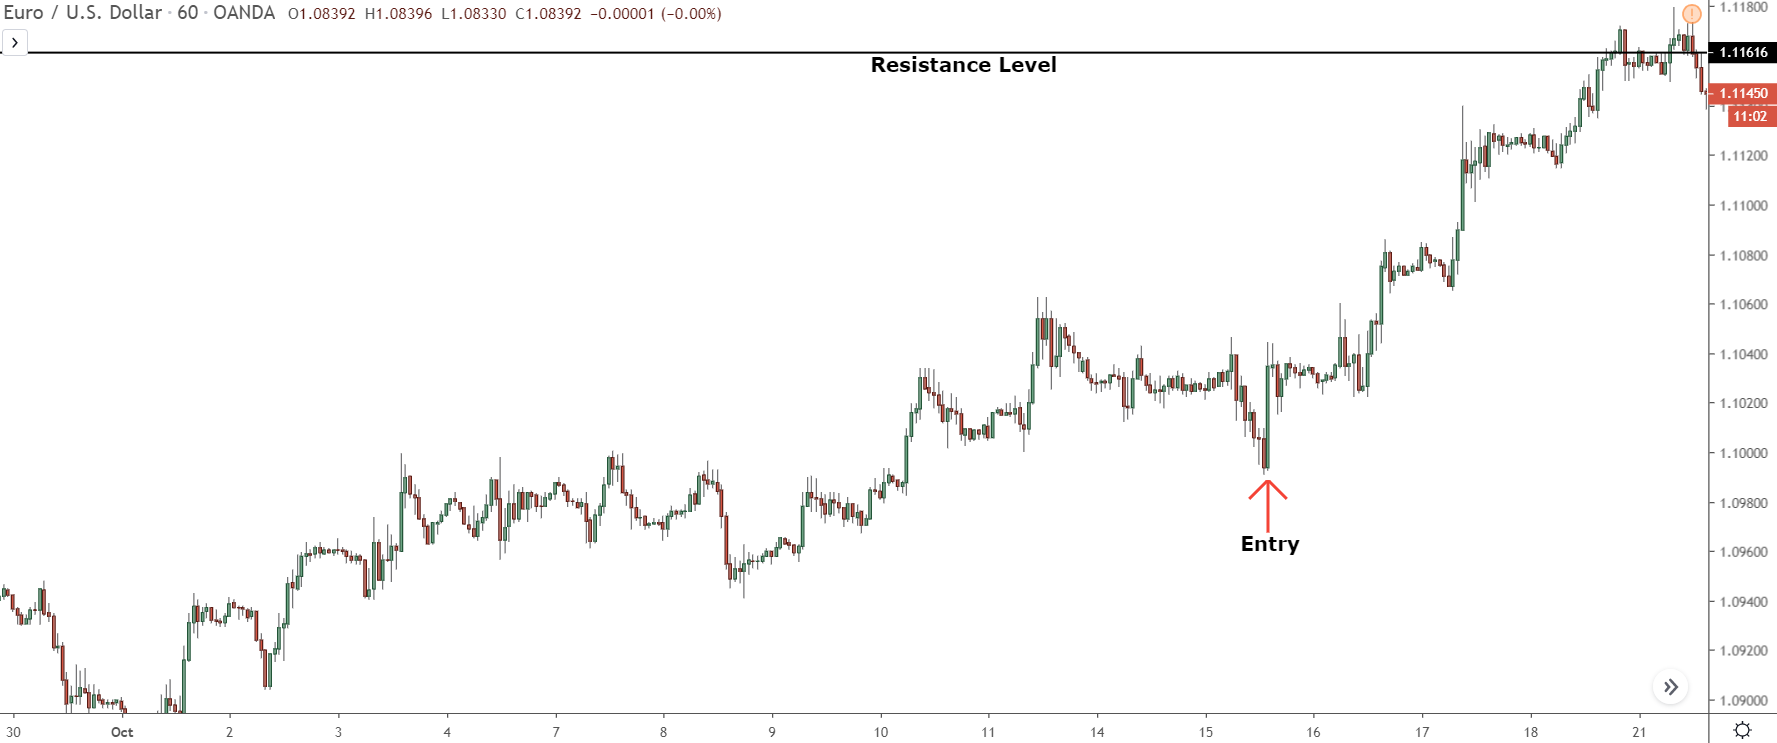
Brace yourself when you see the price inching dangerously close to that resistance level.
Why?
Because there’s a solid chance it could spin around on its heels any second now!
Think about skimming off a bit of your profit, nudging your stop upwards – ideally to a freshly flipped resistance-now-support level. This clever move can cut back much of your risk, acting like a safety net if the price takes a nosedive.
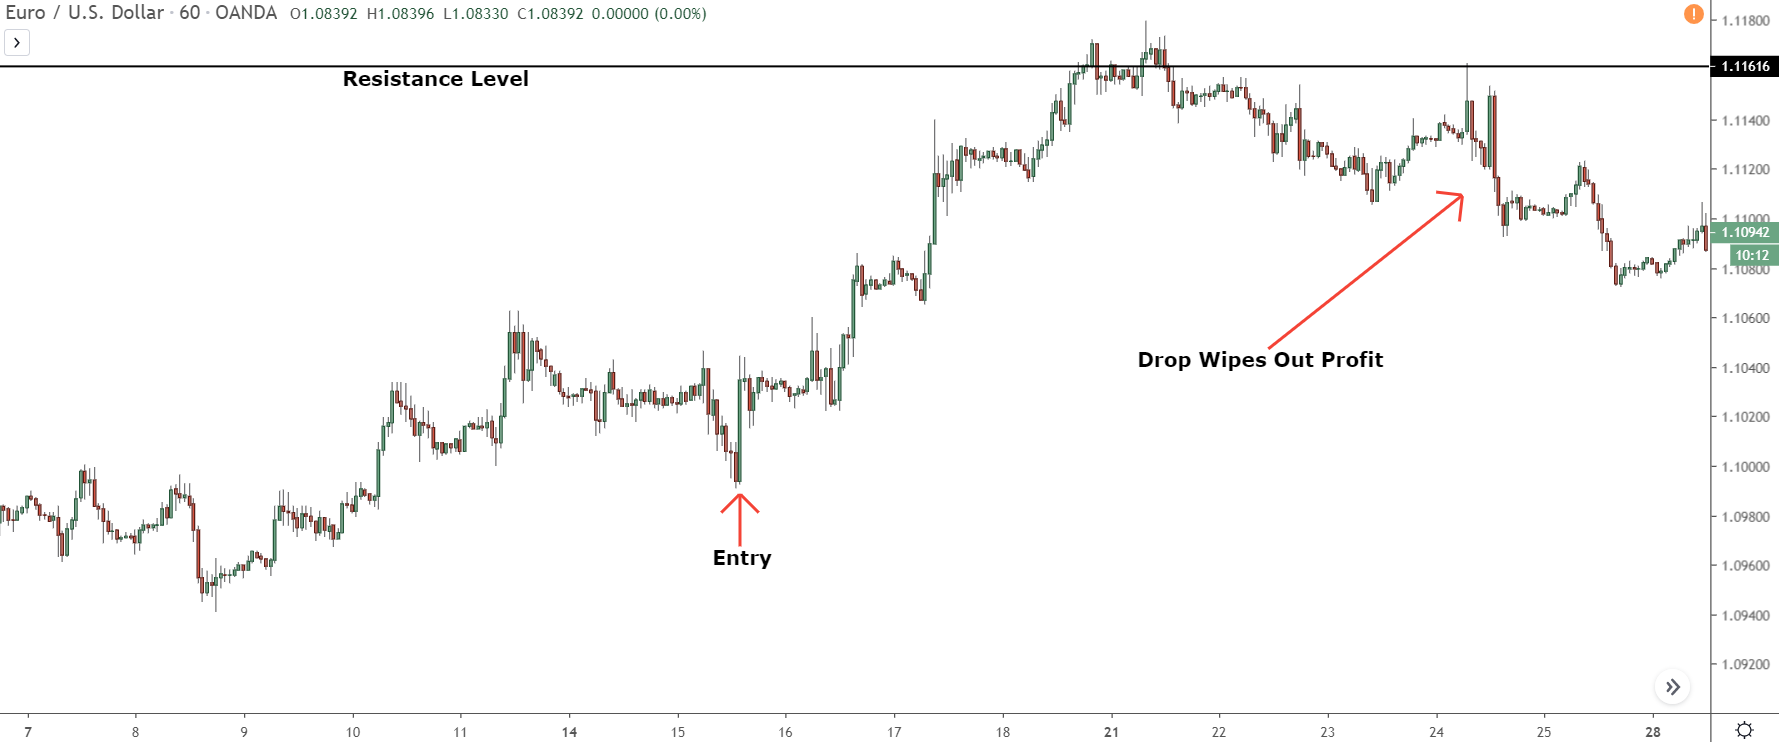
And you know what?
In this particular instance, that turned out to be a stroke of genius! Because right after the price grazed the level, it about-faced and started tumbling down.
The same rule applies for support levels.
Spot the price sidling up to a support level while you’re in a short trade? Well, buddy, that’s your cue to pocket some profits.
The odds of it reversing and escalating are sky-high.
Cool as a cucumber, right?
Creating A Support And Resistance Strategy
Crafting a support and resistance strategy in 2023 might seem like a futile exercise.
After all, with the sheer number of strategies already floating around, many have grown outdated or simply don’t pack the punch they used to.
But hold on a sec – they’re not entirely worthless.
Indeed, you can still glean a multitude of setups using support and resistance (S & R) levels. Sure, they may not technically be ‘strategies’ per se, but they do serve up some extra chances to rake in the moolah. It’s always savvy to keep a few of these in your pocket, as a complement to your main trading strategy, to keep your profit & loss statement in a happy place.
One setup that often catches my eye at S & R levels is the ubiquitous ‘pin bar’.
Many of you seasoned traders will recognize this setup – it’s a popular price action strategy that’s been in the game for a good few years now. The main idea here is to keep an eagle eye out for the pin bar candlestick to form when the price hits a support or resistance level.
Allow me to give you a snapshot of how this plays out…
First up, take your chart and mark some support and resistance levels.
One word of advice here – just stick to the levels nearest to the current price.
Avoid the temptation to litter your chart with a jumble of levels – it will just turn into a maze, leaving you scratching your head trying to decipher what’s going down.
Keep it simple.
Just highlight a couple of levels above and below the current price and then keep a close watch on them.
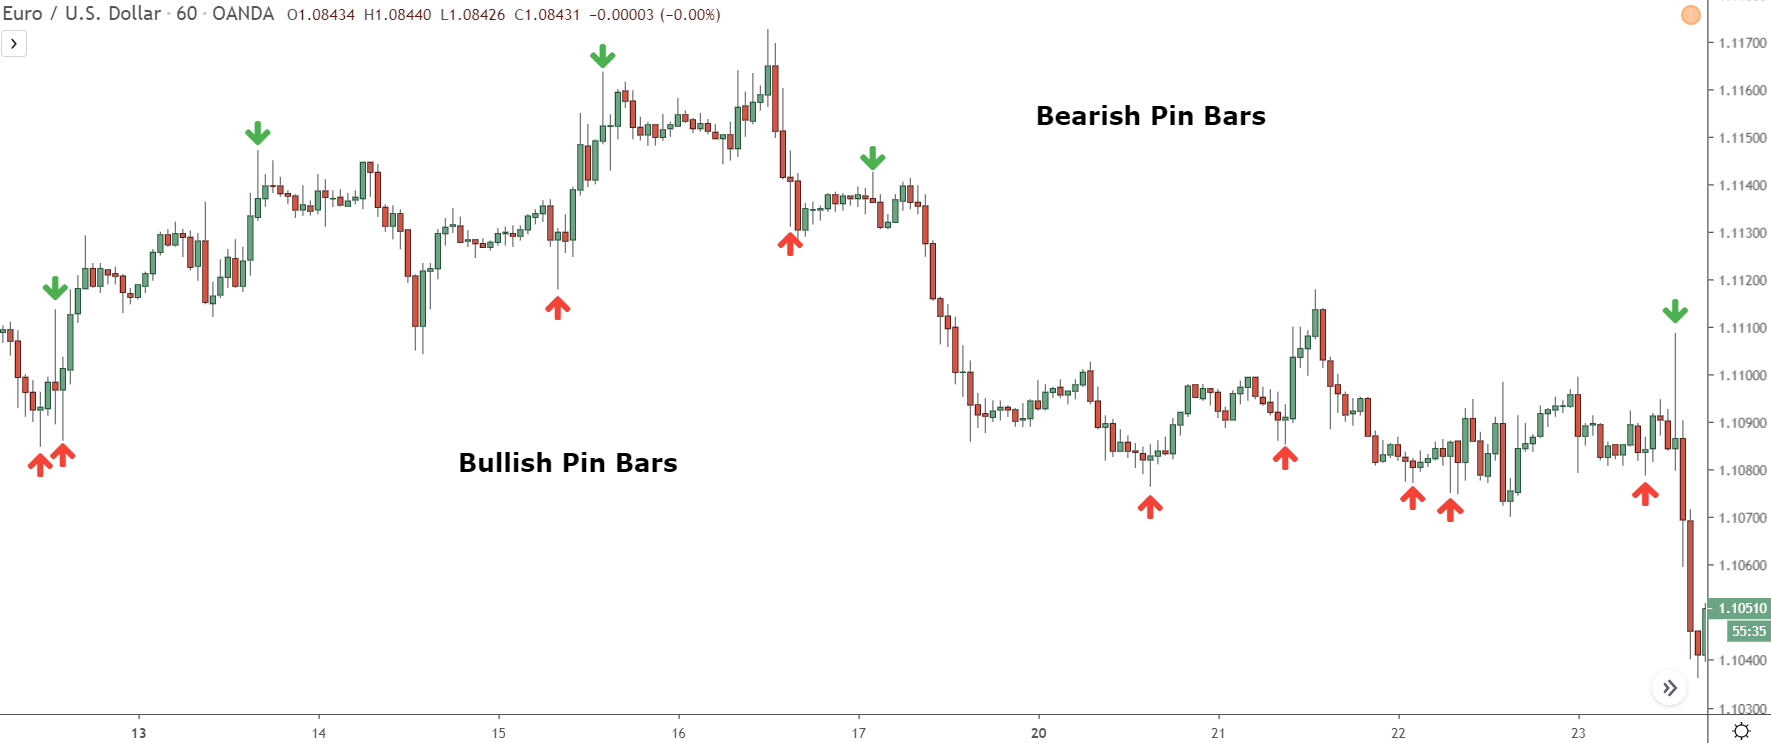
Hang tight and keep your eyes peeled for a pin bar forming at one of those levels.
Bear in mind, pin bars come in a couple of flavors: bullish and bearish. The one you’re hunting for hinges on whether you’re keeping tabs on a support level or a resistance level.
- Support level – watch for bullish pin bars.
- Resistance level – watch for bearish pin bars.
When the price makes its way back to a level, and you spot a pin bar, it’s time to dive in. Enter a trade and position your stop loss either above or below the wick.
Aim below for bullish pins, and aim above for bearish ones.
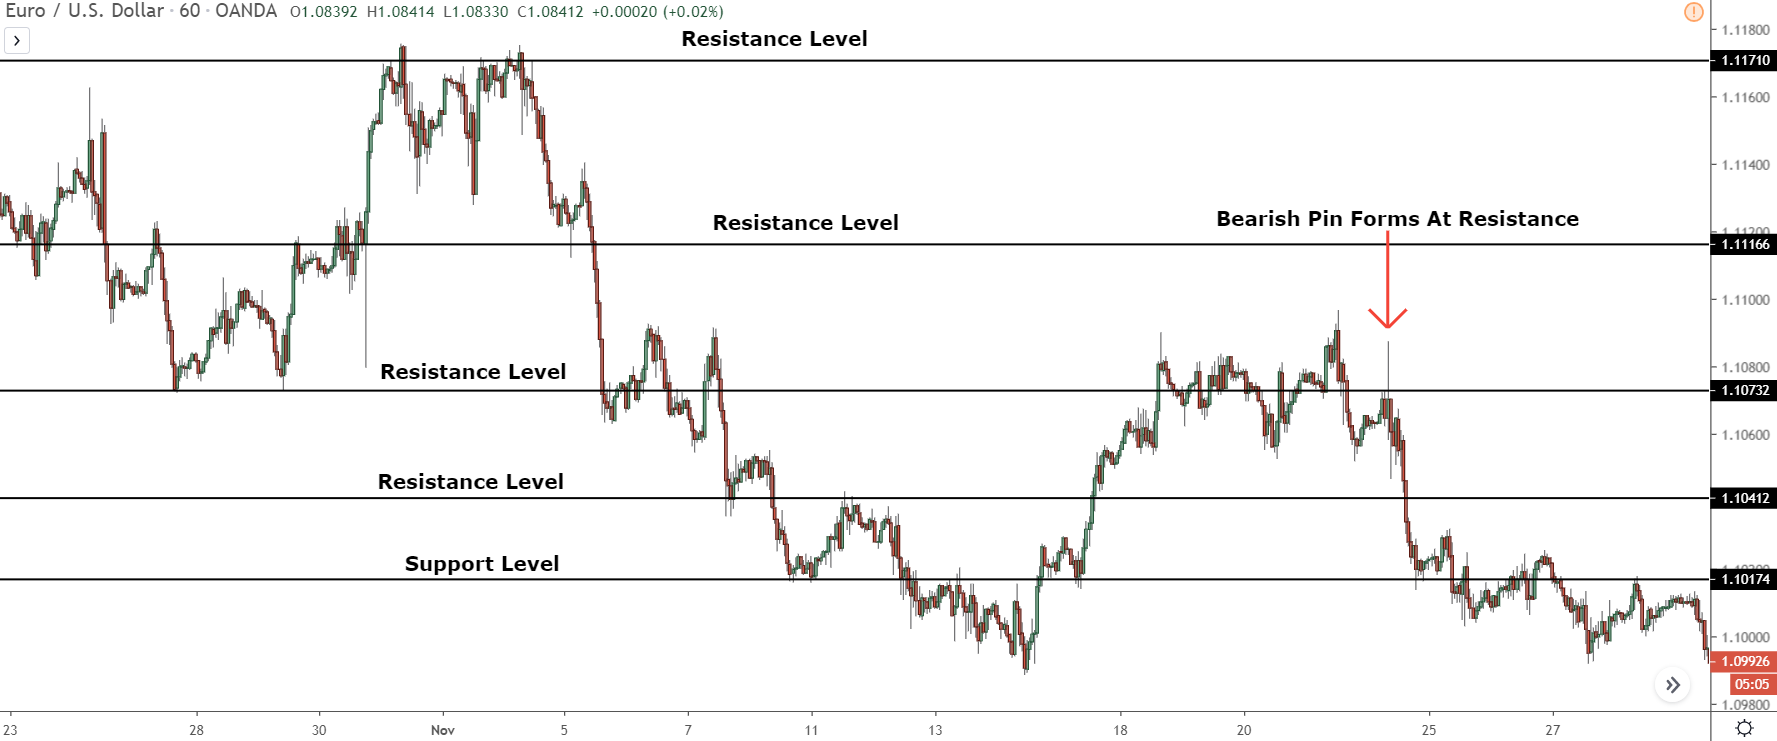
If all the stars align…
Price should reverse and start moving away from the level, just like it’s done here.
Piece of cake, right?
Finding Confluence With S & R
Let’s delve into the concept of confluence, shall we?
It’s primarily how I use support and resistance, and let me tell you, it’s pretty powerful.
So, what’s confluence exactly?
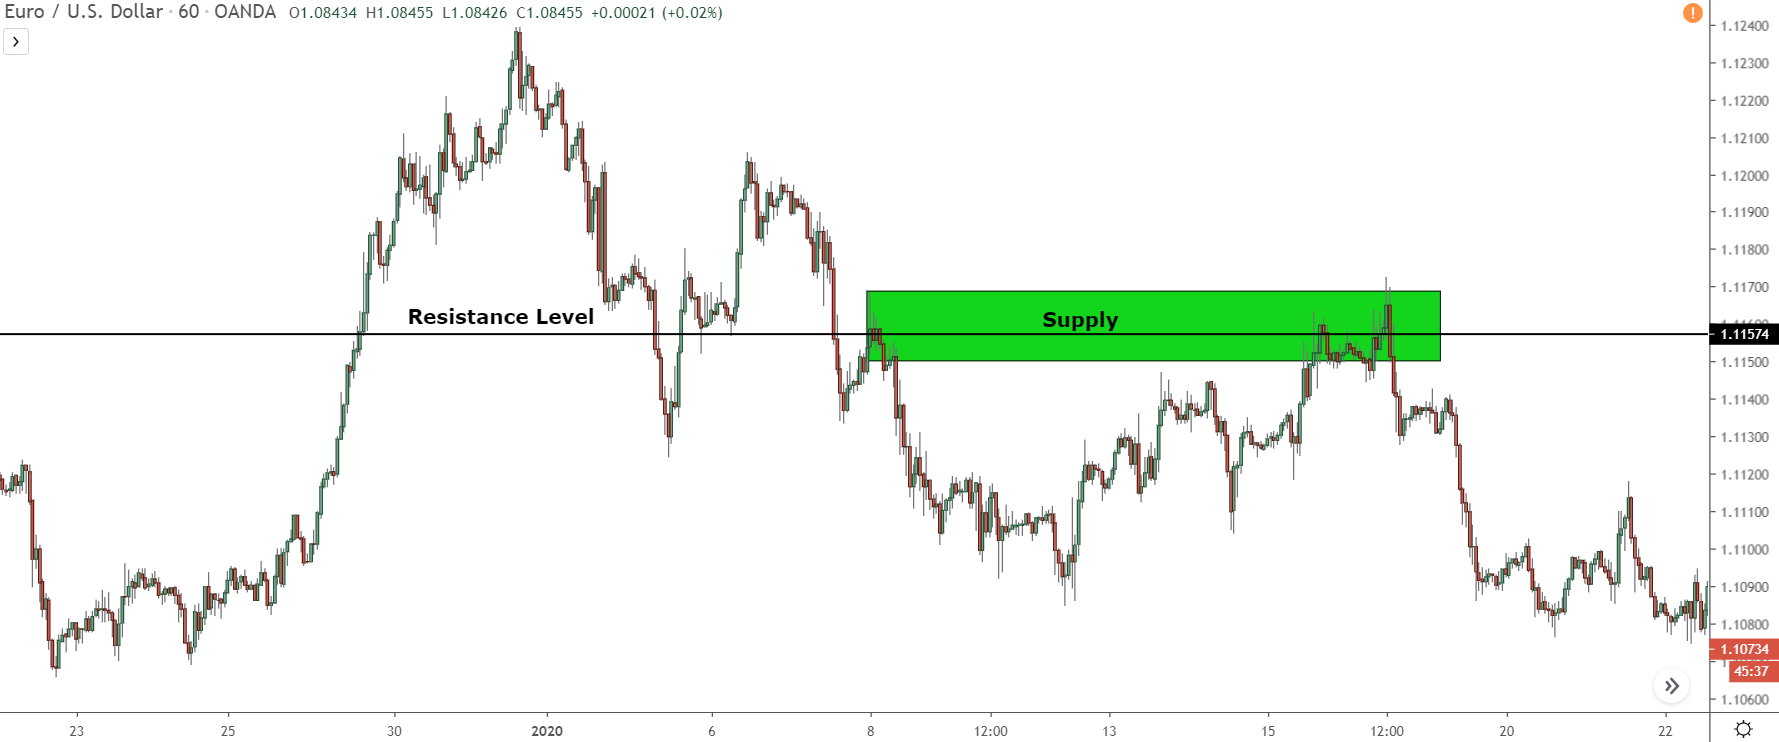
Imagine two or more points of interest aligning at the same spot. Think of a support level existing inside a demand zone, or a resistance level neatly coinciding with a Fibonacci retracement.
Why does this matter?
Well, if both points are signalling a potential reversal, their coming together at the same spot gives us a higher probability of that reversal actually happening.
In Short:
So, how do we find confluence?
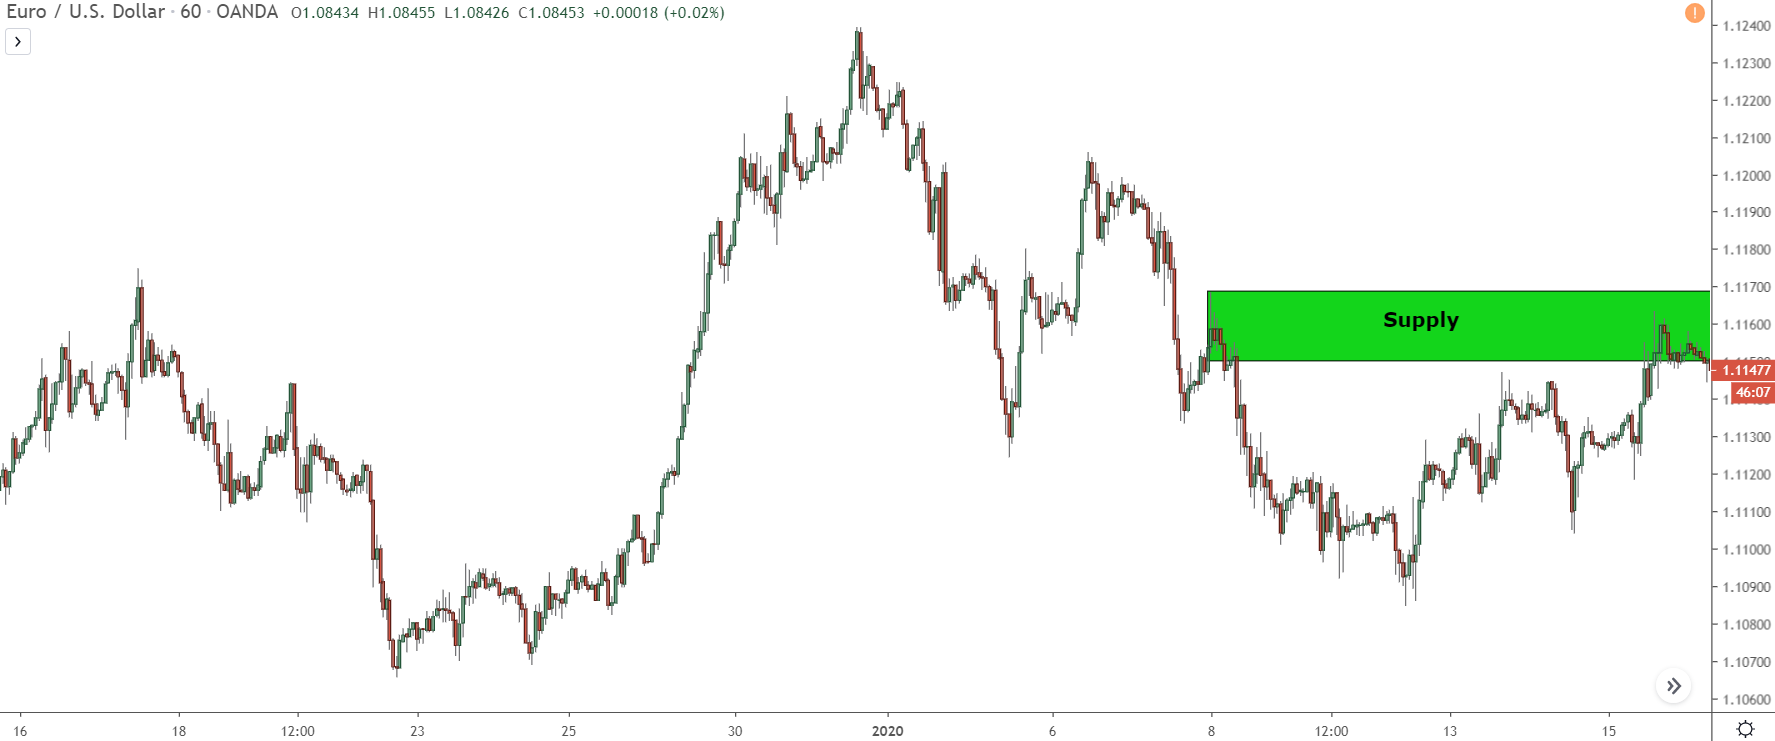
Start by pinpointing a spot where you reckon a reversal might kick in.
Then, check if a support or resistance level exists at that same point.
In our scenario, we’re looking inside the demand zone.
When a level forms within this zone (a zone that already suggests a high probability of a price reversing), it’s like the market is shouting, “Hey, price is really likely to reverse here!” And as we can see, the price did indeed reverse.
It’s pretty neat when things line up like that, isn’t it?
Part 4: FAQ And Summary
Before we close this off, here are a few of the most common questions I receive about using support and resistance levels as well as my answers to them.
Q. “Hey, how far back should I be going when marking these levels?”
A. Only go back as far as the times I mentioned earlier.
Old support and resistance levels, particularly where the initial three reversals predate the times I referred to, are less likely to cause a price reversal. Why? Simply because these lack recent reversals. This suggests that banks haven’t been using these levels lately.
Therefore, it’s unlikely that there are orders stacking up around them, making them less appealing to banks.
Q. “So, how does support morph into resistance and vice versa?”
A. The minute the price punches through a level, it transforms into a level of the opposite kind.
So, imagine price breaks a support level. Boom! It’s now a resistance level. And if price makes another breakthrough, whether it’s a day, a week, or a year later, it morphs back into a support level.
Q. “Do levels from higher timeframes work better than those from lower ones?”
A. Yes, they absolutely do.
The higher up the timeframe ladder you go, the greater the profit expectations of the bank traders using that timeframe. More money is needed to cause a price reversal. For example, reversing price from a 4-hour support level takes much more cash than from a 5-minute support level.
Pro-tip: Always mark the levels two timeframes higher on the timeframe you’re trading off. This way, you can easily spot potential key turning points.
Q. “How do I gauge the strength of a support or resistance level?”
A. Two ways to do this:
Seek out higher timeframe levels (as I explained above), or look for levels ending in big round numbers, like those ending in 00, 000, or 0000. A ton of orders tend to cluster around these big round number levels, giving price a higher chance of reversing.
Lots of orders bunch up around big round number levels, way more so than normal S & R levels, so price has a much higher probability of reversing from them – if you look at a chart, you’ll see most market-changing reversals actually begin once price touches or is close to round numbers ending in 0000.
Q. “What are these support and resistance zones I keep hearing about?”
A. Support and resistance zones are essentially a different approach to drawing the levels.
It’s a nifty technique that’s gained popularity lately, as it tends to work better than drawing levels as lines. This is because the zone method considers a broader area, making it easier to jump on reversals.
By the way, I’ve got a post explaining how to use support and resistance zones. But, a little heads-up, you’ll need to upgrade to VIP membership for access.
Enjoy trading!
Summary
And that’s how to use support and resistance levels. They might not be the most talked-about technique nowadays – certainly not compared to something like supply and demand – but they are still very useful, and you’d be wise to start watching and using the levels in your trading.
Hi. Liam
Where should I take my profit? the next support resistance lvl? or the next supply demand zone on the higher time frame?
Thx
The next supply zone on the higher timeframe, Marvin.
Using support and resistance for take profit levels doesn’t tend to work that well, as the levels aren’t always points where the banks have placed trades. Supply and demand zones, on the other hand, almost always form from the banks either taking profits or placing trades, making them much more likely to cause a reversal and a better point to take profits off.
Hope this helps,
Liam.