
Today, I’m going to give you a complete breakdown on how to trade one of the only chart patterns worth paying attention to in forex…
Yes, I’m talking about the double bottom pattern.
Along with it’s brother (the double top), the double bottom is a reversal pattern that forms often in forex. Created from price making two almost equal bottoms, it usually signals a reversal of the current trend or movement, but can also indicate the start of a large retracement – depending on where it forms.
The double bottom can get you into some major reversal trades, and in this guide, I’m going to teach you EXACTLY how to use it.
Here’s what we’ll cover….
- What is the double bottom pattern?
- The psychology behind why it forms in the market.
- A 3 step guide to trading the pattern.
- The two entry methods you can use (and which ones better).
- 3 key facts to remember when trading the double bottom.
By the end, you should have no problems knowing exactly what the double bottom is, why it forms, and how use it in your own trading.
Ready to get started?
Lets take a look…
Breaking Down The Double Bottom Pattern
The double bottom, along with its twin brother (the double top), is one of the most common chart patterns in all of forex.
A staple of technical analysis for decades now, the pattern signals the beginning of a trend reversal – or large retracement in some cases – as it shows the market has found support and buying has come in, suggesting the big traders (banks, hedge funds, etc) want price to reverse and the trend to change.
More on how this happens in a minute.
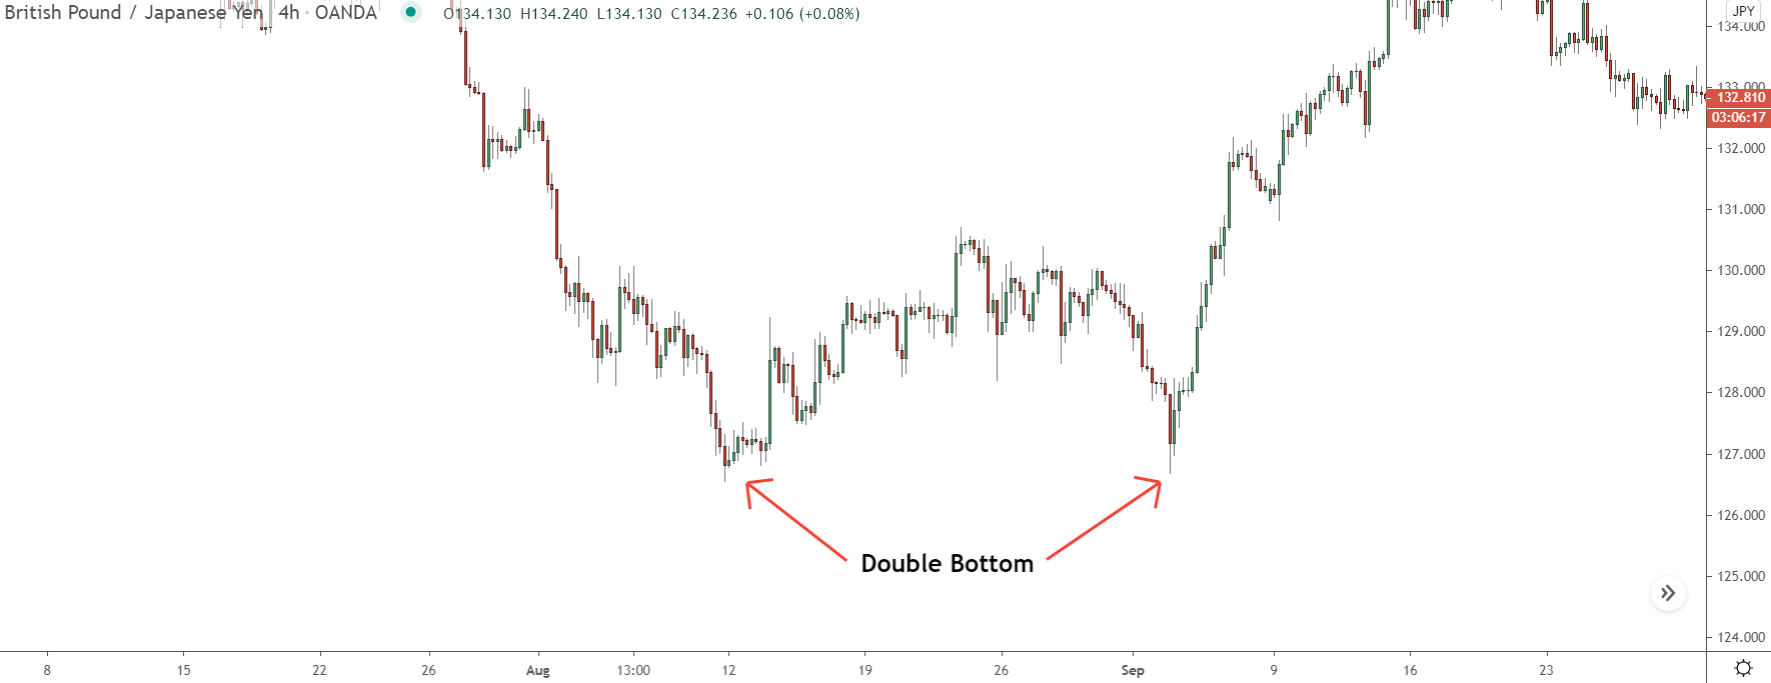
As you can probably guess, the double bottom gets its name from the way it forms: from price making two bottoms (swing lows) at roughly the same price.
Here’s how it forms:
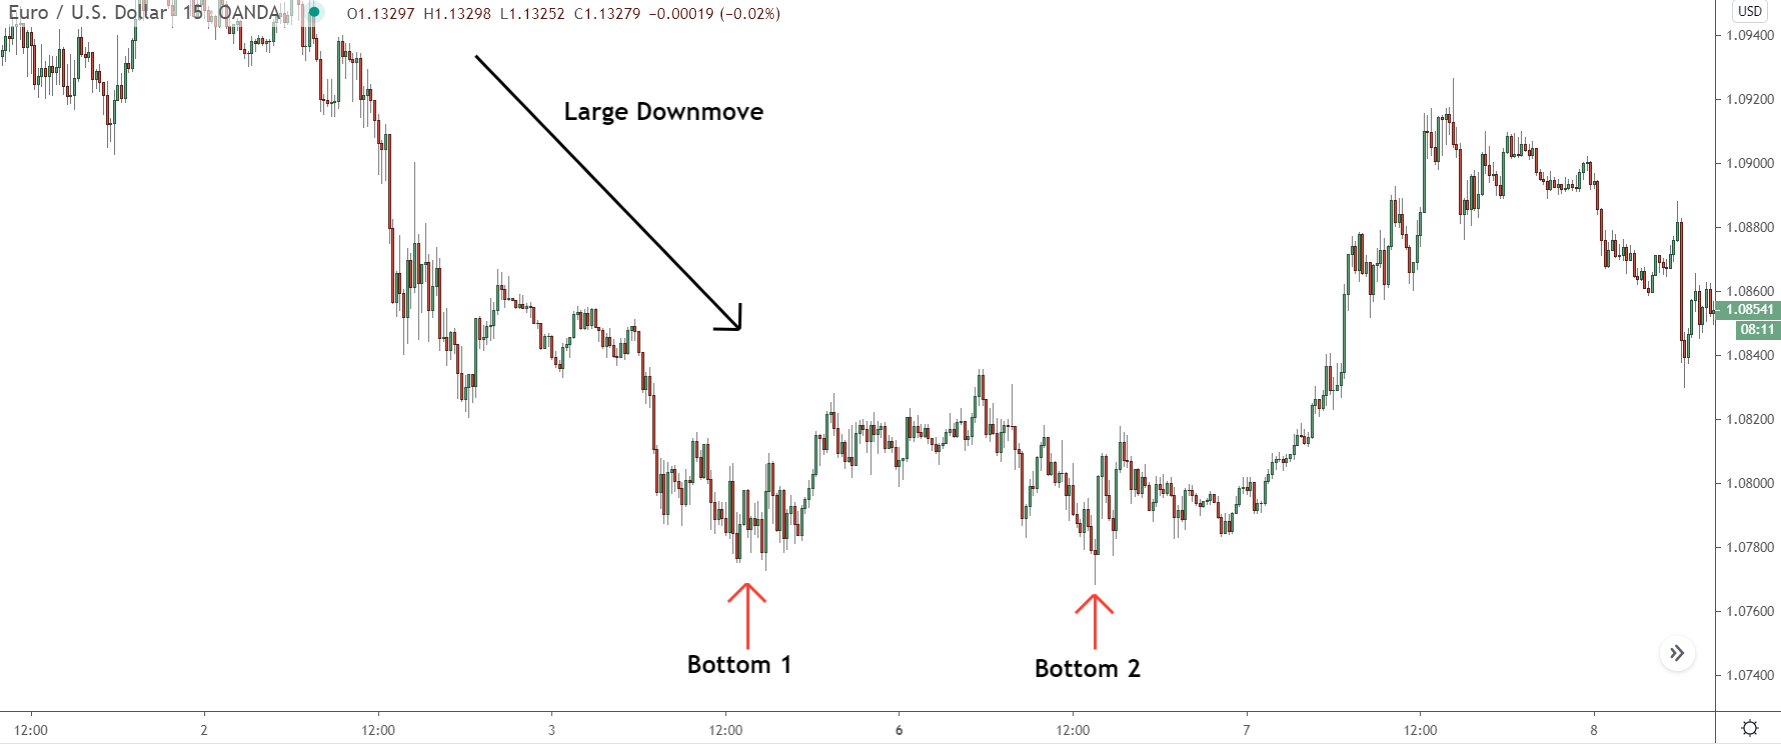
During a downtrend or large downmove, price finds support, then reverses and begins rising. That creates the first bottom. After a small reversal, price falls back to roughly the same price as the first bottom, where it reverses again (bottom 2) and initiates the start of a new trend – or large counter-trend movement.
The reversal is confirmed once price breaks and closes above the neckline, which is the resistance turned support level created from price making the lows. See below…
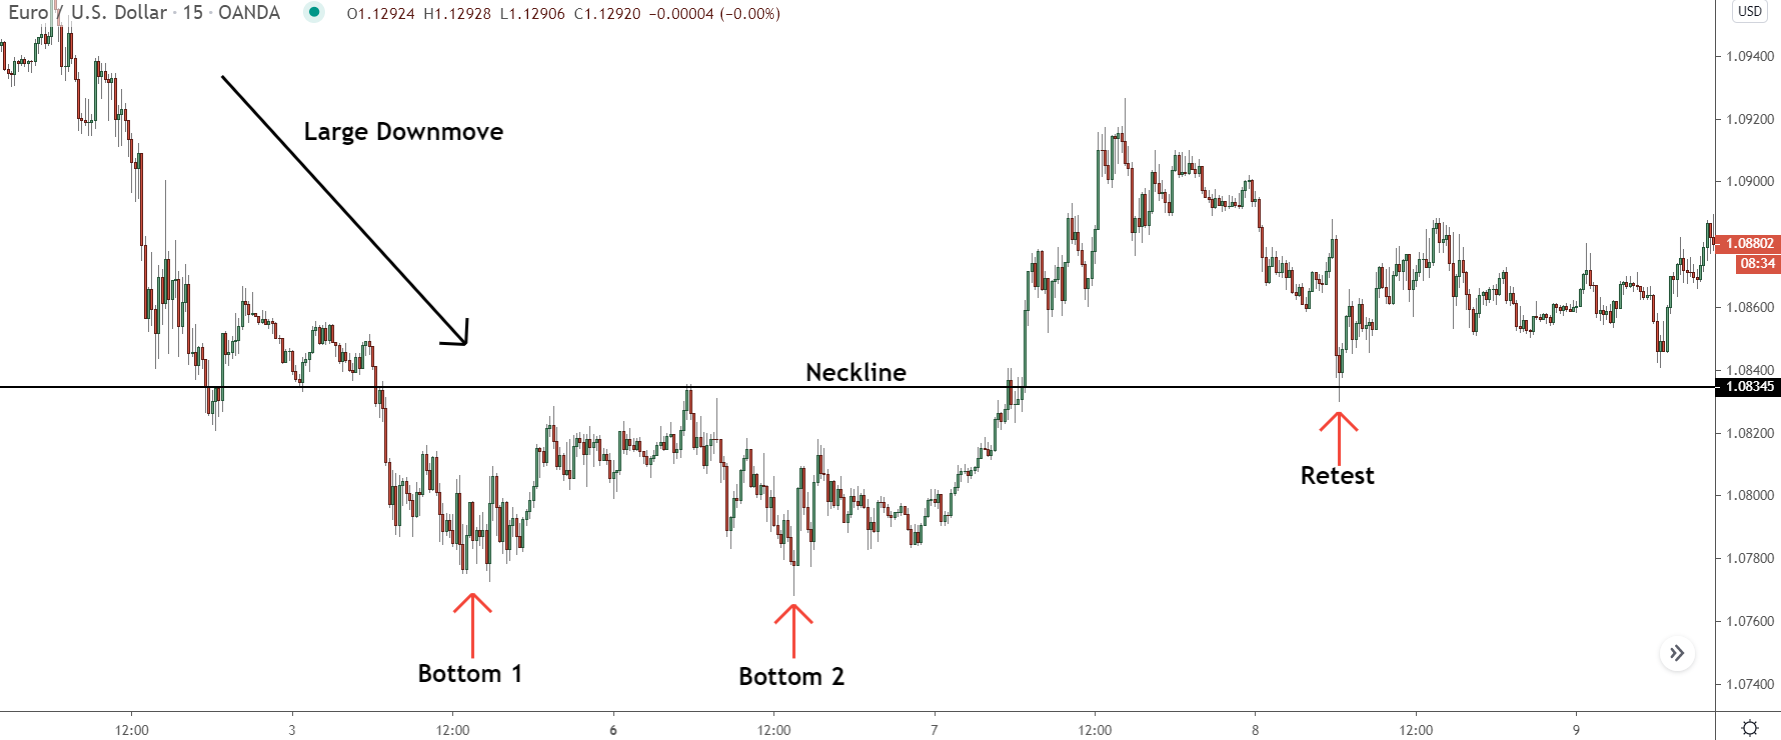
Sometimes this line will be horizontal, and other times it’ll be angled, like a trend-line. Either way, it doesn’t matter. You must wait for price to close above (preferably in a strong fashion e.g via a sharp rise) to confirm the reversal is underway.
A key point to remember before we move on…
The two lows that created the double bottom don’t need to form at the same price. One can be slightly higher/lower than the other and vice versa. I’ve seen some guru’s – and books actually – say a pattern with a bottom that peaks below the 1st bottom isn’t a real double bottom, which isn’t true.
So long as the bottom is close to the low, the pattern is valid. It’s only when the second bottom is way beyond the first that it’s not a double bottom, and more likely, just another lower low in the trend.
Keep this in mind when you start trading the pattern, which I’ll show you later.
What Causes The Double Bottom To Form, And Why It Signals A Reversal
I’ve always said, if you want to get good at forex, you need to start thinking about the why more than the what. And this especially true for chart patterns…
Anyone can look at a chart and find a pattern, that’s easy!
But few can explain why a pattern has appeared. And that’s the most important thing to know. Chart Patterns don’t form out of thin air; they’re created via buying and selling. The question is, who’s behind the buying and selling? Who would buy when a huge downtrend is underway with everyone selling?
And the answer is… the banks.
The banks and other big traders in forex cause double bottoms to form, not normal retail traders like you and me – which is what many books and guru’s say.
They’re the only ones who have pockets deep enough to reverse a downtrend – or up-trend in the case of double tops. Us retail traders don’t have anywhere near the money to reverse a trend, not with our puny little accounts. Even if we all coordinated our buying, we wouldn’t have enough… price would still continue to drop like a rock.
So, why and how do the banks cause double bottoms to form?
Well, here’s the psychology behind it:
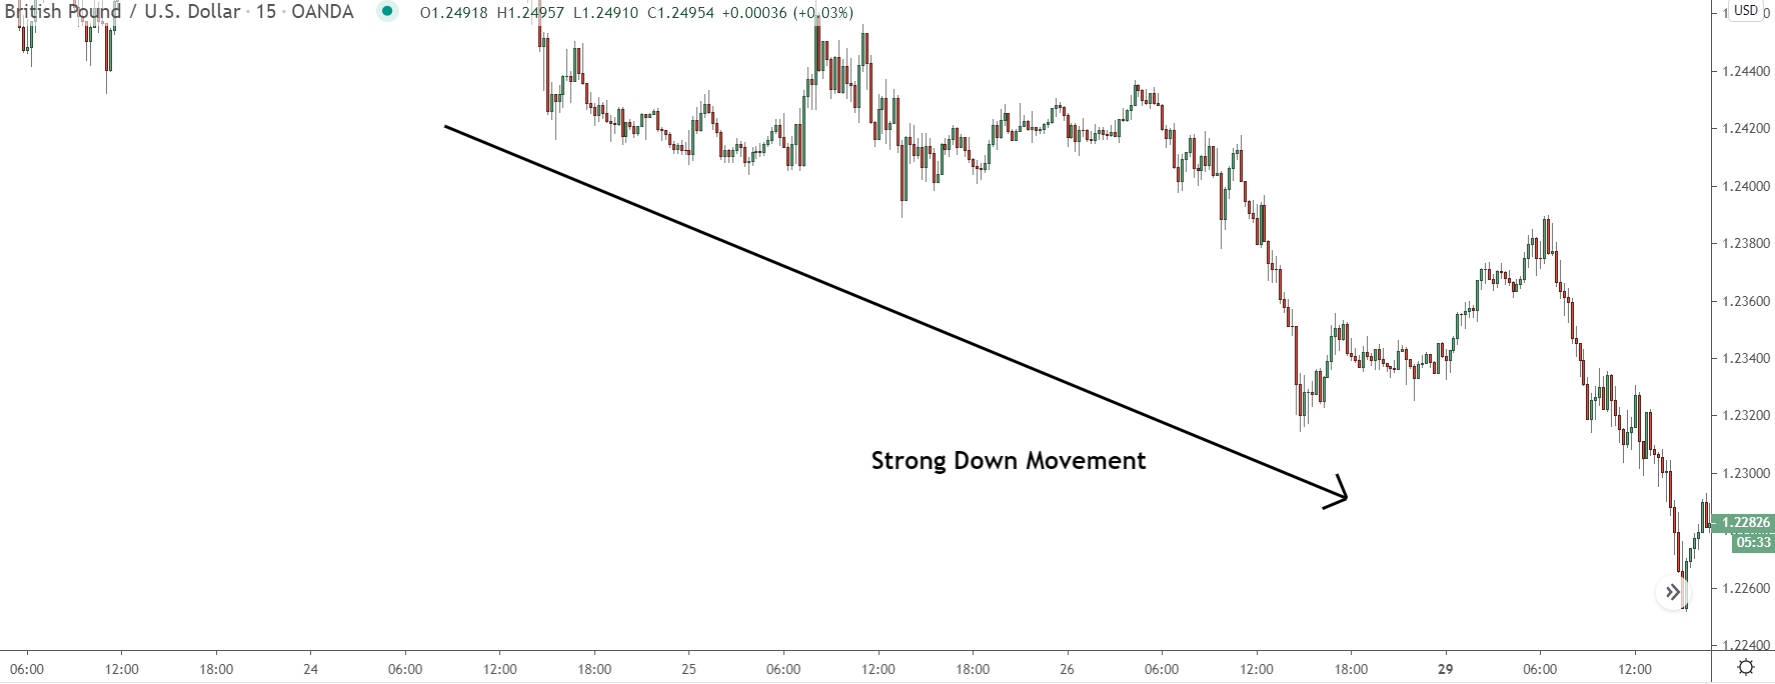
First, we have a downtrend or strong down movement, so most traders are currently selling.
The banks decide to reverse the market, either completely i.e trend reversal or partially via large retracement, to re-set traders’ expectations about the future. The banks can’t make money when everyone trades in the same direction. Forex is a zero-sum game, which means traders must lose for others to win.
When most traders trade in the same direction, such as in a long downtrend, the banks can’t make money because no-one is losing; everyone is profiting from the trend.
So they have to either reverse the market and create a new trend or set off a large counter-trend movement to shake traders out and get them to trade in the other direction. That gives them the ability to take the market south again, later on, causing the traders to lose and making themselves a large profit.
Now in the case of the double bottom, price reverses because the banks buy into all traders selling because of the downtrend.
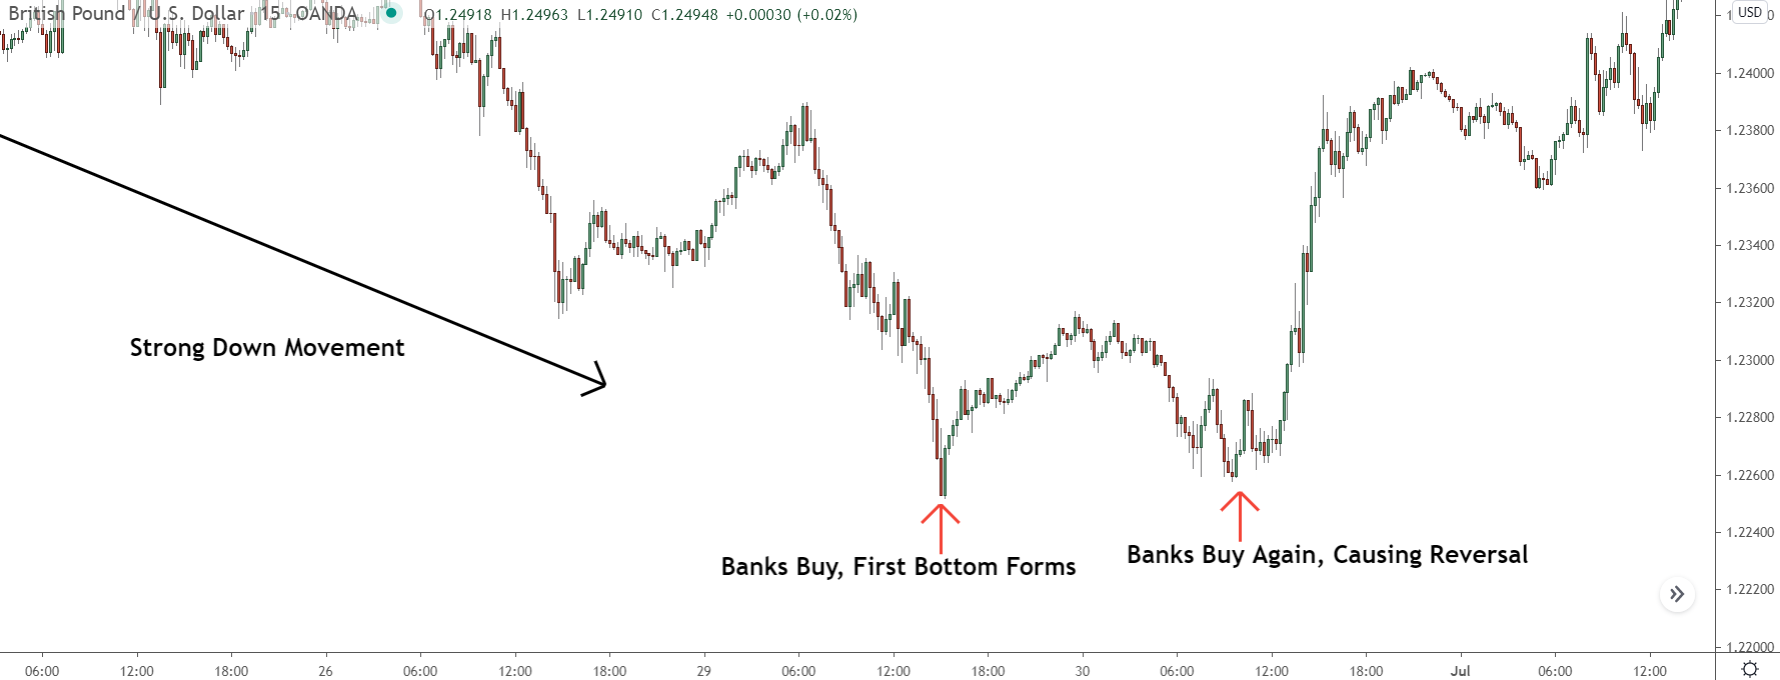
When the banks buy, price reverses and causes many of the short traders to close their trades, resulting in an up-move. This is how the first bottom forms. Since this move isn’t that strong – as many traders view it as a retracement to the trend – and the banks still have trades left to place, they take a small bit of profit to make price fall.
That causes many more traders to pile in again, as they think the trend is resuming.
But this isn’t the case. Once price comes back to the source of the first bottom – which is where the banks placed their first set of buy trades – they place their second set, causing price to reverse yet again.
As price rises, the short traders, many of whom held on for the initial reversal, close their trades at a loss. That pushes price even higher – as you close a short trade by buying back what you sold – and ultimately leads to the trend reversal we see.
And that’s how the banks cause the double bottom to form – pretty interesting, right?
Now let me show you how to trade the pattern…
How To Trade The Double Bottom Pattern Strategy
The double bottom is one of the easiest chart patterns to trade, which makes it perfect for beginners or anyone who wants to quickly add another profitable set up to their overall trading strategy.
To trade the pattern, you follow three simple steps:
1. Wait for the pattern to form.
2. Enter a trade once the pattern is confirmed.
3. Take profits as price moves in your favour.
It’s easy enough, but there are few little things within each step you need to know to trade the pattern the right way. There are two different ways to enter too, which you also need to know.
Let’s jump and take a look at each step in more detail…
Step 1: Wait For A Double Bottom To Form
While the double bottom is one of the more common chart patterns out there, you won’t find them forming every day – it is a trend reversal pattern after-all.
So, don’t expect it to replace your existing strategy.
Use it as an additional set up to look for alongside your main strategy. That’s how I treat it in my trading. My core strategy – supply and demand – gives me most of my trades, and then my setups – chart patterns, candle patterns, etc – provide me with rarer trades that allow me to make additional profits.
Keep in mind, too – double bottoms don’t always form at the end of trends.
Sometimes, in rare circumstances, they form mid trend and signal the beginning of a large retracement. These patterns look identical to the trend reversal pattern, and you trade them in the same way – more on this in a minute.
For our example then, we’re going to use this double bottom on Eur/Usd.
I found a few examples, but I thought I’d go with this one since it has nice clean swing structure – little to no spikes on the swings – and resulted in a decent reversal.
Step 2: Enter A Trade Once…
One of the unique things about the double bottom (and double tops too), is unlike most other chart patterns, you can trade them in two different ways:
You can either trade the breakout of the neckline or the retest.
Both methods get you in at a decent price, and the stop location is the same for both. For my money, however, the retest is the better entry, and I’ll explain why in a minute.
First, here’s how to trade the breakout entry…
Breakout Entry
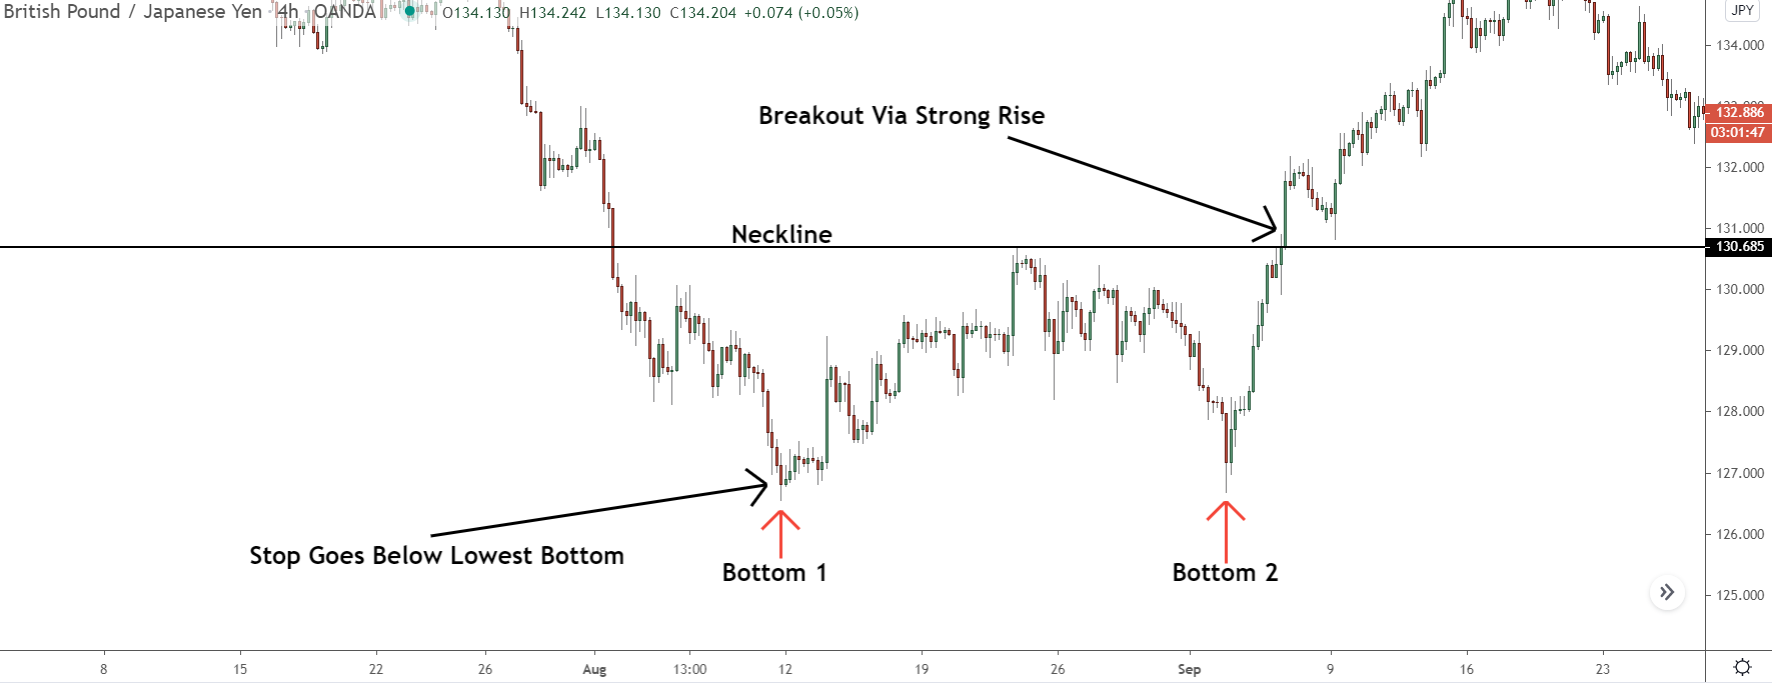
So, with the breakout entry, you enter long once price breaks AND CLOSES above the neckline – which may or may not be horizontal like you see in the image above.
Any candle will do for the entry… so long as it closes ABOVE, that’s all the counts.
The stop location is above the low of the lowest bottom – bottom 1 in our case. Being so far away from the entry is annoying, which is partly why I recommend the retest entry. However, in most cases, you can bring this up to the 50% level of the swing once the break has been confirmed.
One little tip for this method…
Only enter once you see a big bull candle or sharp rise after price has closed above the neckline.
By the time price has reached the neckline, a large part of the swing is over, which means a retracement is likely to begin. Usually, this’ll come after price breaks above the neckline (setting up a retest entry), but sometimes it’ll take place before – causing your trade to enter drawdown if you get in.
By waiting for a big bull candle or sharp rise to push price above the neckline, you can avoid this – it confirms price is heading higher for a while, making the entry a lot safer.
Speaking of safety…
Retest Entry
The safer way of trading the double bottom, and my preferred way of trading the pattern, is by using the retest entry.
This has you enter on the retest of the broken neckline – similar to a normal retracement entry – that often happens after the pattern is confirmed and price breaks above.
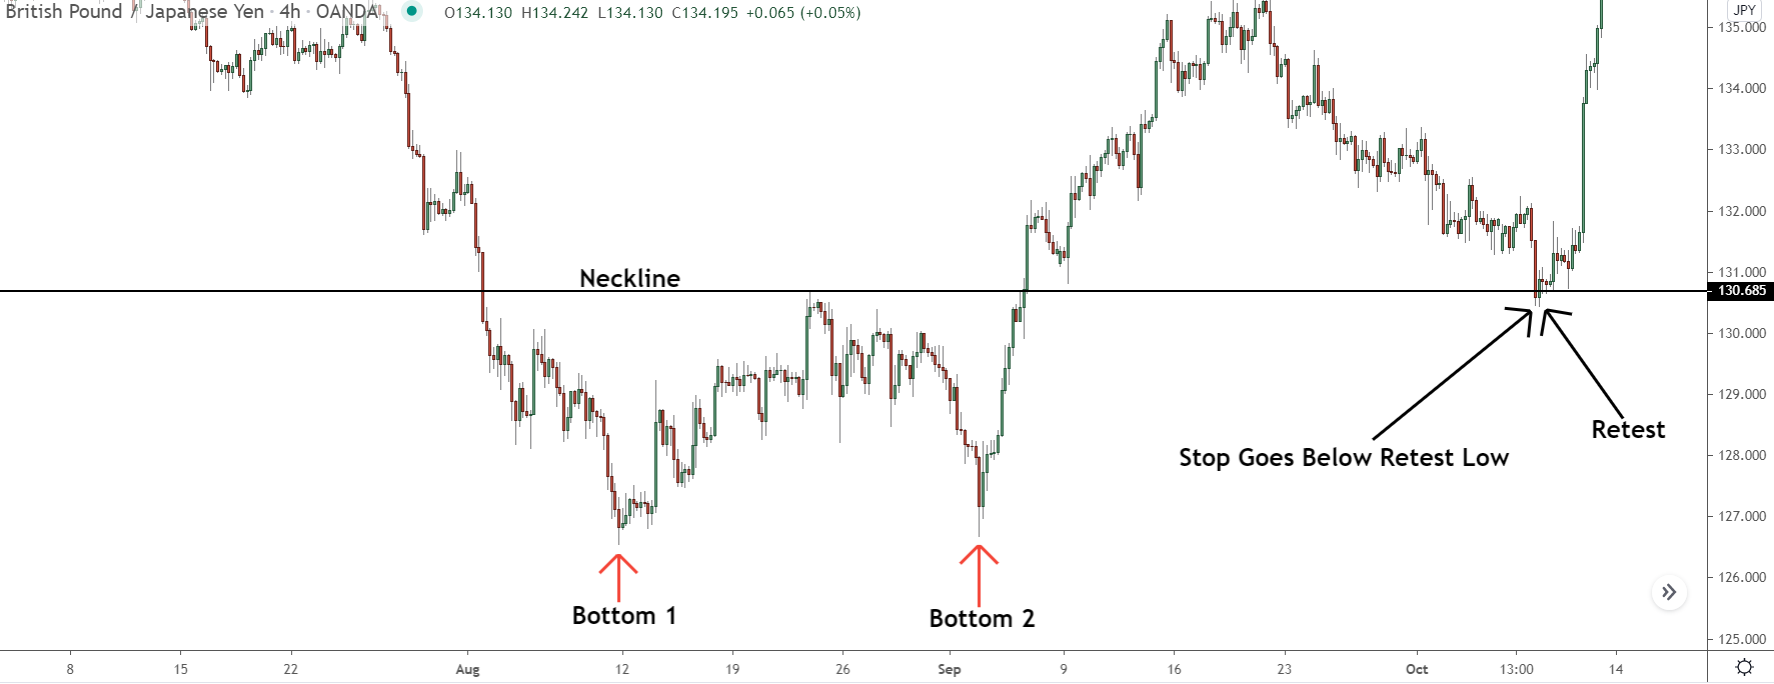
For the entry, you must wait for price to return to the neckline after the breakout.
Then you need to wait for a signal price is going to reverse and head higher again.
In my experience, the two signals that perform best are a sharp rise away from the neckline – so two or three consecutive big bull candles forming – or a large bullish engulfing candle. Both provide good confirmation price is set to continue rising. Pin bars can work too, but they tend to be a weaker signal than the others.
Your stop goes below the low of the neckline retest (for a sharp rise away entry).
If you enter after seeing an engulf, it goes either below the low of the retest, or, below the engulf itself if that creates the lowest low of the re-test – usually, it forms after, so this won’t happen often.
Step 3: Take Profits As Price Reverses
Any method of taking profits will do when trading the double bottom. The choice is up to you. Once the reversal gets underway, and price starts to trend, it’s no different to trading a normal swing, so you can use whatever method you like.
That said, I always recommend taking partial profits at two key times during the pattern:
1. Once price reaches 50% of the swing – if you’re trading a neckline break.
2. When price has moved 150% of the initial break if trading a retest.
If you enter using a neckline break, price won’t always retrace to retest the level – the main disadvantage of using a retest entry. Since you don’t know whether that’ll happen or not, it’s important to take profits off around the point where the retracement could begin – roughly 100% of the current swing.
To figure out where that is, measure the swing using the fib tool once price reaches the neckline.
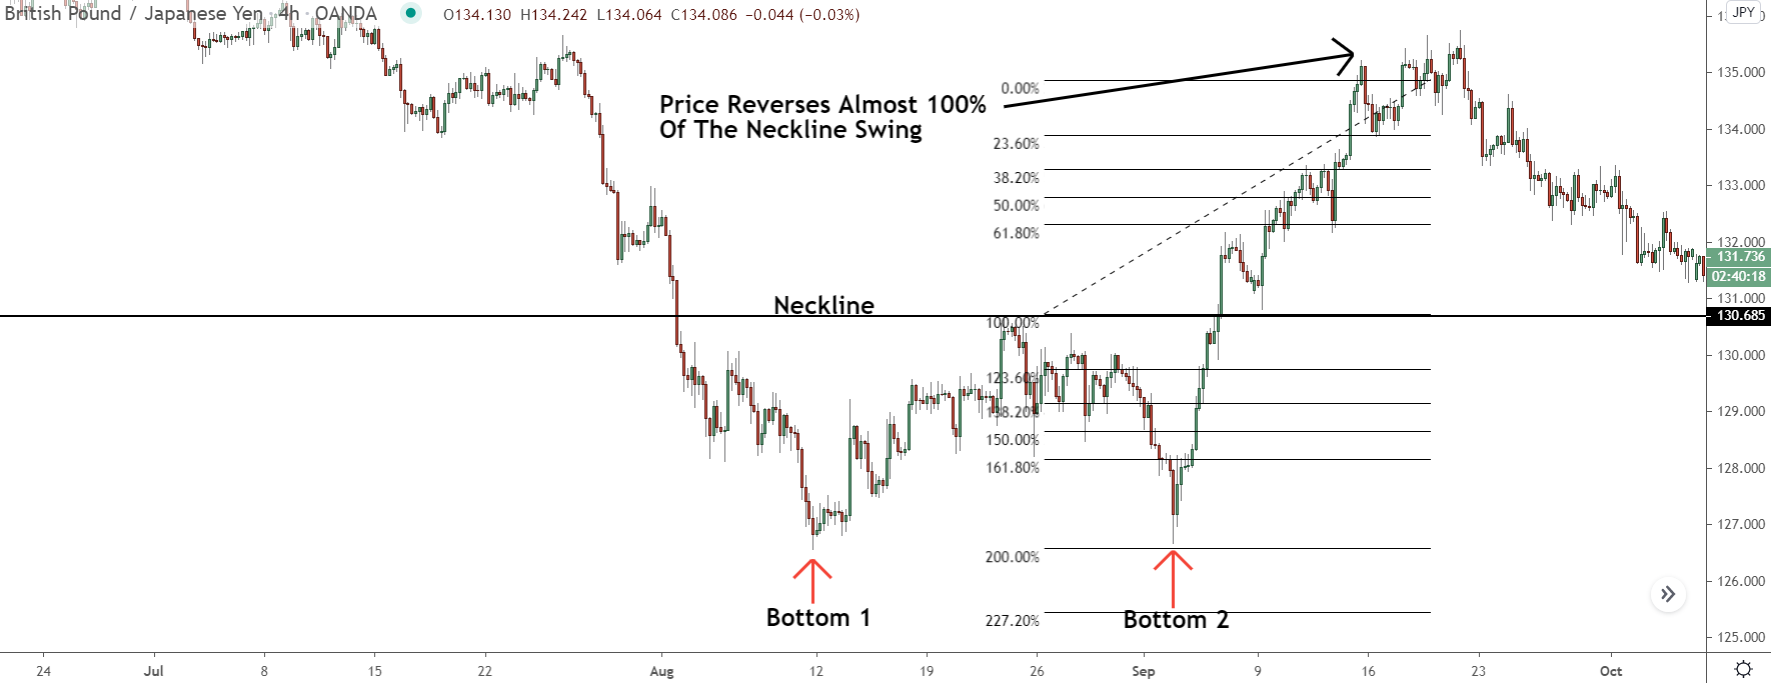
Without changing the location of the two ends of the tool, place the lower point on the breakout of the neckline and see where the upper point falls. Mark this on the chart as a line.
Now, once you see price reach this point, make sure to take some profit off.
A retracement back to the neckline has a high probability of beginning here. It wont always happen, and it won’t always make it all the way back to the neckline, but the chances of some kind counter swing movement here are high. Because by this time, the banks will want to take profits off the long trades they placed at the two bottoms.
If you enter using a retest, the other key point to take profits is when price reaches the 150% of the upswing before the retest began – the swing that causes the breakout in other words. Why take profits here?
Usually, price will retrace – or reverse in some cases – around this point.
The banks have made most of their profit by now, so they often take the market in the other direction for a while to re-set traders expectations about the future, like I explained earlier on.
Before you can find the 150% point, you need to enable the 150% retracement level on the fib tool.
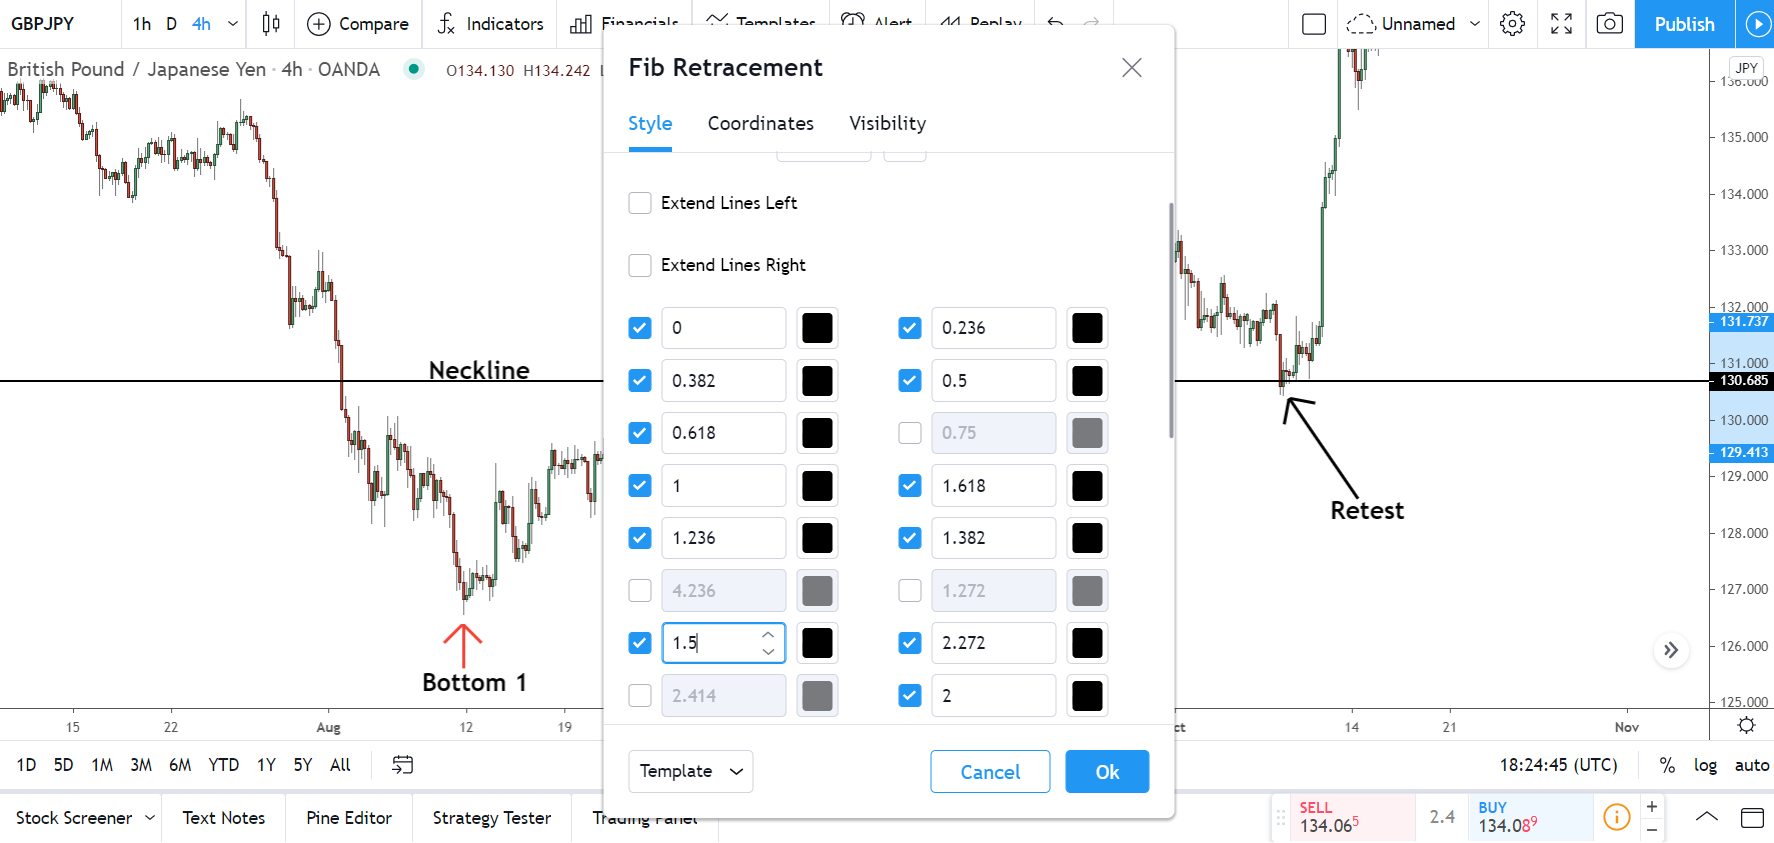
On Tradingview, this is done by opening up the fib settings menu – right click the tool and hit Settings. Then simply enable then 1.5 level inside the Style tab.
If you use MT4, things are little more difficult….
The 150% level doesn’t show by default, you have to enter it yourself using the options menu. So, open up the menu by right clicking the line and selecting Fibo Properties.
Once inside, head over to the Fibo levels tab where all the levels are located along with their respective ratios.
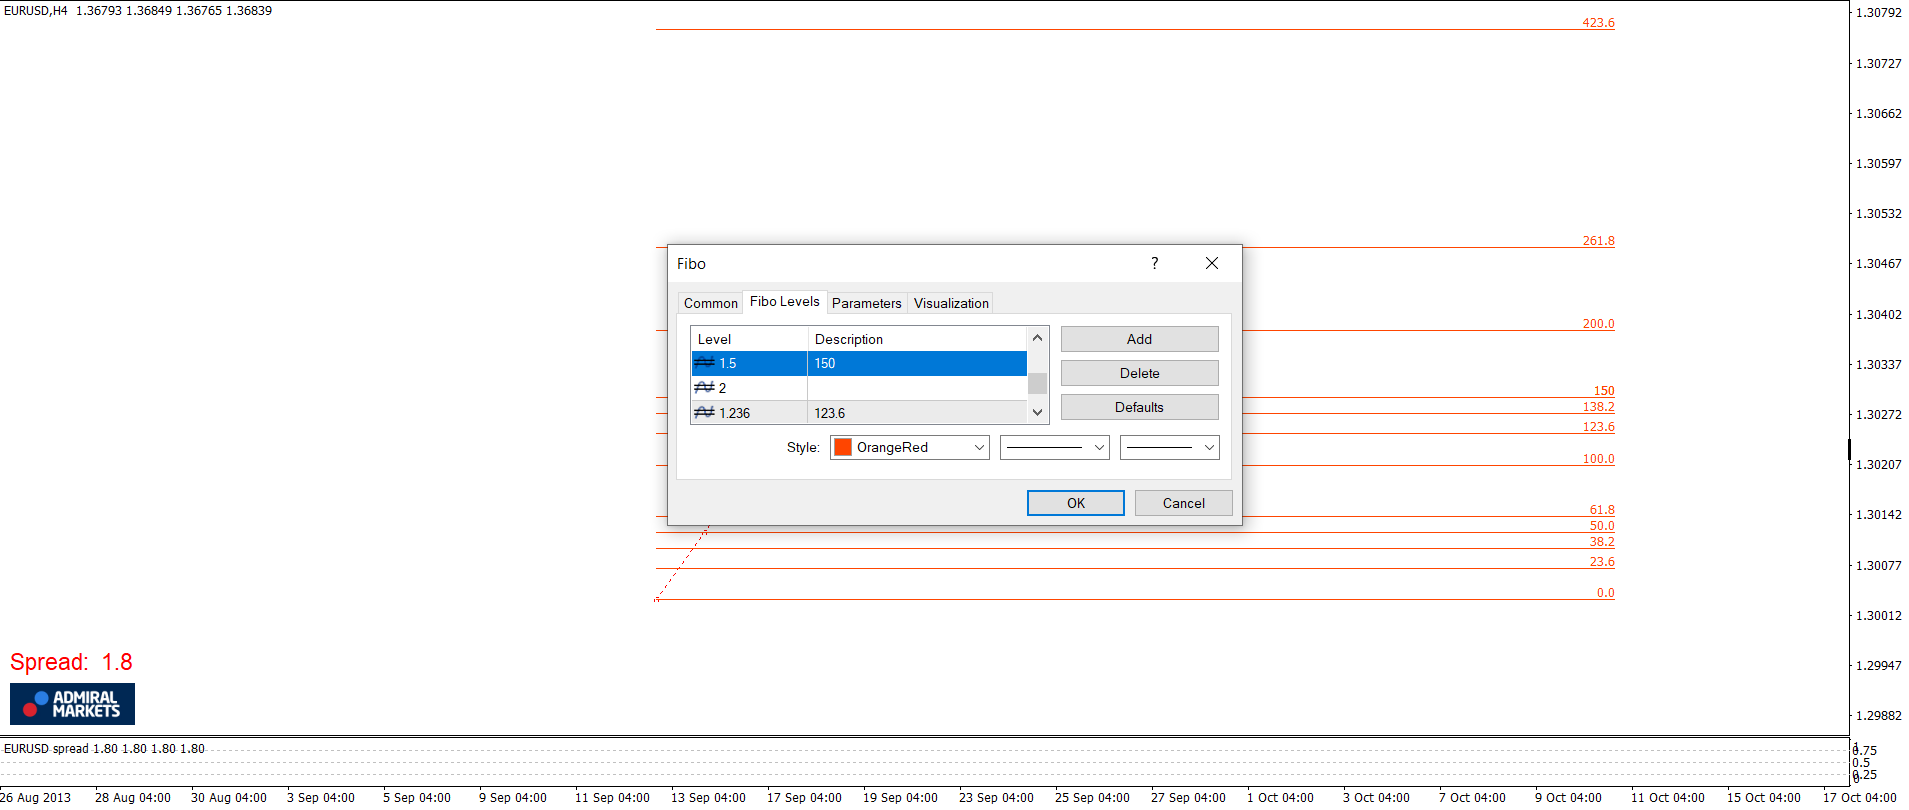
Scroll down into an empty space, then double click the left box and enter 1.5. Now click inside the box to the right, enter 150, and hit the okay button to have the settings applied.
And with that, you’re good to go.
Now all you need to do is place the fib tool on the upswing before the retest…
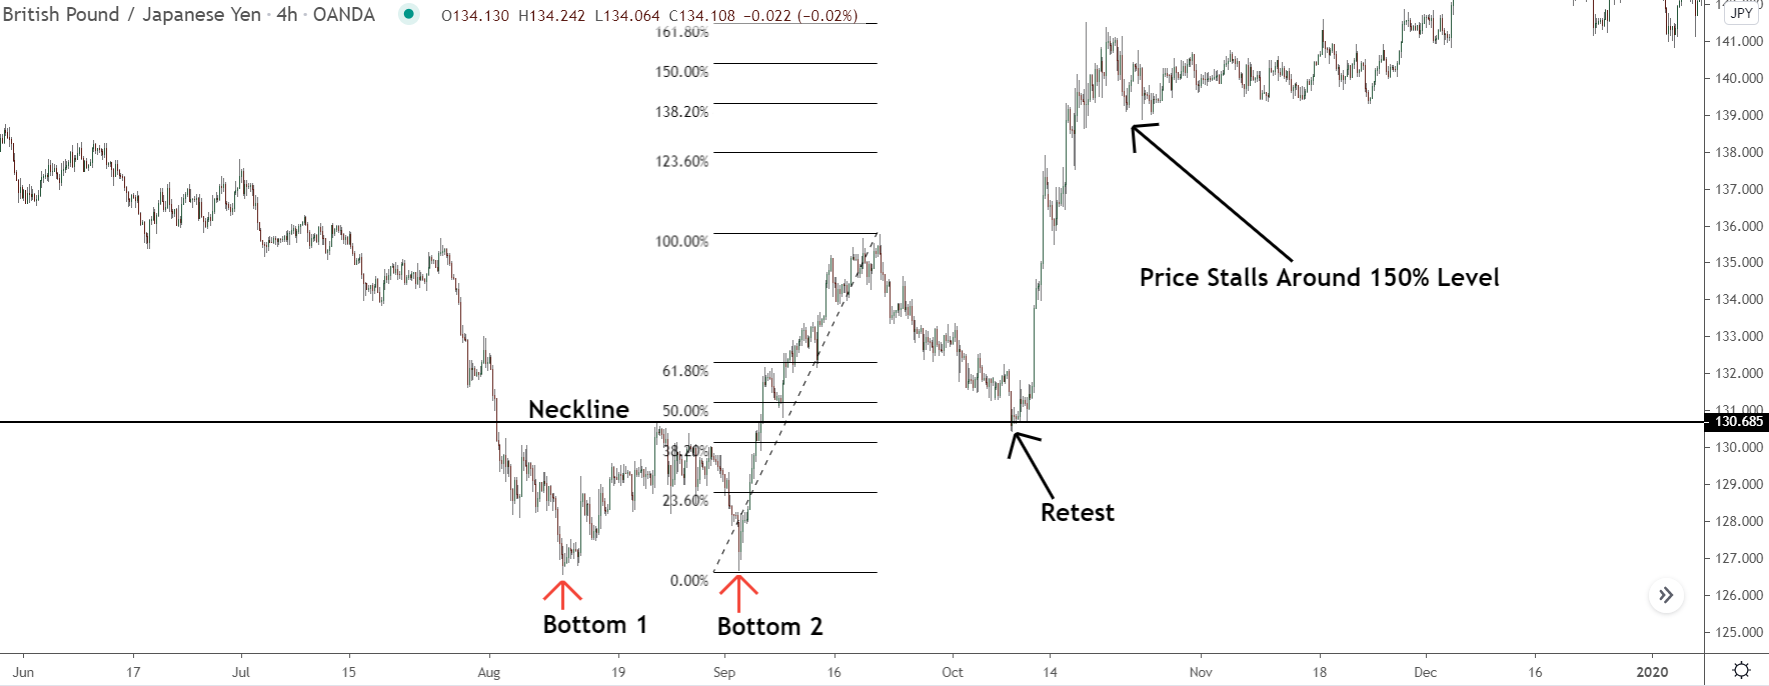
Wherever the 150% level lands, that’s the point you’ll probably see a retracement begin and need to take profits.
3 Key Facts To Remember When Trading The Double Bottom
So far, you’ve learned what the double bottom is, what it looks like on the chart, why the pattern forms in the market, and in last section, how to trade it when it appears.
You’re almost ready to go off and begin using the pattern yourself.
However, before we come to the end, there are three key points you need to remember when trading the pattern and watching for it to form…
1. A Double Bottom Can Signal A Large Retracement
Most double bottoms signal a reversal of the current downtrend, but every once in a while, a pattern will form and set off the beginning of a large retracement.
These patterns look and form in the same way, so you don’t need to change how you trade them.
That said, it’s not possible to know beforehand whether a pattern will cause a retracement or trend reversal – annoying, I know. There are, however, a couple of signs that do hint it’s more likely to be one than the other, like a pattern that forms after an especially long trend for example.
9 times out of 10, these patterns result in a trend reversal, due to most traders now being short in the trend.
Remember, the banks can only profit when the majority of traders are losing, which happens when price moves against them.
Trends, due their nature, gather pace over time – more people recognise a trend is underway, so they begin trading in the same direction in the hope of making a profit.
Eventually, all trends reach a point where the overwhelming majority of traders are all entered in the same direction. Some traders aren’t, obviously, but the majority are. With everyone trading the same way, the banks can’t make any more money because no-one will lose if price keeps falling, as most traders are short already.
It’s at this time they’ll cause a reversal, often via a double bottom forming.
So, if you see a double bottom appear after price has been in a trend for a long time – relative to that time-frame; don’t go off the daily trend if you use the 1-hour for instance – it’ll probably result in a trend reversal, not a retracement.
What about double bottoms that signal a large retracement then?
Well, these patterns usually appear after a long movement, but not a long overall trend – though they can still form during long trends, and set of a large retracement within that.
As I’ve explained before, price can’t continuously move in one direction; retracements and consolidations must break up the action to re-set traders expectations and shake them out of their trades.
Long movements made up of only minor retracements and consolidations cause traders to get comfortable in their positions and expectations about the future. They think: price has been trending for a long time, so it’s probably going to continue in the same way in the future. price moving in the same direction for a long time means it’s highly likely to continue in that direction in the future; the longer the movement, the safer they think are.
The reality, however, is just the opposite…
With so many traders entered into trades, the banks must make price either retrace or consolidation to shake them out. If they don’t do that, they won’t be to place any trades nor make any money, with forex being a zero sum game.
So double bottoms that form after a long movement with little to is usually a sjgnal a large reteacement is about to take place, not a trend reversal – though on occasion that can develop.
2. The Pattern Is Only Confirmed When Price Closes Past The Neckline
A double bottom ONLY indicates a reversal once price closes past the neckline. Some would say a retest is necessary for full confirmation, but a strong close past the neckline is technically enough.
When price closes beyond the neckline, it reveals invalidates the swings highs leading to the bottoms.
Keep in mind, all swing highs and lows form from the banks buying and selling (highs=selling, lows=buying).
When price closes past a high or low in a strong fashion, it reveals whatever the banks did to cause that high or low to form isn’t valid anymore, making it likely for price to continue in the other direction.
In the case of the double bottom, the two swing highs that lead to the lows form from the banks selling via taking profits.
However, we only know this once price breaks and closes above. Before that happens, we don’t know (for sure) whether they’ve formed from them taking profits or placing sell trades – they may have placed sell trades because they want price to fall further and continue the trend.
That’s why the pattern is only confirmed when price makes a strong close above.
At that point, we know the banks haven’t got any sell trades placed – why would they push price above the point where they sold? It doesn’t make sense for them to do that. Which means the highs must have formed from them taking profits and they want price to keep rising and reverse.
3. A Demand Zone Will Usually Form At The Neckline Break
The retest entry is the better strategy for trading the double bottom.
However, getting into a trade is often more difficult than it should be because of the fact price must retest the neckline to signal an entry. Sometimes price won’t reach the neckline before reversing, causing you to miss out on the entry and not get into the reversal.
Luckily, you’ll usually see a demand zone form around the point where the neckline breaks.
You can use this to simplify your entry and increase the chance of getting into a trade.
The thing about a zone, is it provides a much larger area for price to show a signal in. With the neckline, which is basically a support level, price must touch the level to give us a signal it’s about to reverse – which isn’t easy with all the variables and randomness at play in the forex market.
A good example of this is found below…
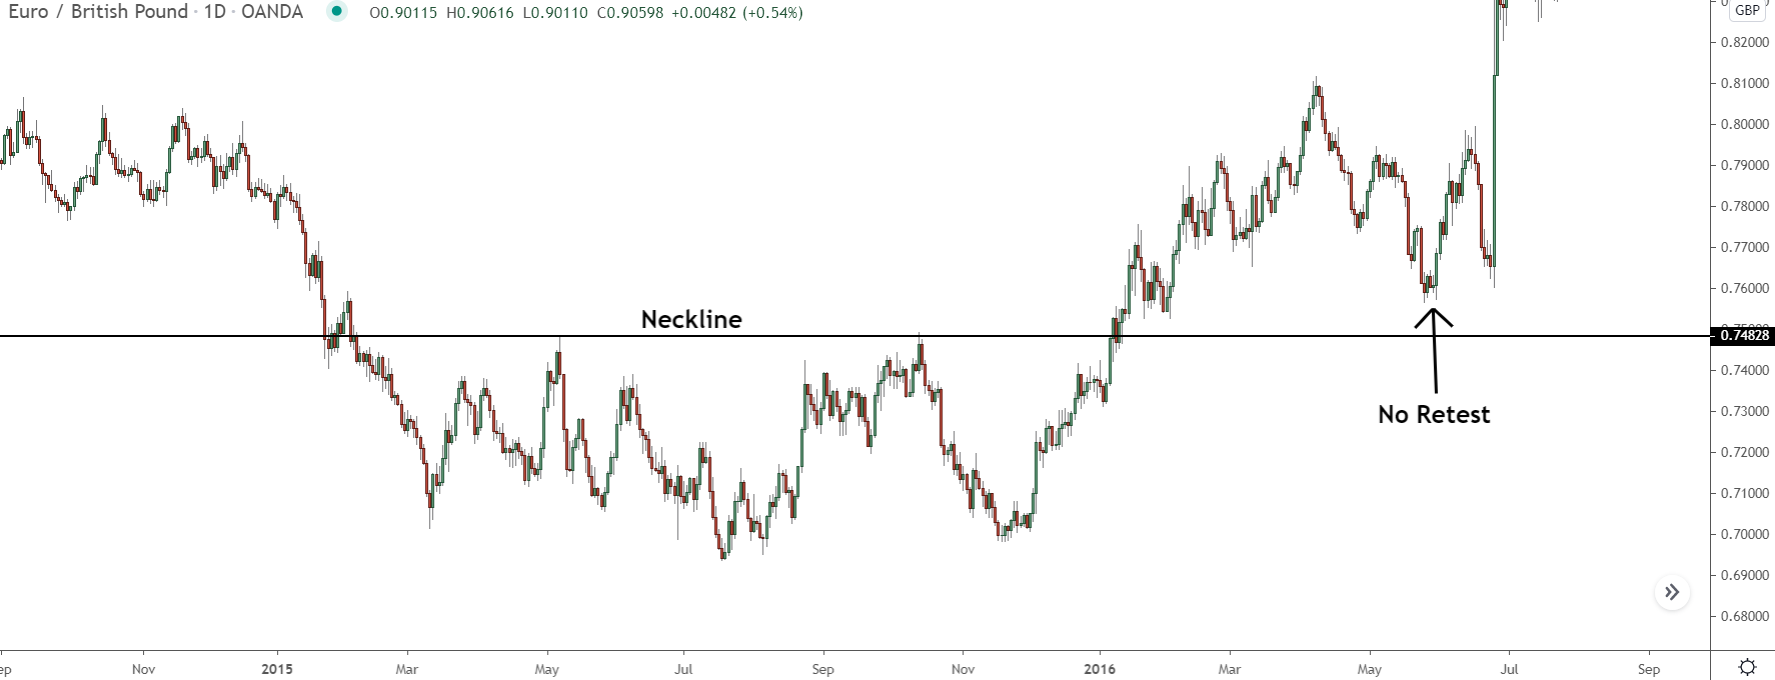
Price never reached the neckline of this double bottom, it reversed just above.
No retest means no entry, so you would’ve missed out on this reversal trading the pattern with the normal retest entry I explained earlier on.
With a zone, however, it’s a different story…
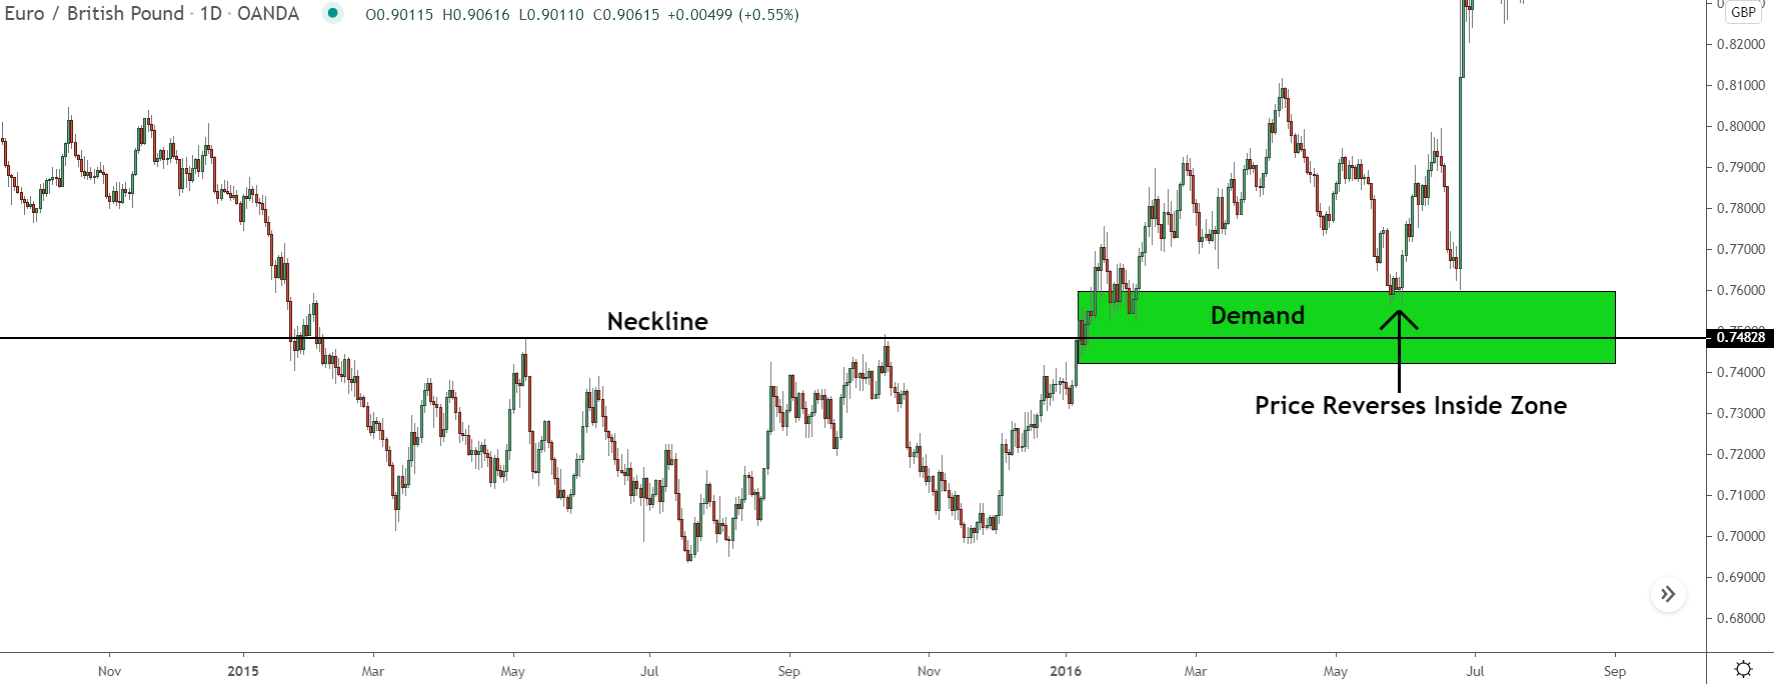
Because price has a much bigger area to reverse in, the bullish engulf forms inside the zone, making it a valid long signal you could use to get into the reversal.
So, keep you eye out for a demand zone that forms on the neckline.
They won’t appear all the time, but when they do, they make the entry significantly easier than the standard retest. The same signals all still apply as well – watch for either a big bullish engulf, or sharp rise within the zone to indicate the reversal is about to get underway.
Final Thoughts On The Double Bottom
I’m not a big fan of chart patterns… too unreliable for me. They either never form often enough to warrant keeping tabs on them or just simply don’t perform that well, making it pointless to include them in a trading strategy.
The double bottom, however, is one of few that worth keeping your eye open for.
It appears often enough to make it a good side signal alongside your core strategy – which is how I use it. And the fact it forms as a result of the banks buying and selling means it has tangible real world reason for actually indicating a reversal – something you don’t get with most other chart patterns.
All in all, it’s a great pattern, and one I recommend you learn and add to your current trading strategy.
More info on double bottoms will be available soon. I’ll also have a post on it’s brother (the double top) available in the near future, so watch out for that in the coming weeks.
The Next Step? Learn The 5 Rules For Trading Supply Demand Like A PRO Trader...
Take your trading to the next level. Sign up today to download my FREE E-Book and learn how the pro's trade supply and demand - Includes Order Block PDF and S & D Guide PDF