If you want more confirmation from your supply and demand zones; where do you focus?
Probably: if the zone lines up with other technical levels, right?
You see if the zone falls in line with nearby support and resistance levels, big round numbers, maybe a fib retracement or two… These all make great points to confirm your zones.
However, I know another way that gives you even more confirmation…
Oanda’s orderbook.
Basically, Oanda’s orderbook provides live data on all the open orders (and trades) of their retail clients. Pretty cool, right?
You can see information on where traders have placed their trades and orders, including whether they line up with points of interest, like a supply or demand zone.
And: This is how we’re going to use it today…
Let’s see if a bunch of stop orders have accumulated around a zone. This will confirm the zone has a much higher probability of causing a reversal, giving us that sought-after extra confirmation the zone is worth trading.
We’ve got lots to get into, so let’s jump in and get started.
Want More Confirmation? Check The Orderbook…
Anyone who’s acquainted with me knows… I’m a HUGE fan of Oanda’s orderbook tool.
You can check it out here.
Now, what’s so cool about this orderbook?
Well, it presents real-time data – albeit with a 20-minute lag – on all the traders and investors using Oanda as their broker. That may sound rather modest; but trust me, it’s an incredibly handy tool.
How?
The tool displays all the orders traders have live in the market.
So, the magic of the orderbook is this: you can see EXACTLY where traders have positioned their buy and sell orders, you can get a ballpark figure of how many they’ve lodged at a specific price, and most importantly, you can determine what type of orders they’ve placed.
The best part?
That includes stop loss orders – what we’re looking for.
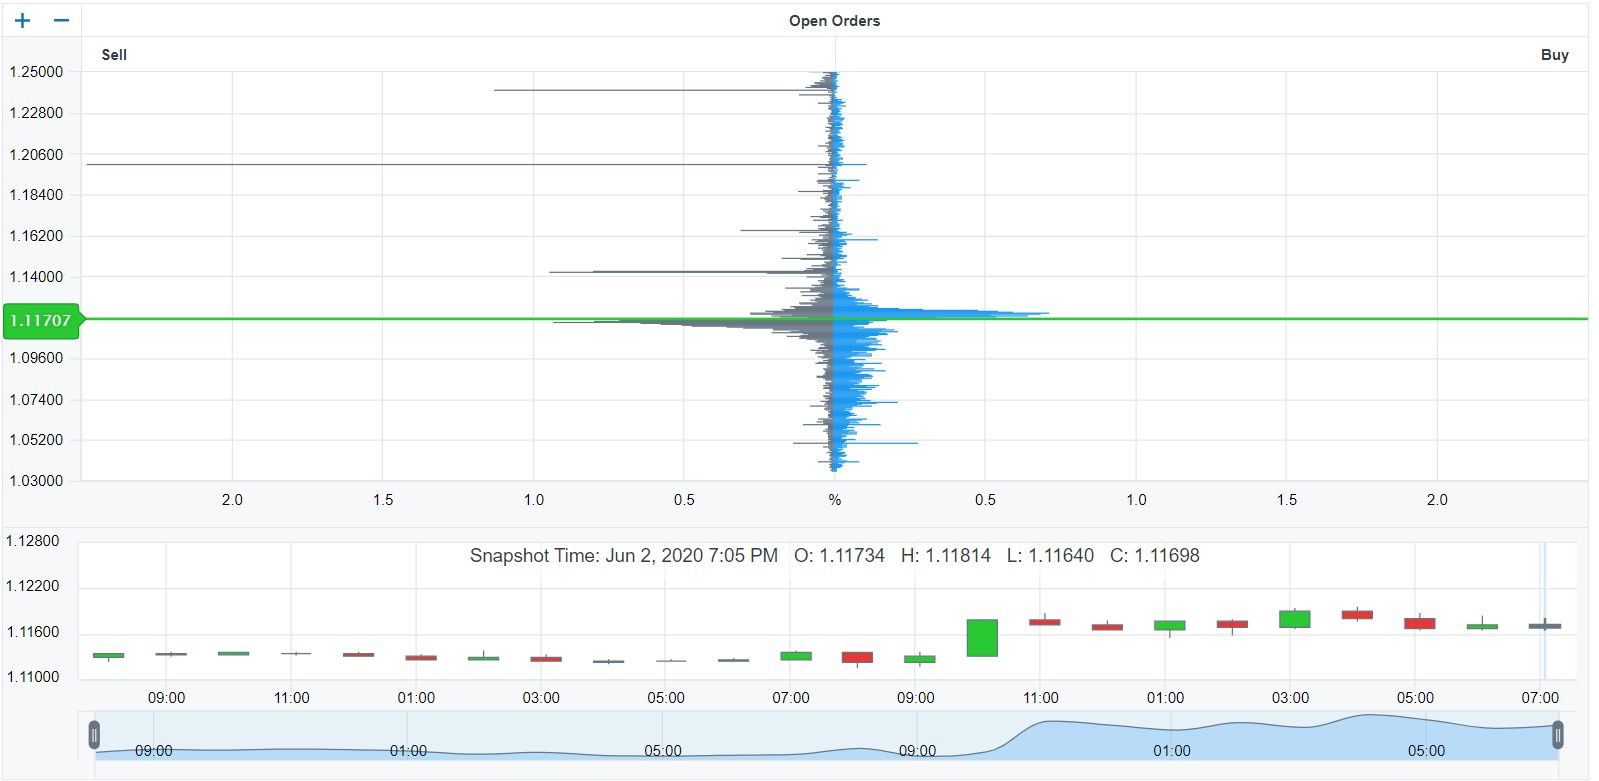
Here’s the lay of the land – the order book.
No, it’s not the most advanced graph. Yes, Oanda might be skimping on its tools, hence the simplicity. But, considering it gives you a peep into the market’s dynamics, and it’s free – did I mention that? – it works just fine.
So, what are we looking at here?
In a nutshell: buy and sell orders… and a HEAP of them.
The blue and grey bars represent buy and sell orders placed by Oanda users: sell orders in grey, buy orders in blue. These bars offer a glimpse into where traders are placing their orders and the volume of orders that have amassed at a specific price.
The larger (and broader) the bar, the heavier the order build-up around that price point.
See that little candlestick graph at the bottom?
Give it a click, and you’ll witness the hourly changes in the orders.
Clicking on a candle updates the orders to reflect the market activities during that particular hour. You’ll find this handy when I guide you through mapping the stop orders with your supply and demand zones.
How To Find Stops On The Orderbook
Confirming zones with the orderbook involves scanning the graph, pinpointing where substantial stop orders have accumulated, and then checking if any align with our zones.
But hold on…
Why stops and not regular buy and sell orders?
Well, it’s all about what stop orders enable banks to do when placing their trades.
If you’re familiar with banks’ operations, you’d know they face quite a challenge placing their trades in forex. Their trades are so colossal they rarley have enough counter orders (i.e., sellers when they’re buying, buyers when they’re selling) to execute them simultaneously.
Consequently, banks break down their trades and place them at different times – leading to reversals once multiple lows/highs occur at similar prices.
To counteract this, banks always try to push the price towards stop loss order pockets.
Having a cluster of stops allows banks to execute more orders (trades) at a single price. This reduces their burden and facilitates the placement of their remaining trades.
This is why stop hunts are so common.
By directing the price into the stops, banks execute the orders – often at our expense – and then offload a significant number of trades into the market, causing a reversal.
Banks prefer stops because they require counter orders – sell orders for buying, buy orders for selling – that won’t prompt other traders to place trades, as would be the case with ordinary buy/sell orders. Stops are automatic, and banks can trigger them up before anyone else can react.
Makes sense, right?
Now we understand why we seek stop orders. But, how do we locate them?
Here’s where the plot thickens…
The order book is an invaluable tool, no question. But, like everything else, it has its limitations, and here, it’s a substantial one:
The graph doesn’t mark stop, take profit, or normal buy and sell orders; it simply labels them as buy or sell. This makes it tough to determine which orders to prioritize when validating our zones – pretty frustrating, isn’t it?
So, to identify the stops, we need to distinguish which orders are which.
At first glance, this seems daunting.
However, by understanding why and how traders place their orders, it’s actually quite straightforward…
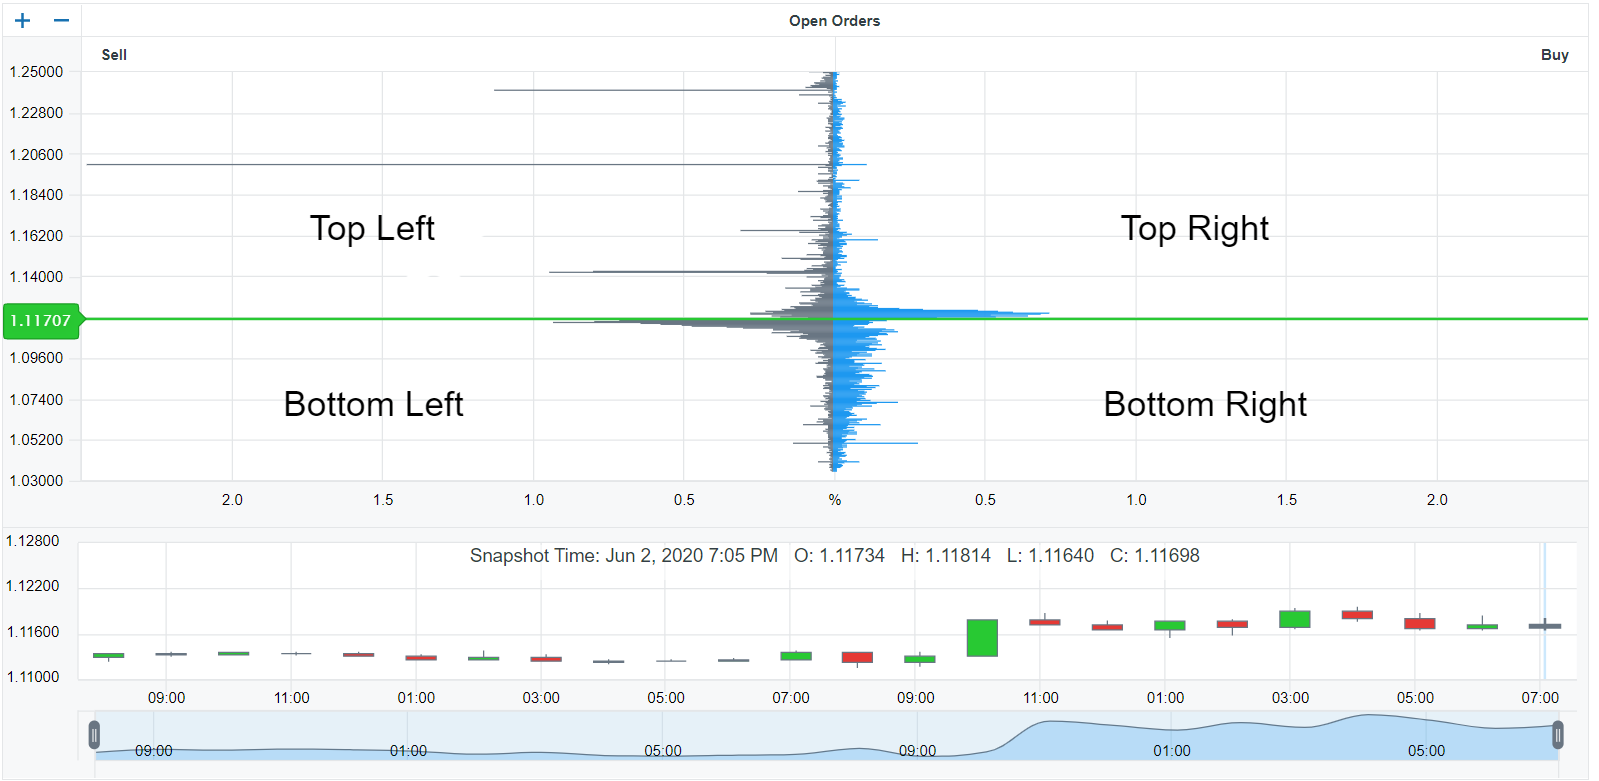
The order book is neatly divided into four quadrants: top left, top right, bottom left, and bottom right.
Each of these quadrants showcases a distinct set of orders… with the current price (shown as the green line) serving as a boundary, separating the top quadrants from the bottom ones.
Here’s something to remember: when we set a stop loss, we always position it either above or below the price, right?
Let’s break this down further…
If we are entering a buy trade, we typically set it below the current price. Conversely, if we’re placing a sell trade, we usually set it above the current price.
So, what can we deduce from this?
Well, the sell orders that are listed below the current price on the graph (occupying the bottom left quadrant) are, in fact, stop orders. They must set by traders with active long trades. And it’s unlikely they’re normal sell orders (considering their significant distance from the current price).
Why, you ask?
Well, traders wouldn’t sell that far below the current price. It wouldn’t make any sense!
The same logic applies to the buy orders seen in the top right quadrant.
The orders situated a substantial distance from the current price aren’t likely to be buy orders set to enter trades. Why would traders want to buy when the price is so far away? These orders are, therefore, presumably buy stops from traders currently holding open short trades.
Now that we’ve clarified that, let’s revisit the graph and attempt to identify which orders are which.
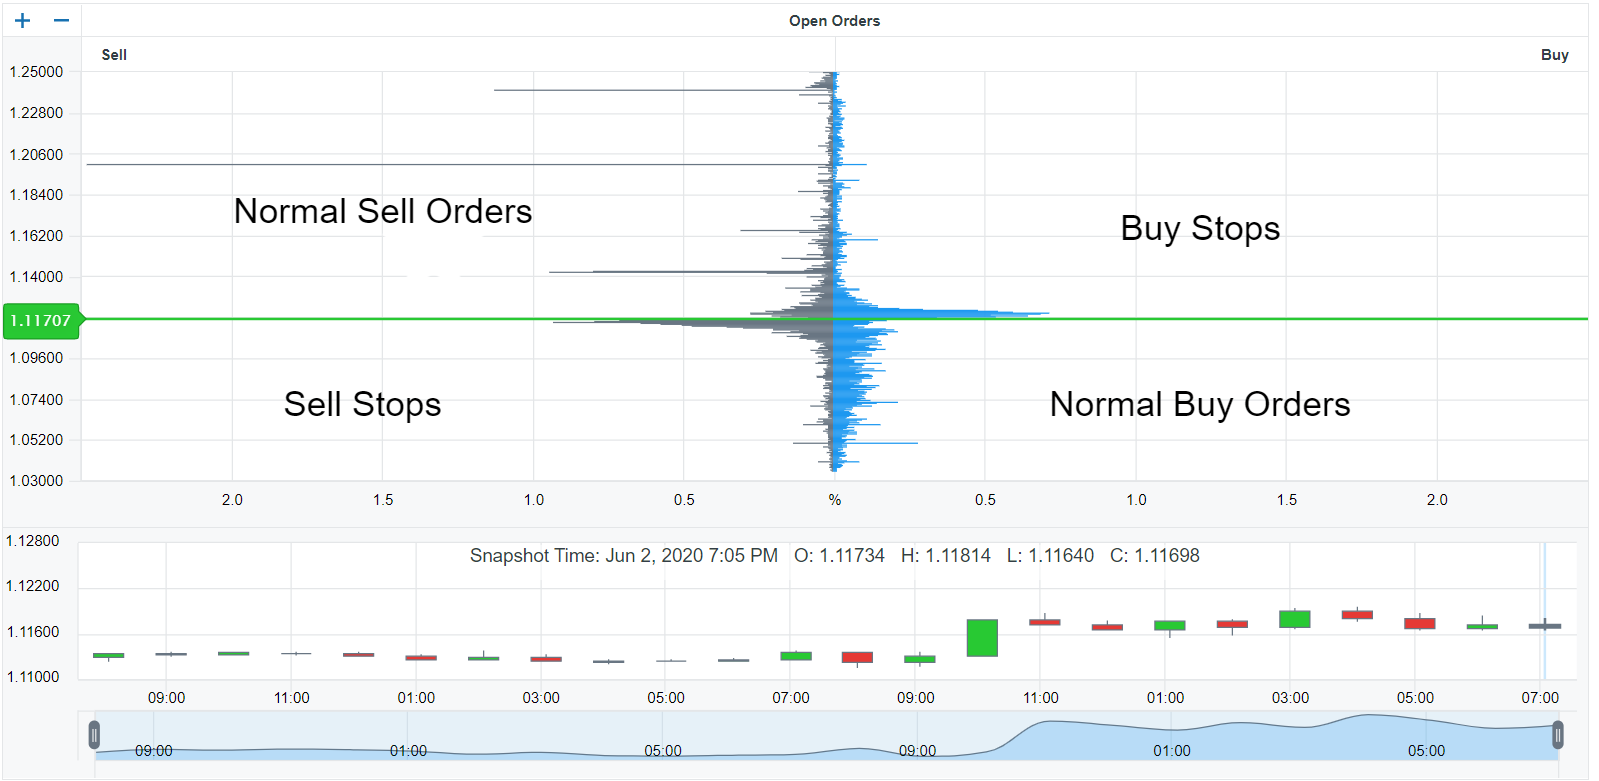
Down in the bottom left quadrant, we have what’s known as sell stops. These are essentially stop orders from traders with open buy trades.
Now, here’s the thing…
These are what you need to observe when confirming demand zones.
Why are sell stops important?
Well, they present banks with the opportunity to get their buy orders executed. Here’s how it works: sell orders must be paired with buy orders and vice versa. This dynamic allows banks to place buy trades, take profits from open sell trades, or close their sell trades entirely.
But which outcome will it be?
That’s the million-dollar question.
The zone’s location and the market’s behavior might offer some hints, but truth be told, it’s often hard to predict with certainty.
On the opposite end, in the top right quadrant, we find buy stops.
These are stop orders from traders who have open sell trades.
If you’re looking to confirm your supply zones, this is where your focus should be.
Similar to sell stops, buy stops enable banks to execute sell orders. So, they’ll leverage these to place sell trades, take profits from buy trades, or close out some of their open buy trades.
Again, it’s tough to know for sure what the end result will be.
Regardless, once price reaches a zone where buy stops have accumulated, you should see the price reverse or, at the very least, bounce and turn into a retracement.
How To Confirm Your Zones Using The Orderbook
So, how to confirm your zones using the order book?
It’s pretty straightforward.
The key is to identify where stops have accumulated on the graph and check if they align with any supply or demand zones.
That’s pretty much it!
If you notice a significant buildup of stops within/near a zone, chances are, the zone may trigger a reversal. Why? The banks might not have enough orders to place the necessary number of trades, take profits, or close trades.
So, they’ll drive the price into the stops to get more executed.
Significantly increasing the zone’s chance of causing a reversal.
Seems simple, right?
Let’s walk through a quick example so you’ll know exactly what to do:
First off, open the orderbook… Take a good look at the buy stops and sell stops (bottom left and top right quadrants).
The orderbook showcases stops everywhere, but here’s the thing: you only want to pay attention to where the highest concentration of stops is – in other words, the big bars.
Why?
Well, more stops mean it’s easier for the banks to place trades, close trades, or take profits. So, zones that align with a large build-up of stops (big bars) usually have a better shot at causing a reversal.
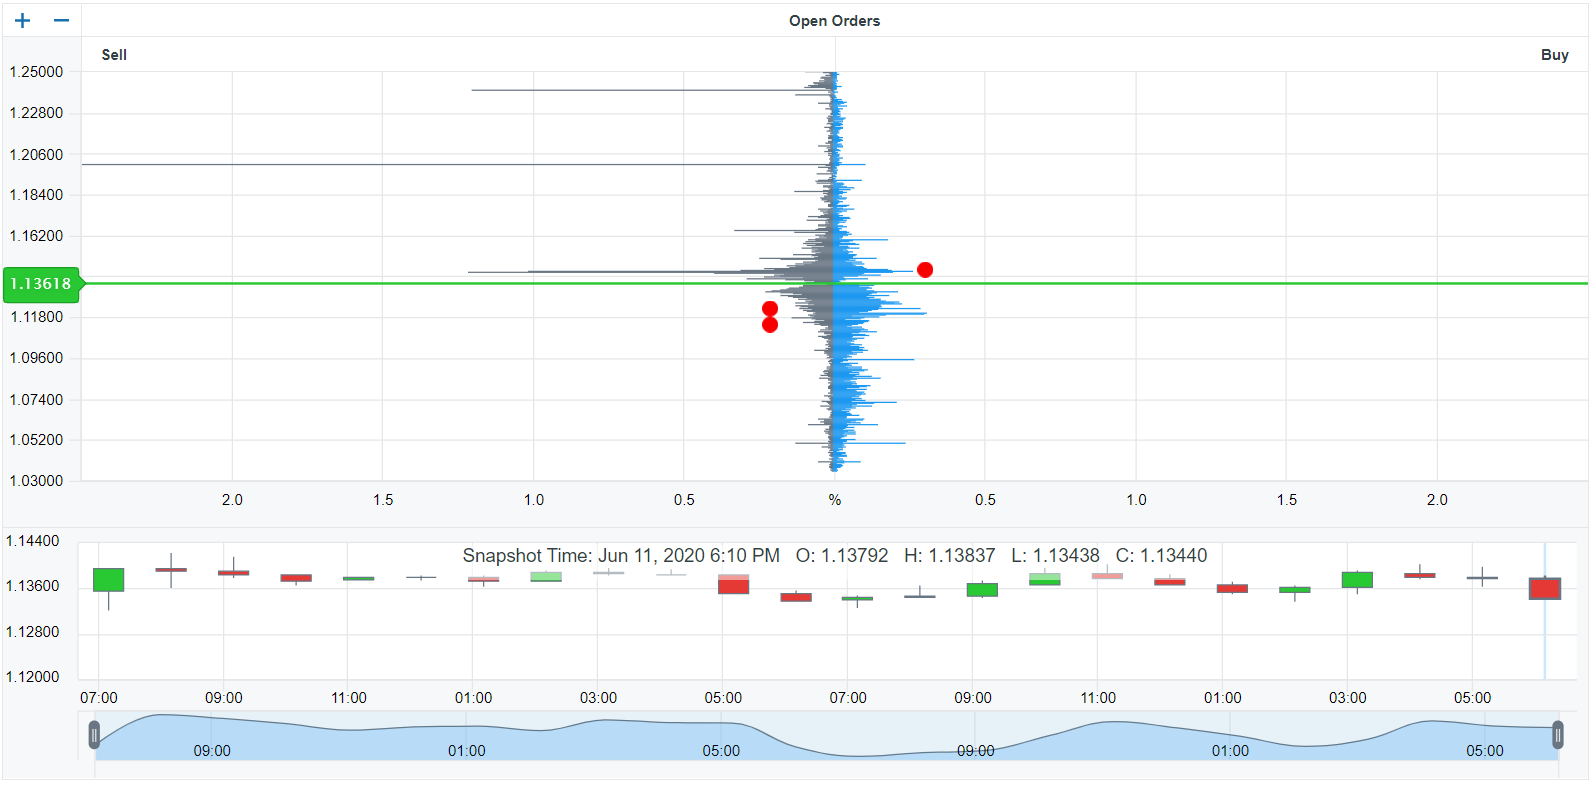
However, here’s a pro tip: Only focus on the big bars that are NOT near the current price.
Notice how a large number of orders have accumulated slightly above and below the current price (green line)
These orders aren’t stops but regular buy and sell orders.
Sure, some might be stops, but a whopping 95% aren’t.
You can tell because they’re close to the current price, not far off. While traders won’t place their orders far from the price – as I explained earlier – they’re more likely to place them close. Why? Because price is likely to hit them and get them into a trade.
So, here’s the plan:
Don’t focus on the bars close to the current price. Instead, concentrate on the ones found 50 pips above and below, as these are the ones most likely to be stop orders.
Note: Ensure the most recent candlestick on the graph is selected when viewing the orders. This displays the most recent update of the orders. If you select the other candles, the orders could be lower/higher than they are now, meaning the zone might not be as powerful as you think.
Once you’ve gotten a feel for the orders, note down the prices they’ve built up at and switch over to your chart.
Now, mark a line on these prices…
Do you see any supply or demand zones form at the same spot?
You should find a few zones lining up. Highlight these in a different color, so you know to pay extra attention to them, and then wait for the price to enter. Once it returns, look for the usual signs of a reversal – a sharp move out, a big engulfing candle – and then dive in.
That’s it… that’s all there is to it!
Just wait and see if the price reverses.
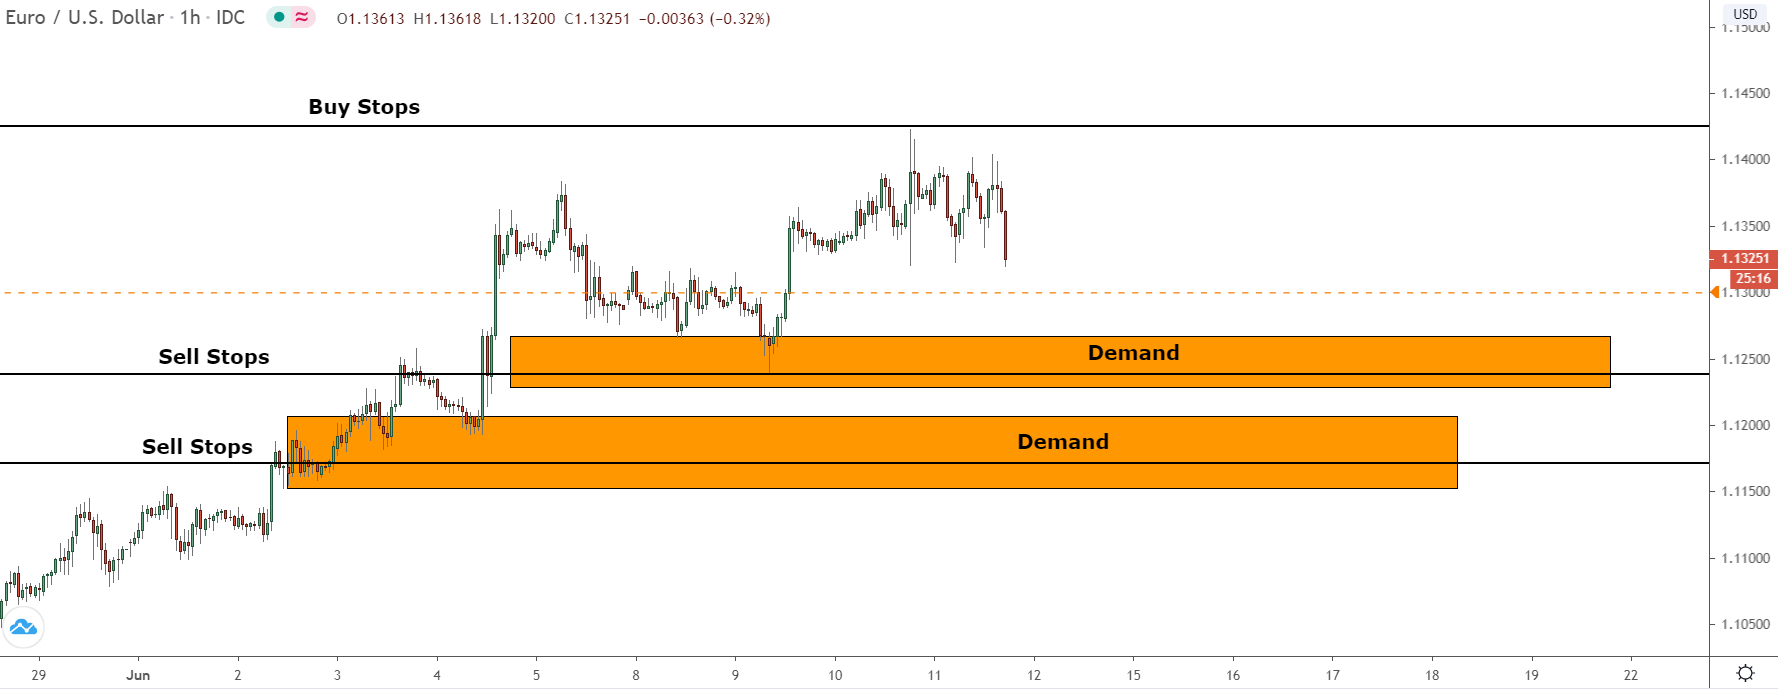
Before I wrap up, here’s something worth bearing in mind: If the orders are slightly above or below the zone – much like for the middle zone in the image – adjust the size of the zone to include them. Price often spikes beyond a zone before reversing because it’s seeking out these orders.
By making the zone larger, you reduce the likelihood of this happening…
Sure, it’ll still happen, but far less frequently.
Pretty neat, isn’t it?
The Bottom Line
I’ve only used the orderbook to confirm zones for a few weeks now, and in that time, my results have improved dramatically. My success rate has gone up. I’m taking trades from better quality zones. I haven’t been stopped out from a spike in god knows how long… all the good stuff basically.
So, try it out yourself for a while… see how you get on.
For even better results, look for stops alongside the typical points of confluence – S & R levels, fib retracements, big round numbers.
Together, they’ll give you even more confirmation price is going to reverse from the zone.
Thank you for the article Liam.
In the article you’ve mentioned that we should only search for the big bars that aren’t near the current price. Could you define ‘near the current price’ as the number of pips or so?
Besides, two of the images of the page doesn’t show up.
Sure thing, Meir!
So you want to look for a big build up stops 50 pips away from the current price: so if Eur/Usd is at 1.13000, look for a high concentration 50 pips beyond that (for buy stops) or below that for sell stops. The stops you see close to the current price aren’t necessarily stop orders, but normal buy and sell orders, that’s why it’s best to leave them alone. The orders further away are typically stops, as why would traders believe price is going to rise or fall upon reaching a random far away price? It doesn’t make sense, so they’re much more likely to be stops than normal buy and sell orders.
As for the post… I actually didn’t mean to put this out yet, that’s why the images aren’t in. I’ll send if I can it finished later tonight. I’m waiting for a good bunch of stops to build up on the orderbook, so the examples are easy for everyone to understand.
Hope this helps,