James16 – the most famous forex trader you’ve never heard of.
A mysterious figure whose real identity remains unknown even to this day, James16 had a massive influence in the retail Forex industry, being one of the first traders to really advocate price action trading, that is:
Trading using only price rather than lagging indicators.
He’s most famous for creating his ForexFactory thread – the James16 chart thread.
It’s here he detailed his methodology (price action trading) along with the 4 main strategies he uses. This thread was the first taster many traders – myself included – got of what price action trading is and how it works.
Forex trading has evolved significantly since the heydays of James16’s chart thread, and nowadays, most of his strategies are far too simple to be used effectively… they’ll get you into the odd good trade from time to time, but overall, they’re too outdated to generate consistent profits.
They can be improved, however…
With a few small tweaks, you can turn James16’s four trading strategies – which are really just simple PA patterns – into highly profitable trading signals, and use them in your trading.
That’s what I’m going to show you today!
In this guide, I’m going to give you a full breakdown of each James16 strategy.
I’ll start with a quick overview of how each method works and how to identify the different patterns involved – with candlestick charts, since James always uses bar charts, annoyingly.
Then, I’ll detail how you easily improve the win rate of each strategy using some simple tricks and techniques.
By the end of the guide, you’ll know exactly how to trade like James16 and have a few tricks to drastically improve the success rate of his different trading strategies.
Sound cool?
Let’s get started…
- Overview Of James16
- How To Trade Like James16 And His Strategies
- Strategy #1 Double Bar Low Higher Close & Double Bar High Lower Close
- How To Improve The DBLHC & DBHLC Strategy
- Strategy #2 Two Matching Highs And Two Matching Lows
- How To Improve Two Matching Highs/Lows
- Strategy #3 Bearish Outside Vertical Bar & Bullish Outside Vertical Bar
- How To Improve Bullish And Bearish Outside Bars
- Strategy #4 Bullish And Bearish Pin Bars
- How To Improve Trading Pin Bars
- The Bottom Line
Overview Of James16
James16 burst onto the forex scene in early 2005, when he started his now famous thread on ForexFactory – the James16 Chart Thread.
For many traders, this was their first exposure to trading naked, or…
Price action trading, as we know it today.
It’s hard to overstate the impact James16 and his thread had on the retail forex trader community.
At the time, price action trading was nothing like it is today. The education was extremely limited; there weren’t any price action websites for a start, outside a couple of pattern sites here and there – which isn’t really proper PA anyway.
Plus, YouTube was still in its infancy, so you couldn’t learn about PA from videos either.
For many years, James16’s thread was the only place you could really learn about price action trading, and traders flocked to it in their droves to learn how trade using his methods…. which were pretty revolutionary.
Back then, the idea of trading from a blank chart with no indicators was an alien concept to most traders.
Indicators were all the rage; that’s what everyone used. Nobody watched for pin bars at support and resistance or used fibs to get into retracement trades. James’s thread changed all that and made many of the common price action strategies and concepts we know today popular.
How To Trade Like James16 And His Strategies
Now we’re going to get to the meat of the guide, the reason most of you clicked (or downloaded, if you got the PDF) here in the first place…
I’m going to show you how to trade like James16, and give you some tips to improve each strategy.
Because James16 is a price action trader, all his strategies – 4 in total – are based on using price and price ONLY. He doesn’t use any indicators, outside of a couple of moving averages to quickly identify trend direction – note: he sometimes uses MA’s as dynamic S & D too, but I advise against that, due to the false signals they give.
You don’t really need to use MA’s like he does – watching for higher highs/lower lows works just as well, if not better.
However, if you do want to use them, here’s the settings he uses:
- MA 50
- MA 230
So, here are James16’s 4 trading strategies:
- Double Bar Outside Vertically Bar/
- Bullish And Bearish Pin Bars
- Two Matching Lows/Highs
- Bullish And Bearish Outside Bars
With each strategy, you wait for the above patterns to form on their own or sometimes at technical levels – he mainly uses support and resistance levels, but sometimes Fibonacci retracements for pull-back entries.
Getting to grips with them is pretty easy, and you don’t need to use them all in your trading.
Here’s how to trade each one along with my tips and tricks you can use to improve them further.
Strategy #1 Double Bar Low Higher Close & Double Bar High Lower Close
To start things off, let’s look at the double bar low higher close & double bar high lower close strategy.
A staple of James16’s ForexFactory thread, and one of his bread and butter setups, this strategy has you trade reversals using two little known candlestick patterns:
The double bar low higher close (DBLHC), and
The double bar high lower close (DBHLC).
These two patterns, which aren’t mentioned in most PA books, are created when two candlesticks with equal or similar lows or highs form before closing either higher or lower than the close of the prior candle.
They show the bulls/bears have matched the other side (hence the lows/highs being the same). The fact price closes higher or lower than the prior candle indicates the momentum has changed, making it a great signal price is about to reverse the current trend or swing, which is how James16 uses them.
The double bar low higher close and double bar high lower close is a good strategy, but it can be made even better with just a few small tweaks and improvements.
Before we get to that, however, let me show how to identify and trade each pattern.
Pattern 1: Double Bar Low Higher Close (DBLHC)
The double bar low higher close (or DBLHC, for short) is a two candle reversal pattern that ONLY forms in a downtrend or during a downswing.
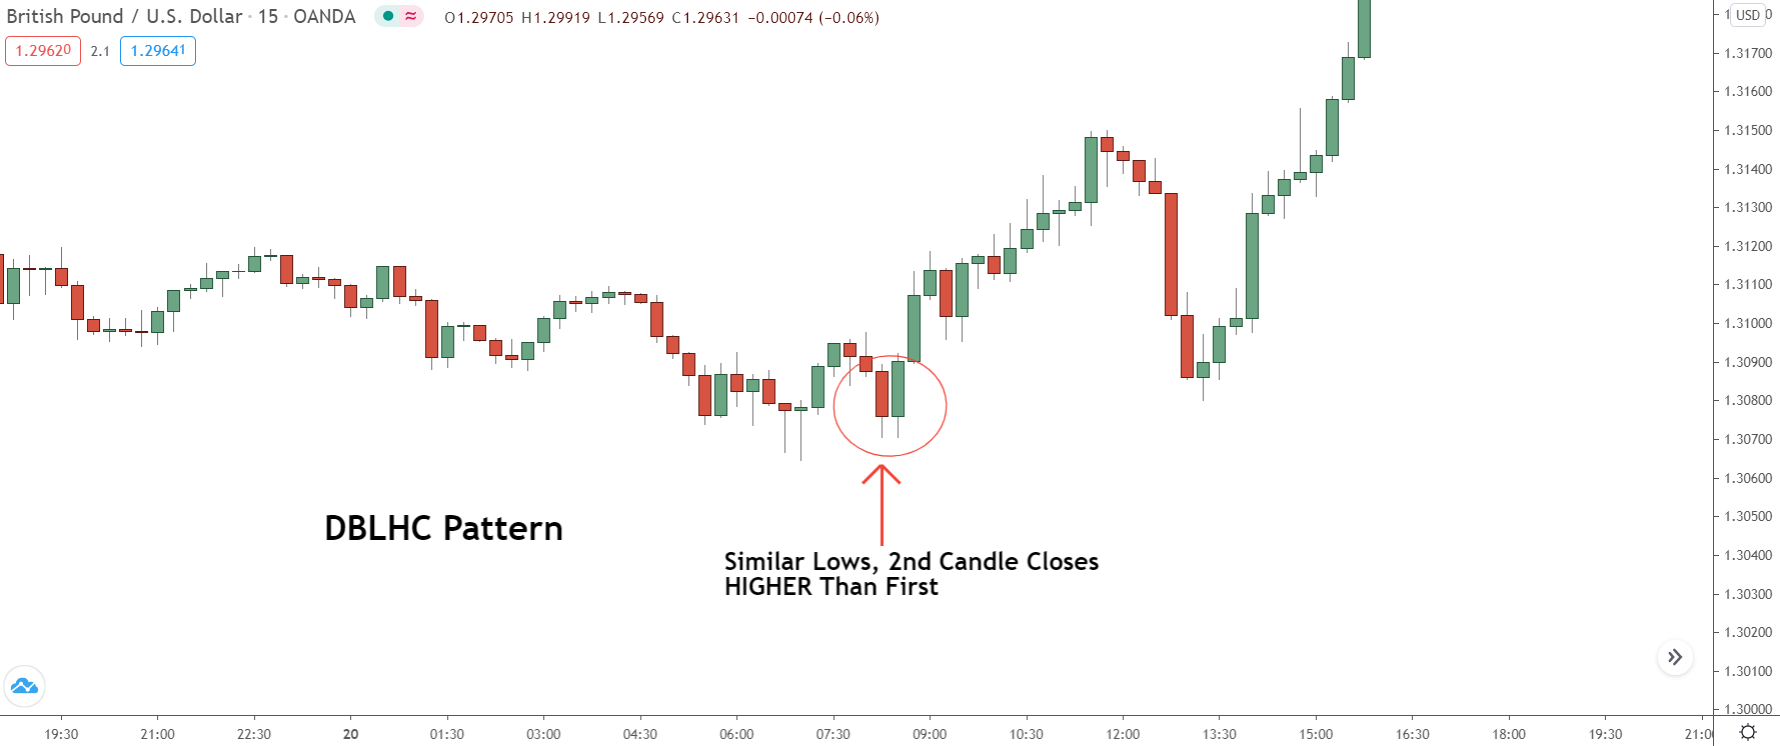
The pattern is created when two candlesticks form with similar lows to each other. The lows can either be at the same price or within ten pips – any more than that, and the pattern isn’t valid. The 2nd candle MUST also close higher than the close of the first candle, as it shows the bulls have overwhelmed the bears.
To Trade The DBLHC, Follow These Steps:
- Watch for two candles (either bullish or bearish) to form with similar lows – within ten pips.
- Wait for the 2nd candle to close HIGHER than the close of the first candle.
- Once the candle closes higher, enter a market order to buy.
- Place your stop loss below the low of the 2nd candlestick – 5 – 10 pips should be enough.
Pattern 2: Double Bar High Lower Close (DBHLC)
Switching over, we have the double high lower close pattern (DBHLC).
This pattern is the inverse to the DBLCH pattern we just looked at; it only forms during uptrends or on upswings and is made up of two candlesticks that form one after the other.
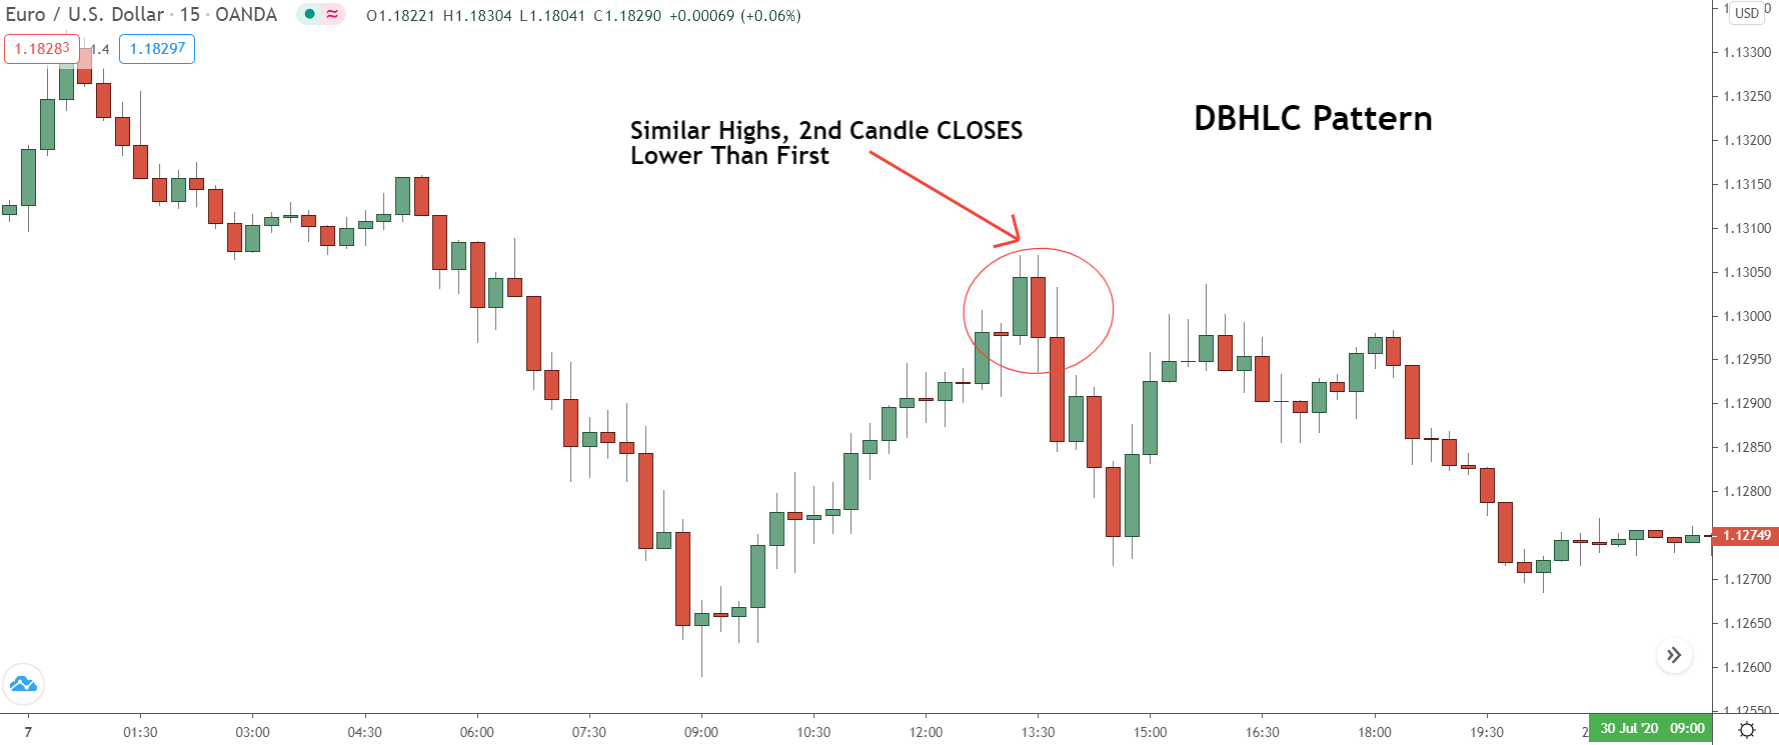
Unlike the DBLHC, the pattern forms when two candles make similar highs, not lows – again, within ten or so pips of each other. The 2nd candle must also close lower than the open of the first candle, otherwise, the pattern isn’t valid and may not cause a reversal of the current movement/trend.
To Trade The DBLHC, Follow These Steps:
- Watch for two candles (either bullish or bearish) to form with similar highs – within ten pips.
- Wait for the 2nd candle to close LOWER than the close of the first candle.
- Once the candle has closed lower, enter a market order to sell.
- Place your stop loss above the high of the 2nd candlestick – 5 – 10 pips should be enough.
How To Improve The DBLHC & DBHLC Strategy
Bullish and bearish outside bars are one of James16’s key setups, and they can be drastically improved in two really simple ways:
- By Only Taking Patterns From Technical Levels
- Avoiding Weak Patterns
Only trading the patterns that form from technical levels is self-explanatory – the levels combined with the patterns provide more confirmation, making a reversal more likely.
The top places you should watch for patterns are as follows:
Support and resistance levels (or zones, if you read my VIP post).
Fibonacci retracements.
Supply and demand zones – the best location, though not as easy to find.
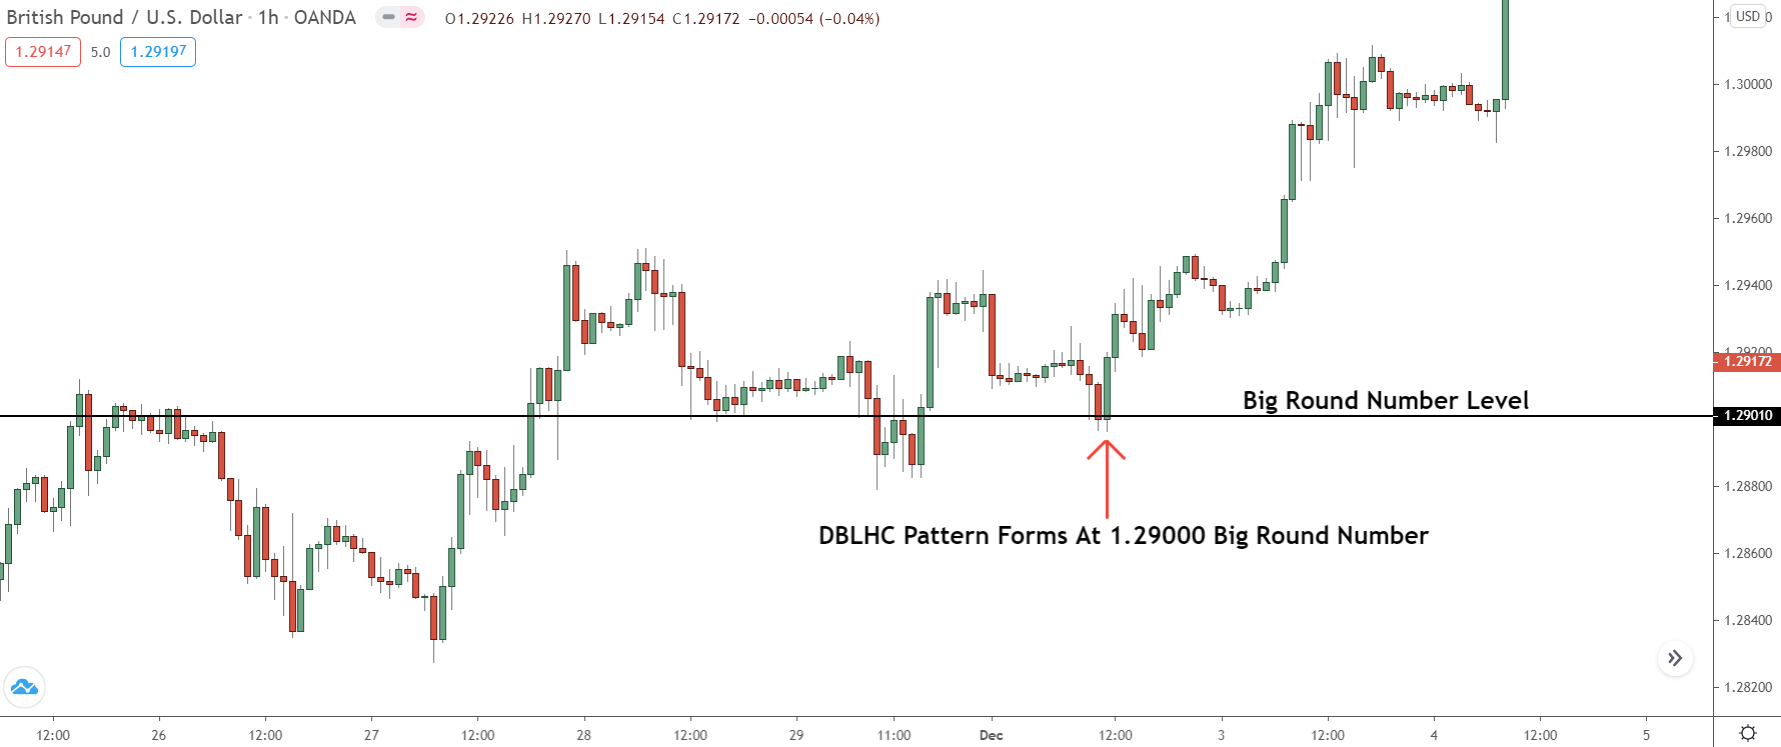
Big round numbers – prices ending in 00,000 or 0000 – can also provide good additional confluence with outside bars, but it’s better to wait for evidence price is reversing before entering. Wait for price to reach a BRN, see if it starts reversing, then enter once you see the right outside bar form.
Avoiding small patterns is another way to improve your win rate…
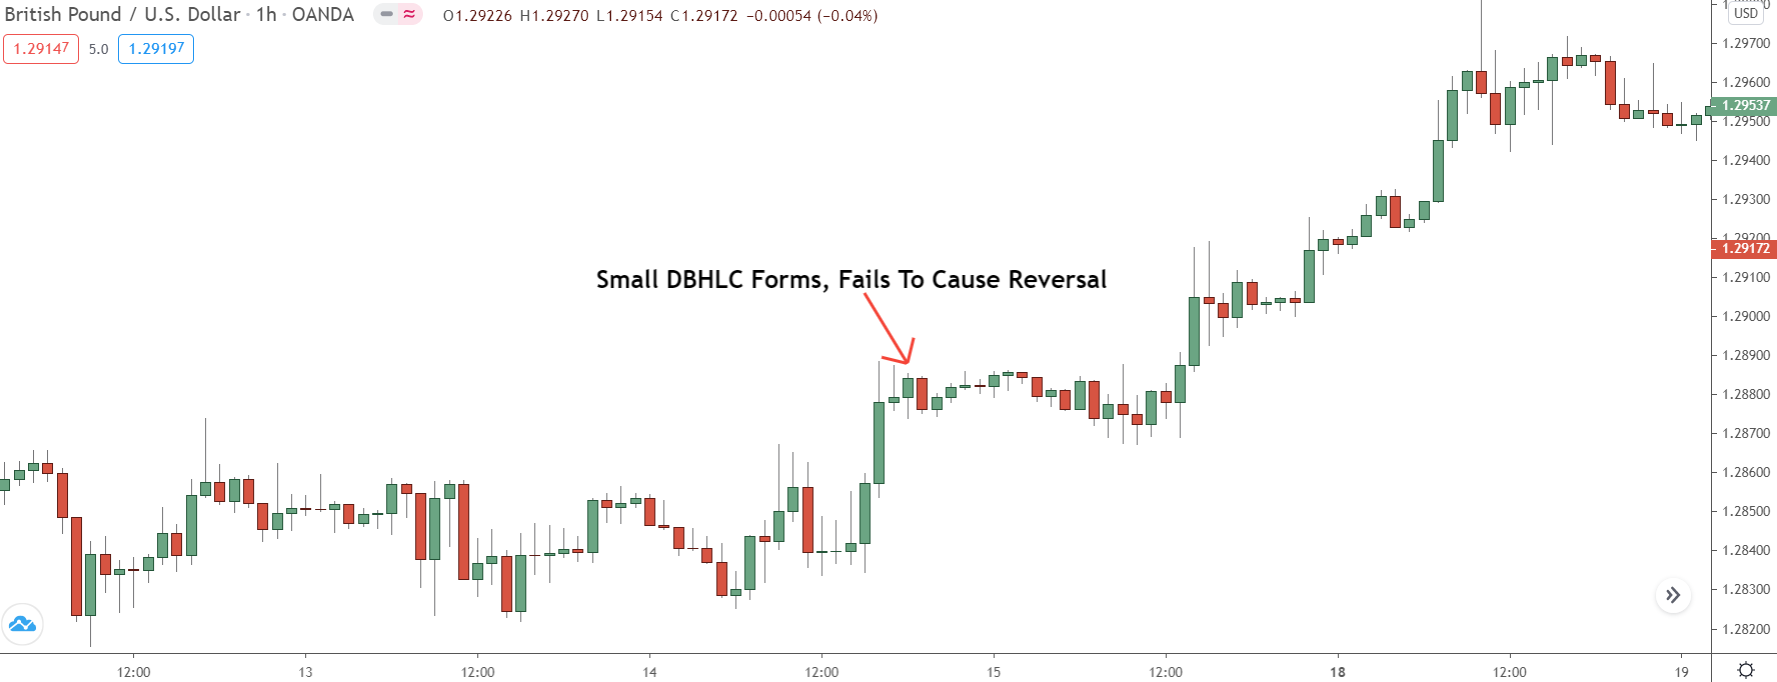
DBLHC/DBHLC candles are a variation of the engulfing pattern; they show a shift in momentum from the bulls or bears, resulting in a reversal. But here’s the thing…
The shift in momentum is shown by how high/low the second candle closes beyond the first.
If the second candle in a DBLHC pattern closes much higher than the first candle, that means the bears have put a lot more resources behind the reversal, hence the higher close.
That indicates price has a higher probability of reversing, because why would they put more resources if they didn’t think price was going to reverse?
So, if you stick to trading the pattern with much higher/lower closes than the prior candle, you should improve your win rate.
Strategy #2 Two Matching Highs And Two Matching Lows
No list of James16 strategies would be complete without the two matching highs and two matching lows patterns, and that’s what I’m going to show you how to trade next.
With this strategy, you trade candles that form with two matching highs or two matching lows.
These patterns form often in forex, usually signalling a reversal or the current trend or movement. They’re created when the bulls (or bears), who are in control of price, get matched by the opposite side for two consecutive candles.
The result being two candles with almost identical highs or lows forming before price reverses.
I’m not the biggest fan of the two matching highs/lows strategy – you’ll see why later on.
That said, here’s how to trade them…
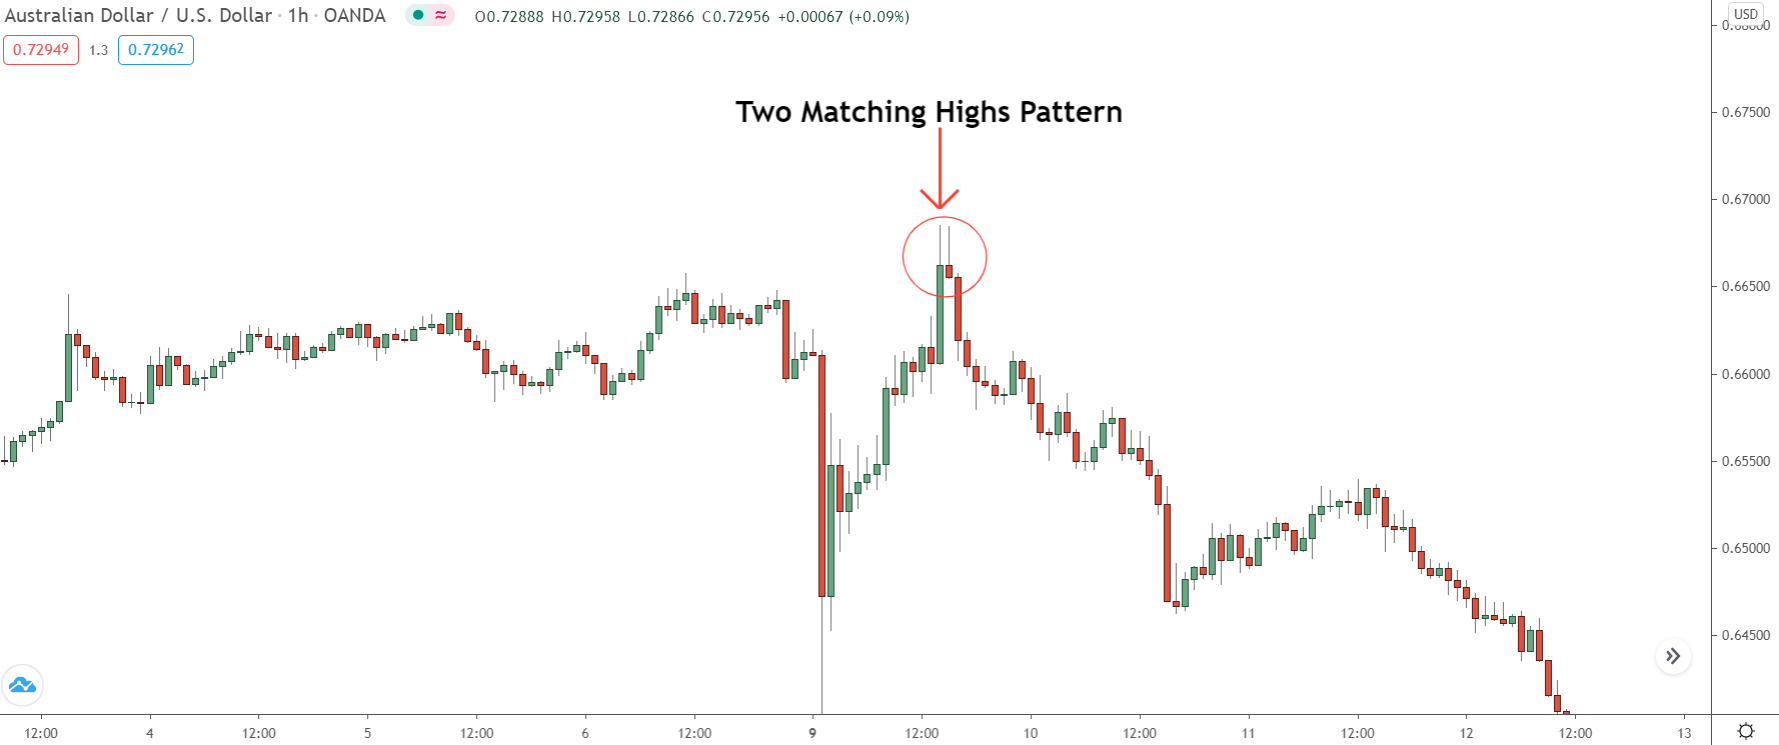
Pattern 1: Two Matching Highs
The two matching highs forms when two candlesticks close with similar or identical highs.
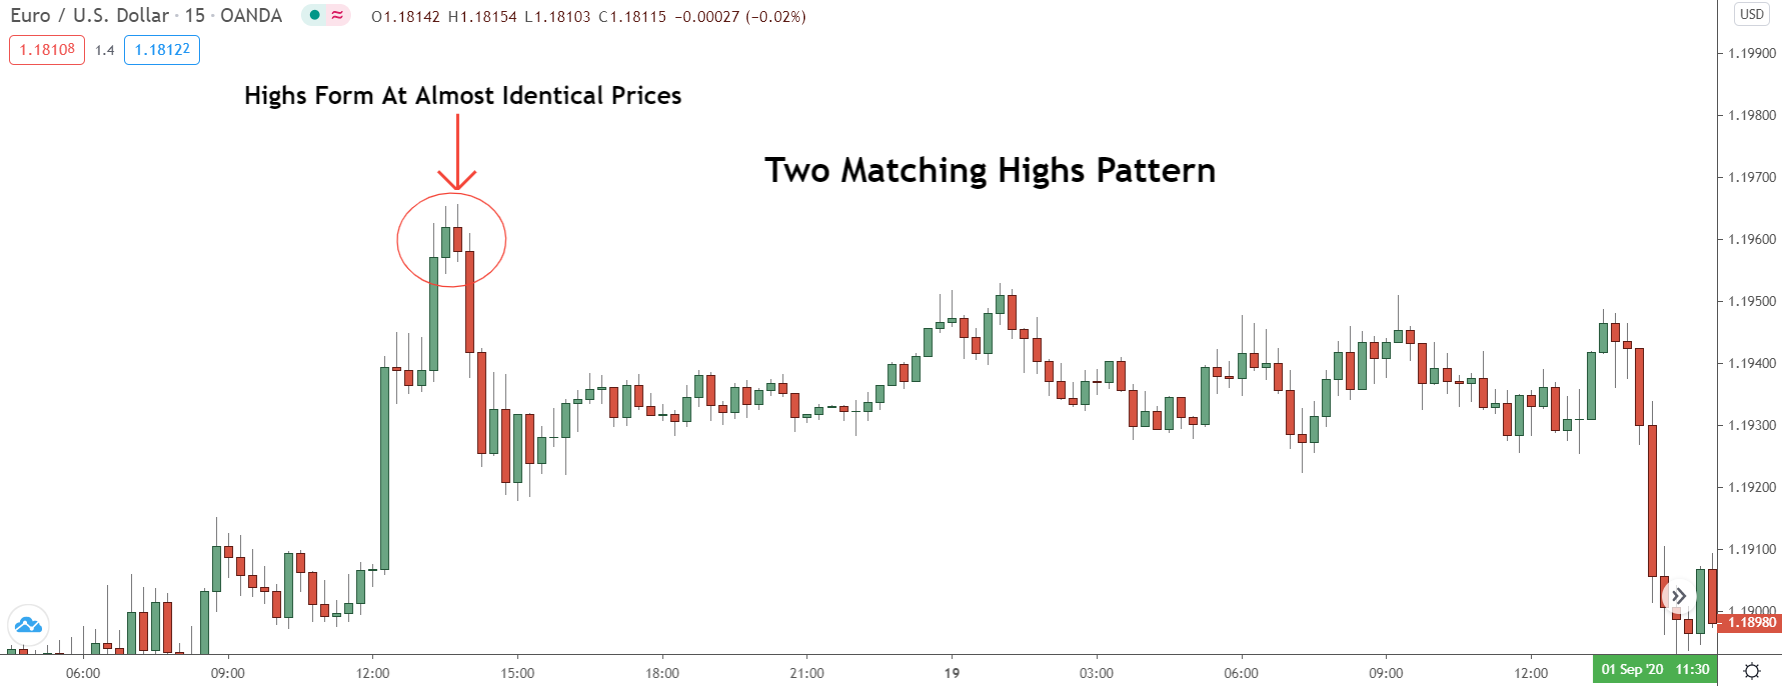
Being a reversal pattern, the two matching highs only forms during up-trends/upswings or when price is consolidating, signalling the end of the consolidation and a reversal to the downside. It’s not a pattern that forms all the time in forex, but it’s common enough to make it worth watching and usually results in some large reversals.
To Trade The Two Matching Highs, Follow These Steps:
- Wait for two candles (either bullish or bearish) to form with matching highs – within ten pips.
- Enter a market order to sell as soon as the 2nd bar closes, or…
- Place a pending order to sell 2-3 pips below the low of the 2nd candle (better confirmation)
- Place your stop loss above the high of the 2nd candlestick – 5 – 10 pips should be enough.
Pattern 2: Two Matching Lows
On the other side of the fence, we have two matching lows, which is a bullish reversal pattern that forms when two candlesticks close with similar or identical lows.
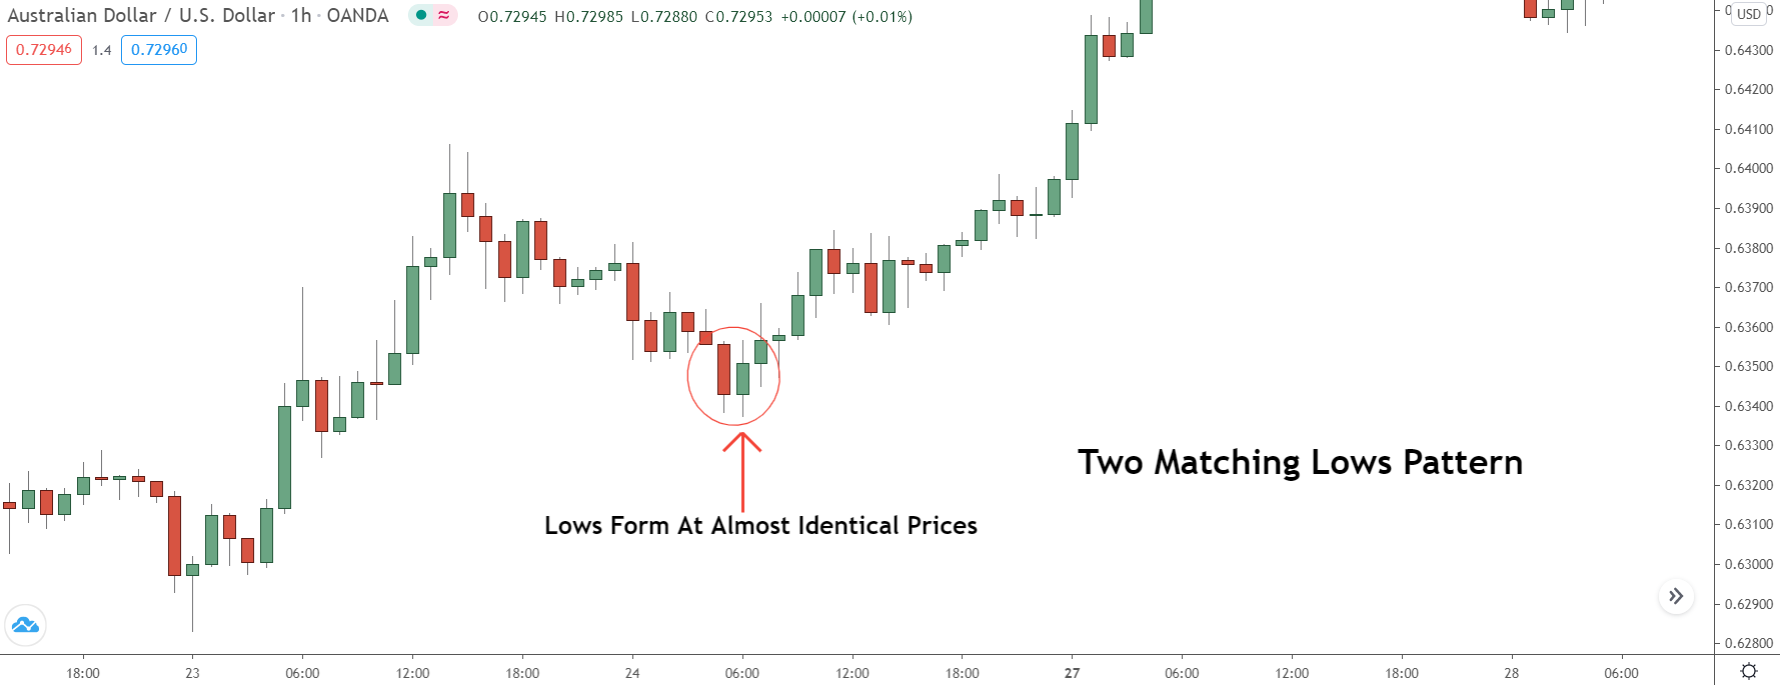
This pattern only appears during downtrends/downswings or consolidations and signals a reversal to the upside. Again, not a common pattern, especially on the higher timeframes – you’ll find it more on the lower timeframes – but still, one worth watching out for its uncanny ability to predict reversals.
To Trade The Two Matching Lows, Follow These Steps:
- Watch for two candles to form with similar lows in a downtrend/swing – within ten pips.
- Enter a market order to buy as soon as the 2nd bar closes, or…
- Place a pending order to buy 2-3 pips above the high of the 2nd candle (better confirmation)
- Place your stop loss 5 -10 pips below the low of the 2nd candlestick.
How To Improve Two Matching Highs/Lows
So, how do you improve the two matching lows/highs strategy? This might be a little controversial to James16 disciples, but the best way is to simply not trade the strategy at all.
And the reason why is simple:
The two matching lows/highs patterns are basically lower quality DBLHCD/BDBLD patterns we just looked at.
Both patterns form when two candles make similar lows or highs. The big difference is: the DBLHC/DBCHLD patterns close HIGHER or LOWER than the preceding candle. This shows the bulls or bears have overwhelmed the other side, which gives the pattern a much better chance of causing a reversal.
With the two matching lows/highs, we don’t get that…
They only form from price making two identical or similar lows or highs; that’s the only requirement!
Price doesn’t need to close lower/higher than the prior candle, so the pattern doesn’t show the bulls overwhelmed the bears and vice versa, giving it a lower probability of being successful.
So if you want to trade like James16… better to leave the two matching highs/lows alone.
If you do fancy trading them, make sure you only trade the patterns that form either with long wicks or when the 2nd candle has a long wick in the direction of the reversal.
A pattern like this for example…
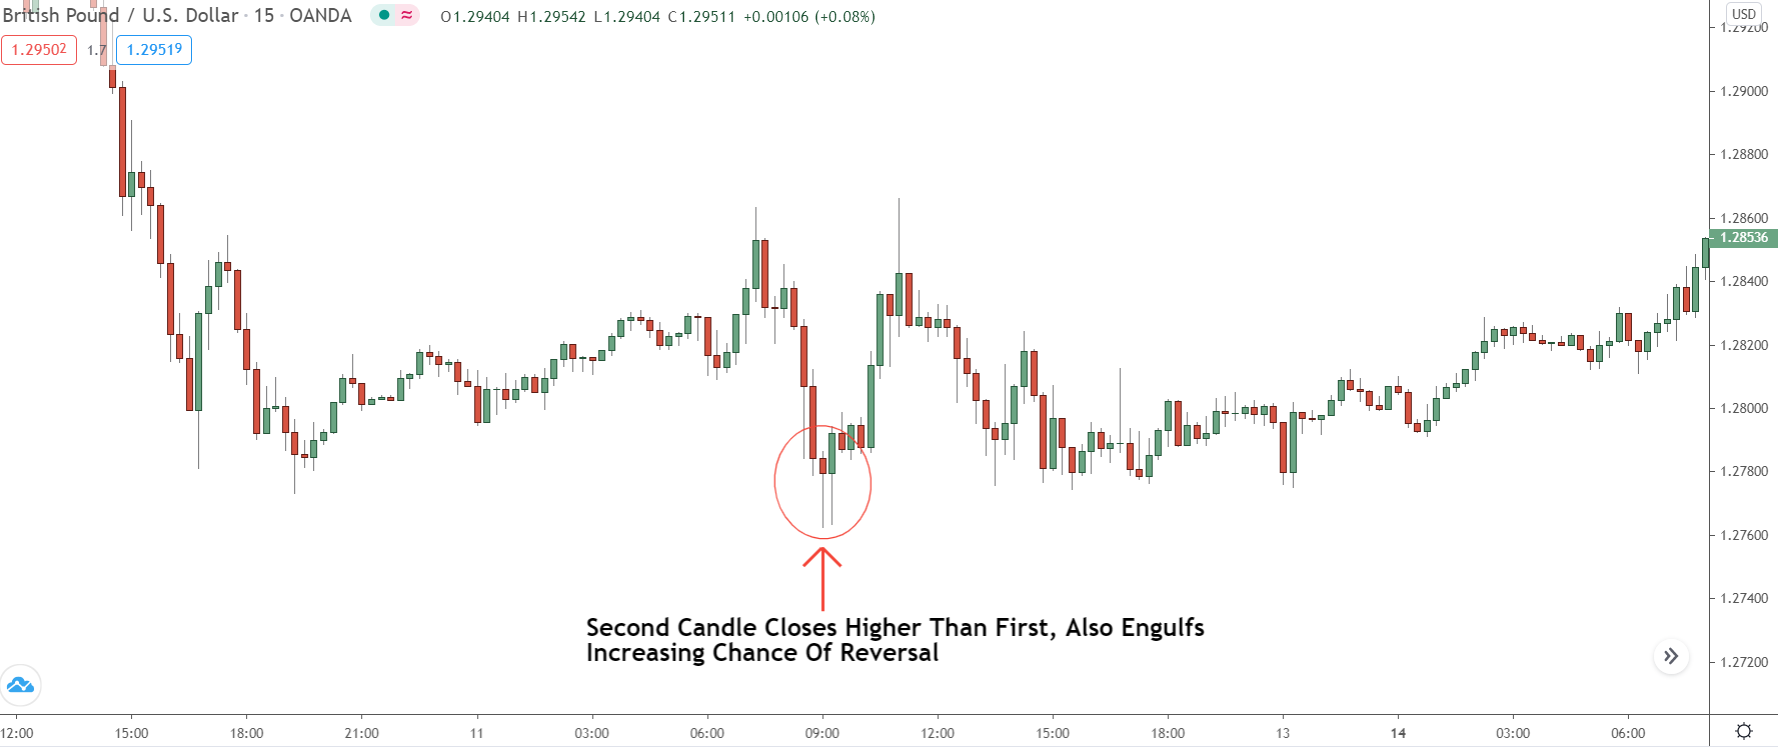
See how the 2nd candle closes high, showing a long lower wick?
These patterns, while they don’t show the bulls/bears have overwhelmed the other side, do show that they’ve pushed them right back and almost won the battle, which gives the pattern a good chance of causing a reversal.
Keep your eye open for patterns like the above; if you decide to trade two matching highs/lows.
Strategy #3 Bearish Outside Vertical Bar & Bullish Outside Vertical Bar
If you’ve read James16’s thread on Forexfactory, no doubt you’ve seen him take trades from patterns that look like this before…
To the uninitiated, these candles just look like bullish and bearish engulfing patterns – reversal patterns that form when the body of a candle closes bigger than the body on another, smaller candle. In reality, however, these are actually a special type of engulfing pattern known as bullish and bearish outside bars – and they’re one of James16’s best strategies.
Outside bars, or outside vertical bars as James calls them, are just like the engulfing candles we all know and love.
They form when price engulfs the body of the prior candlestick, and show the bulls or bears have beaten the other side and came out victorious. There’s one key difference, though…
Unlike engulfs, outside bars form when the engulfing candle is bigger than the RANGE of the prior candle.
In other words, not only is the body of the engulfing candle bigger than the body of the preceding candle, the highs and lows are also bigger; the high is higher, the low is lower. This is because the bear/bulls have not just beaten the other side, but exhausted them before taking control.
Outside bars are one of the James16 core strategies, and there some easy ways you can dramatically increase their profitably.
Here’s a small overview of what they look like and how to trade them.
Pattern 1: Bearish Outside Vertical Bar
First up, we have the bearish outside vertical bar.
A two-candle bearish reversal pattern, the bearish outside vertical bar, is a variant of the better known (and also worth watching) bearish engulfing pattern that only appears during uptrends/upswings or consolidations.
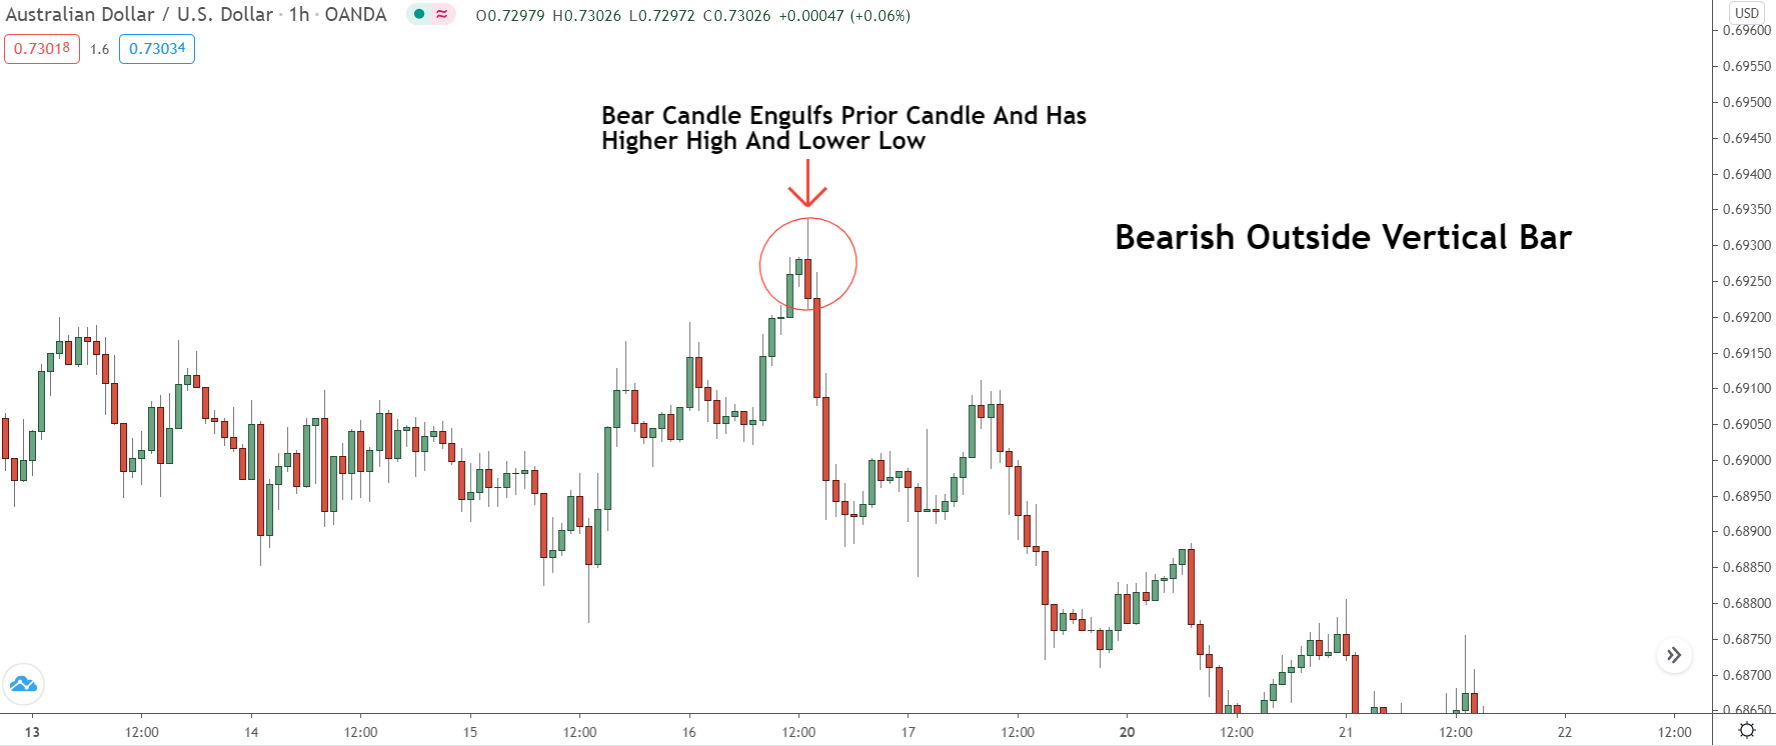
The pattern forms when price rises but falls swiftly on the next candle, resulting in a bearish candle followed by a larger bull candle, indicating a complete reversal of the prior momentum. Unlike the typical bearish engulf, the bearish outside vertical bar always has a lower low, higher high, and lower close than the preceding bear candle.
To Trade The Bearish Outside Vertical Bar, Follow These Steps:
- Watch for a bearish candle to form after a bullish candle.
- Check if the range of the bear candle is bigger than the bull candle – does it have higher high & lower low?
- Wait for the bear candle to close LOWER than the open of the bull candle.
- Once the candle has closed lower, enter a market order to sell.
- Place your stop loss above the high of the bear candlestick – 5 – 10 pips should be enough.
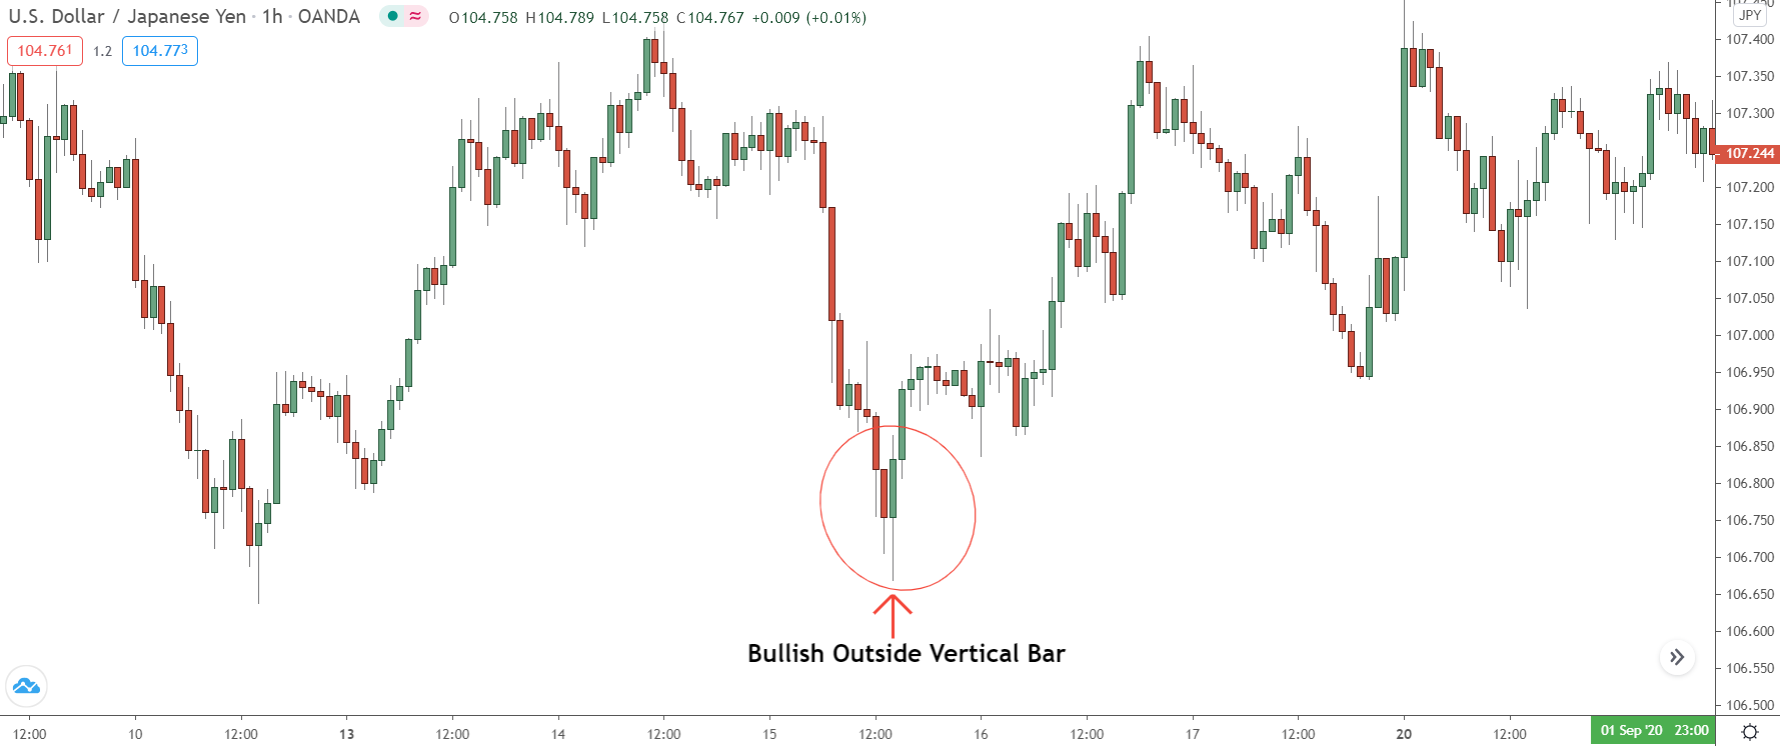
Pattern 2: Bullish Outside Vertical Bar
The “brother” of the bearish outside vertical Bar, the bullish outside vertical bar, is a bullish reversal pattern that only forms during downtrends/downswings or consolidations.
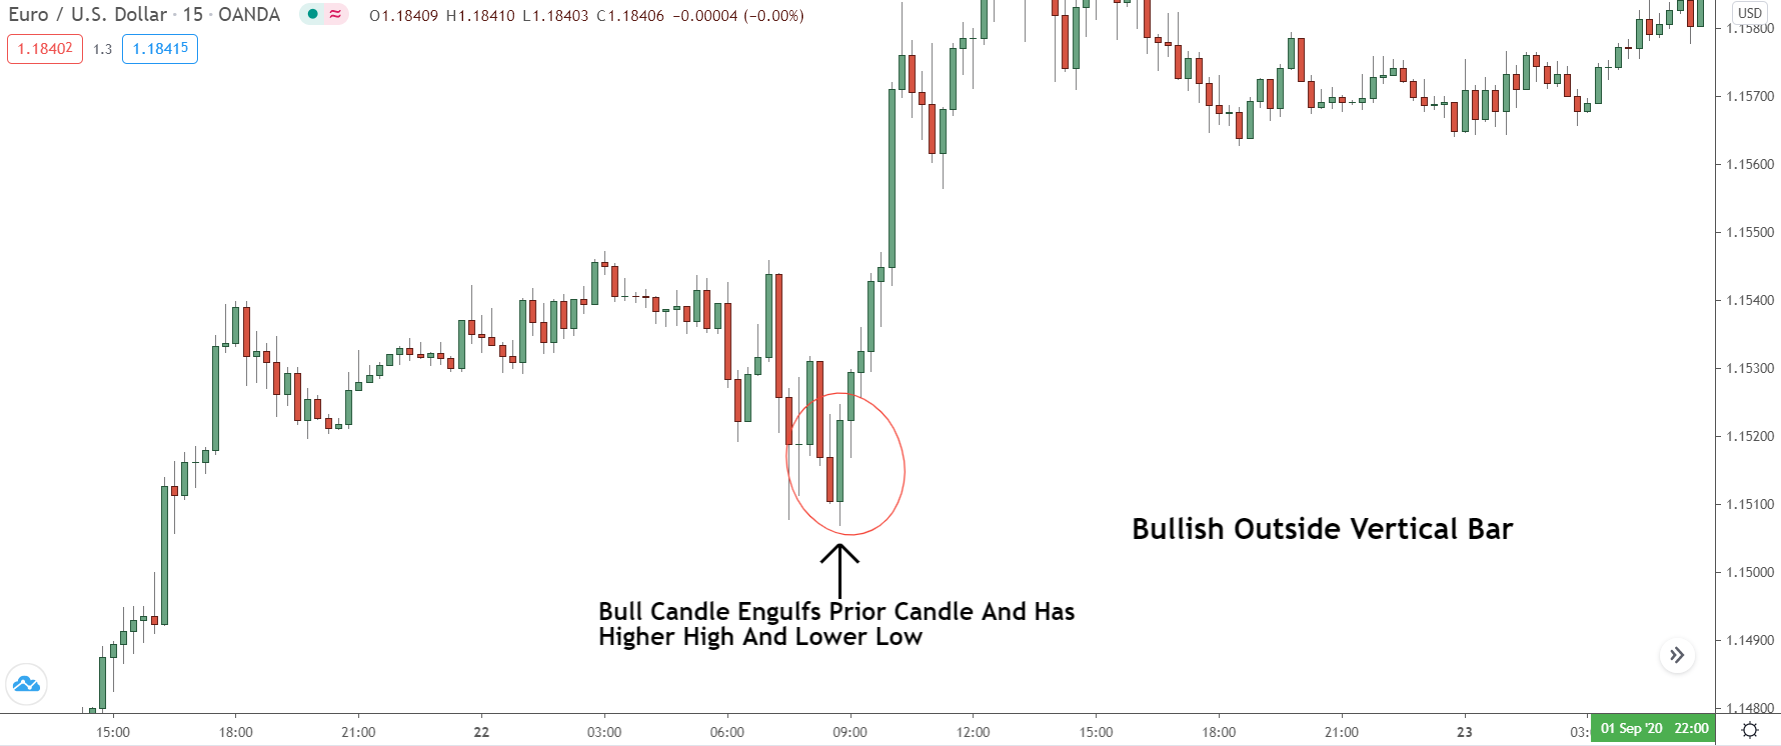
Like it’s brother, the bullish outside bar is a two candle pattern. The first candle is always bearish and is followed by a bullish candle that has a higher high, lower low, and higher close than the prior candle. It signals the bears have overwhelmed the bulls, making a reversal to the upside likely.
To Trade Bullish Outside Bar, Follow These Steps:
- Watch for a bullish candle to form after a bearish candle.
- Check if the range of the bull candle is bigger than the bear candle – does it have higher high & lower low?
- Wait for the bull candle to close HIGHER than the open of the bear candle.
- Once the candle has closed higher, enter a market order to buy.
- Place your stop loss below the low of the bull candlestick – 5 – 10 pips should be enough.
How To Improve Bullish And Bearish Outside Bars
Bullish and bearish outside bars are one of James16’s key setups, and while they work perfectly fine on their own, with a few simple tweaks, you can improve their success rate dramatically.
Here’s what you need to do…
1. ONLY Trade Bars From Technical Levels
As with most patterns on this list, if you want to really increase the success rate of outside bar, watch for them to form at important technical points.
If you read James16’s thread, you’ll know he watches for outside bars at two key points:
Support and resistance levels, and…
Fibonacci Retracements.
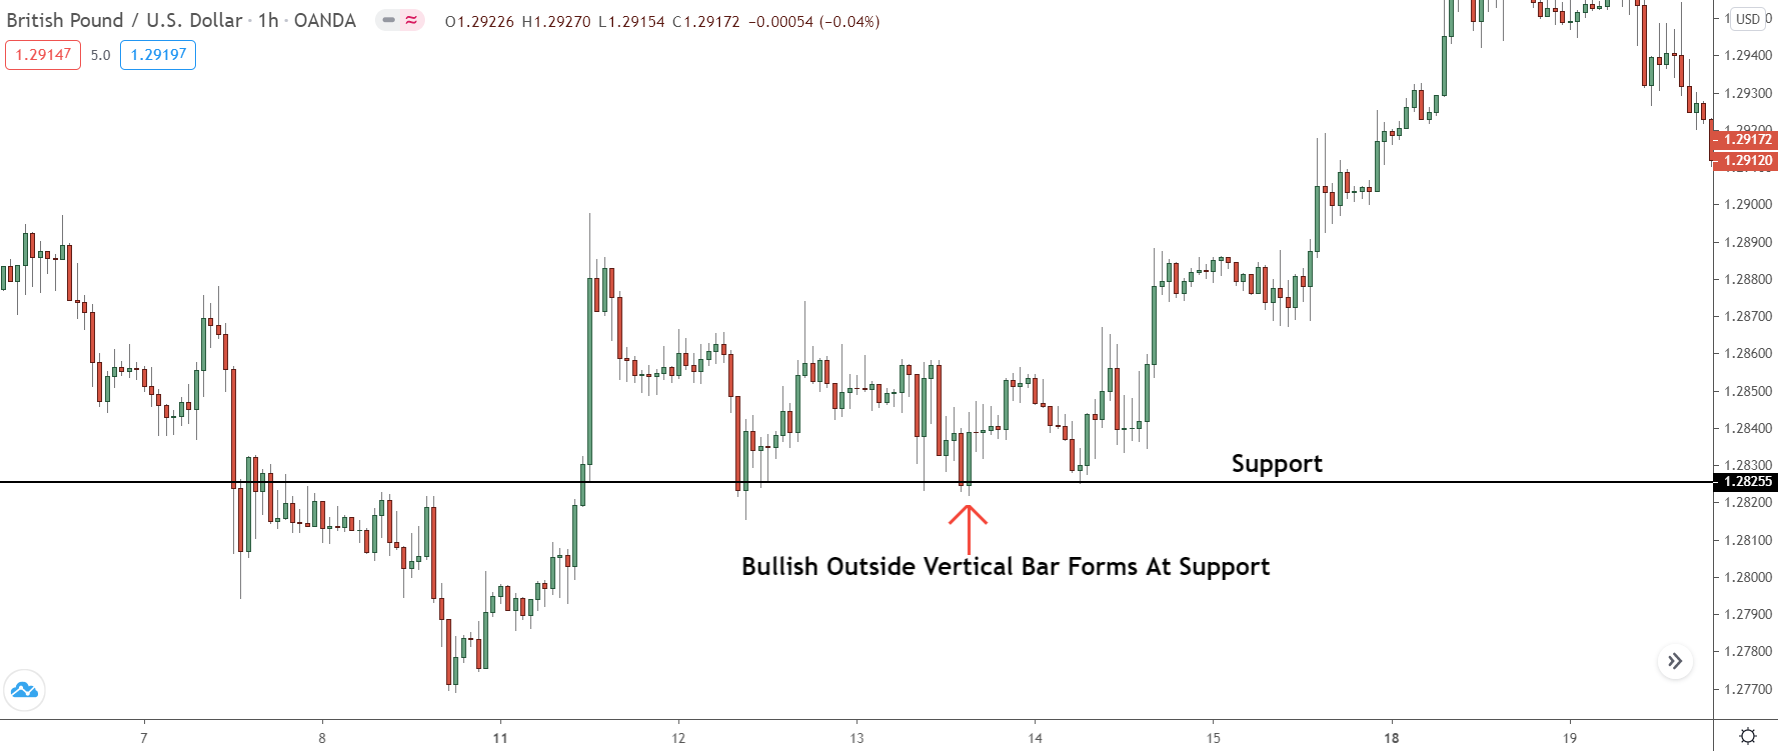
Seeing an outside bar form at a support or resistance level is typically a great signal. The level provides a likely point where price could reverse, and the outside bar confirms the banks want price to reverse away.
Fibonacci retracements also work well…
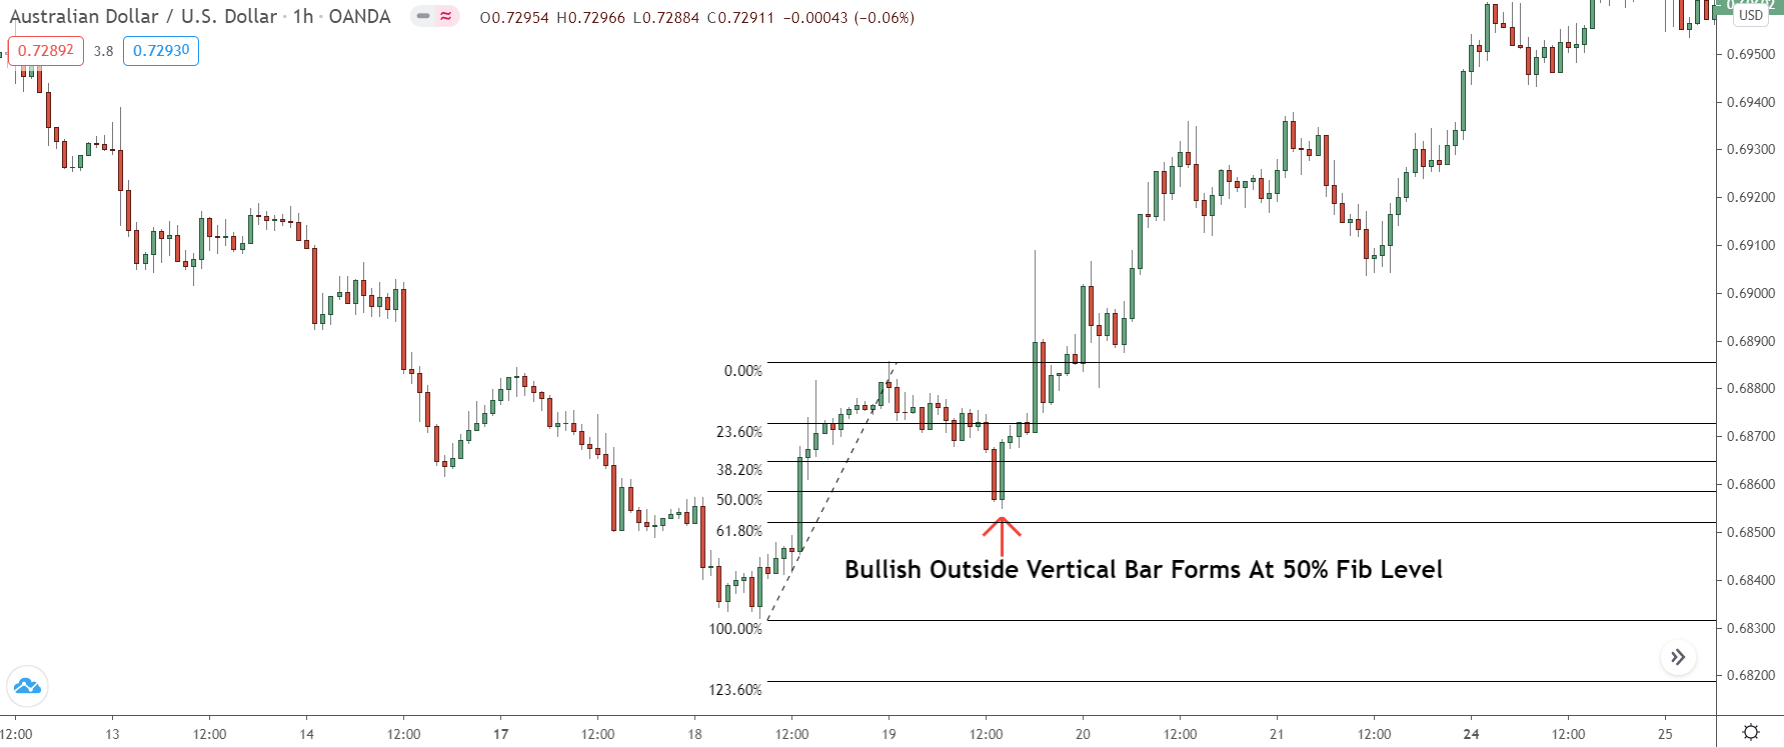
James16 mainly uses these to get into trends, waiting for price to retrace before entering when a pattern forms at one of the retracement levels.
Both methods can be enhanced further by seeing if the levels have confluence with other technical points.
For example, if a support level lines up with a fib retracement, that gives price a better chance of reversing because two points of interest are lining up at the same spot. The same is true if a retracement level lines up with an S & R level. The best points to watch for confluence are as follows…
- Support And Resistance Levels.
- Fibonacci Retracements.
- Big Round Numbers – Prices Ending in 000,0000.
- Supply And Demand zones.
2. DO NOT Trade Weak Patterns – Patterns With Small Candles
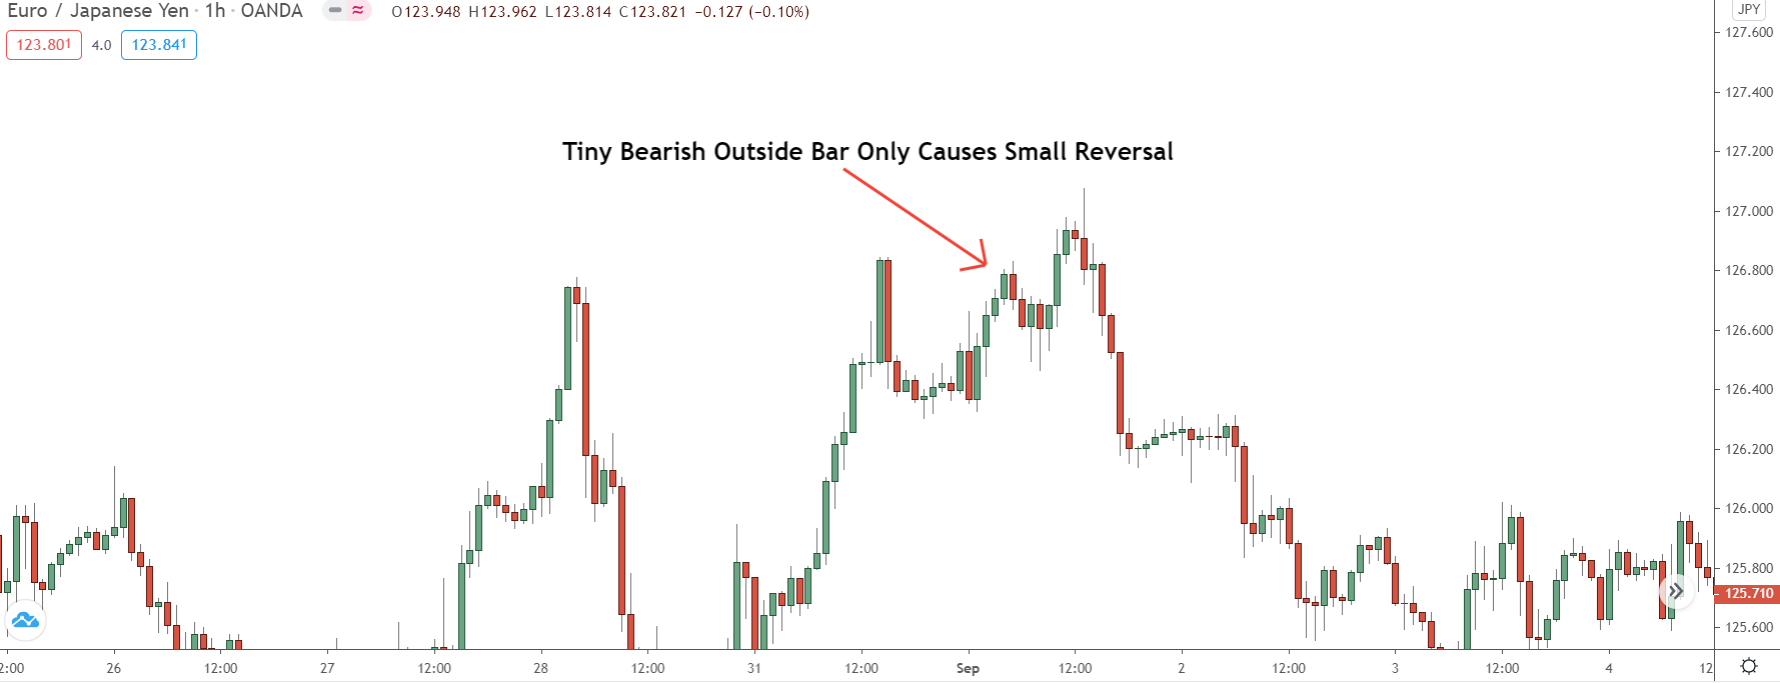
Outside bars come in all kinds of shapes and sizes. As a general rule of thumb: it’s a good idea to stay away from trading weak patterns; patterns where the 2nd candle is small like the first.
These have a low probability of being successful, owing to how outside bars form.
Outside bars form when the bulls and bears battle it out, with one side being ultimately beating the other. That’s why we see 1. price engulf the prior candle, and 2. the low or high (depending on the pattern) of the engulfing candle form higher/lower than the previous candle – it shows exhaustion from the losing side.
But here’s the thing to remember…
The body size of the engulfing candle reveals how badly the other size was beaten.
If an outside bar forms with a significantly bigger body than the prior candle, that shows the other side got completely overwhelmed. The momentum behind the reversal is much, much higher, giving price a better chance of reversing.
So, to improve your win rate with outside bars – and engulfs too actually – only trade the big patterns…
They reveal more momentum (strength) behind the reversal, meaning: price has a significantly higher probability of reversing. The only exception to this are patterns where both candles are large, like you what you see below…
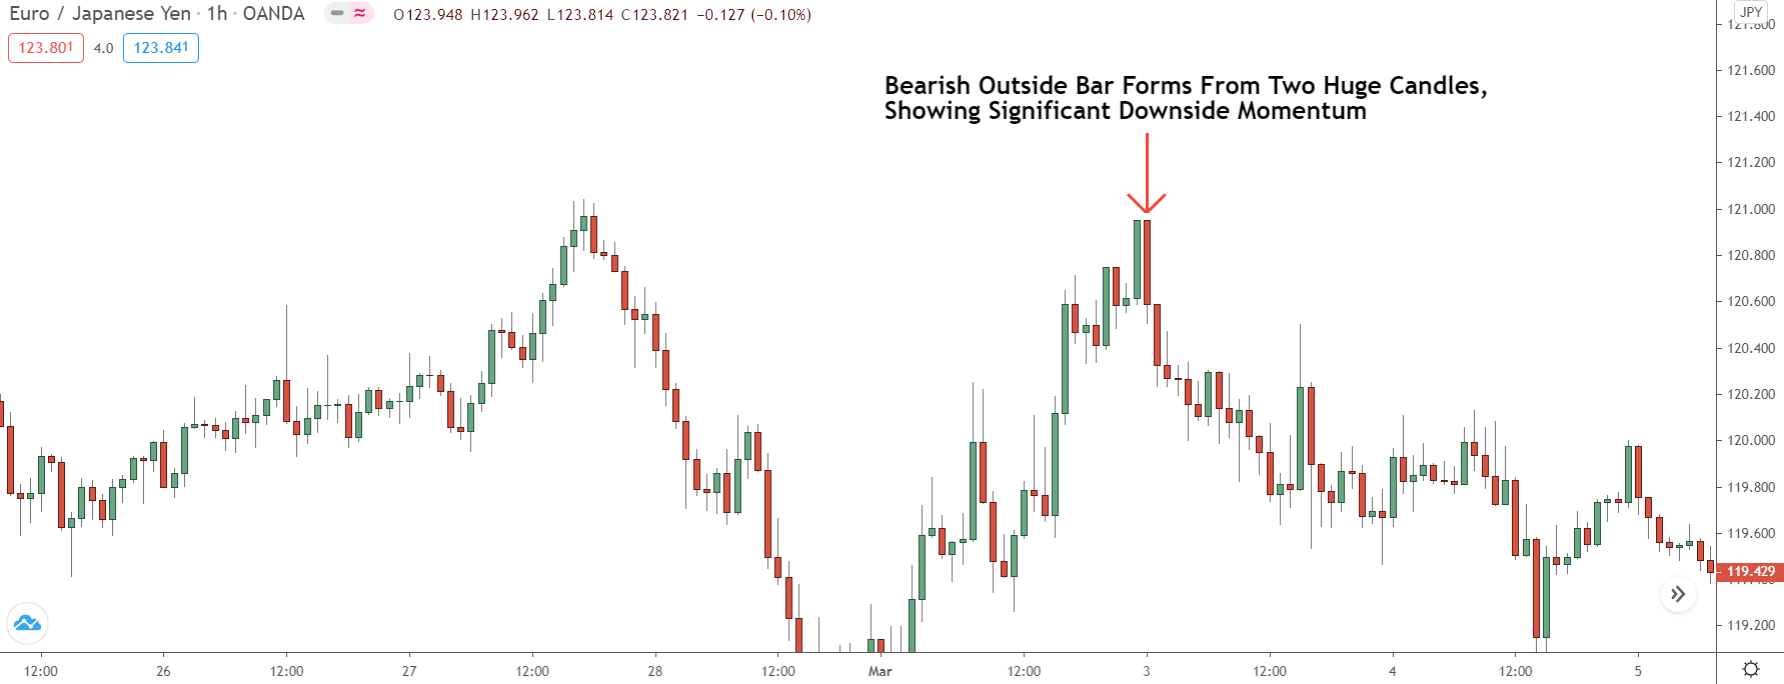
These are good patterns; keep your eye out for them.
While they don’t show one side has dominated the other, like the patterns mentioned above, the preceding candle being big means it still took significant momentum for the bulls to beat the bears. That momentum is highly likely to continue on the next candle, giving the pattern a good chance of causing a reversing once it completes.
You Can Use Outside Bars With Supply And Demand Zones Too…
Since they’re essentially engulfing patterns – just a different type – you can also use bullish and bearish outside bars as entry signals into supply and demand zone trades.
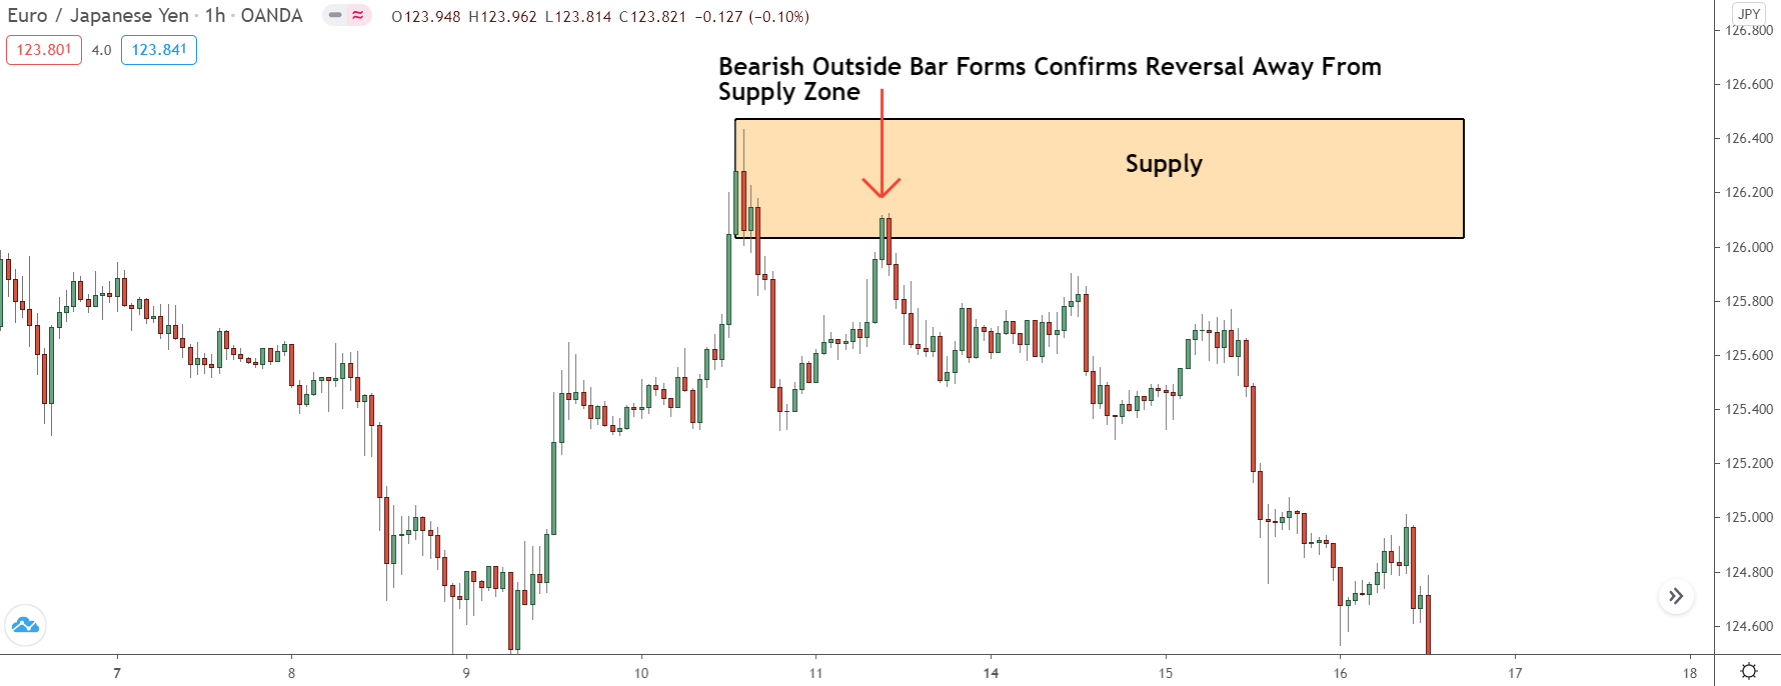
Simply wait for price to enter a zone, see if a bullish or bearish outside bar forms (bullish for demand zones, bearish for supply zones), then enter a trade and put your stop slightly above the opposite edge.
If everything works out, price should reverse and give you a successful trade.
Simple.
Strategy #4 Bullish And Bearish Pin Bars
And finally, we come to what is probably James16’s most iconic (and arguably) most useful trading strategy of all…
Trading bullish and bearish pin bars.
Now, you’ve likely seen or heard about pin bars before…
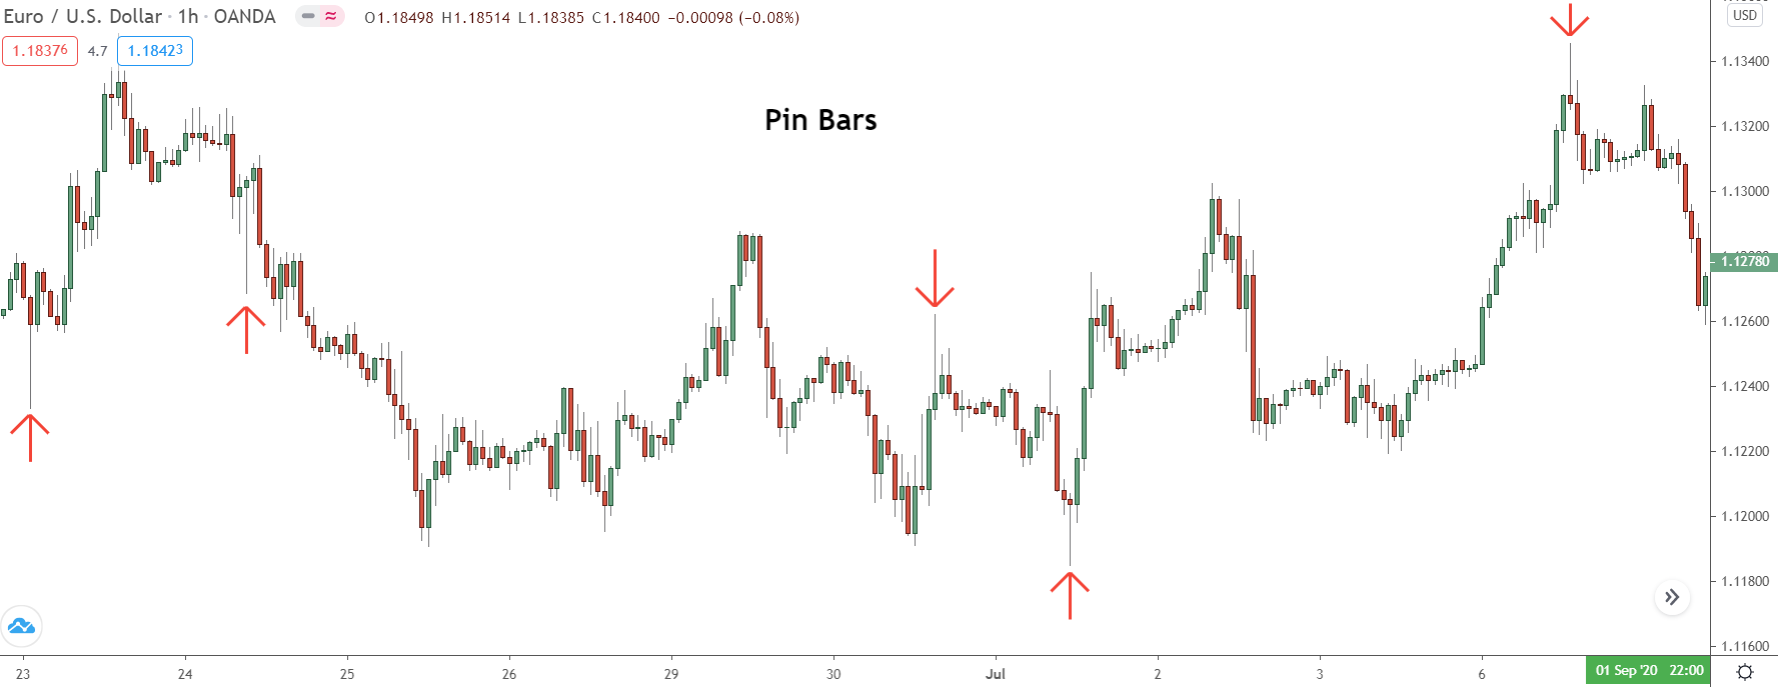
They’re the candlesticks with really big wicks; you know that stand out from price?
While pin bars were around way before James16 came on the scene – they were called hammer candlesticks back in the day – it was only when he started his thread they explored in popularity; becoming one of the most popular price action reversal patterns. Pin bars are highly versatile, being traded, and used in lots of different ways.
James16 uses them mainly with S & R levels, but there many other tricks and techniques you can use to improve them further and make them even more useful – more on this in a minute.
First, lets quickly look at each type of pin bar.
Pattern 1: Bullish Pin Bars
The bullish pin bar is a single candle reversal pattern that forms during downtrends, downswings, or consolidations, and signals a reversal to the upside.
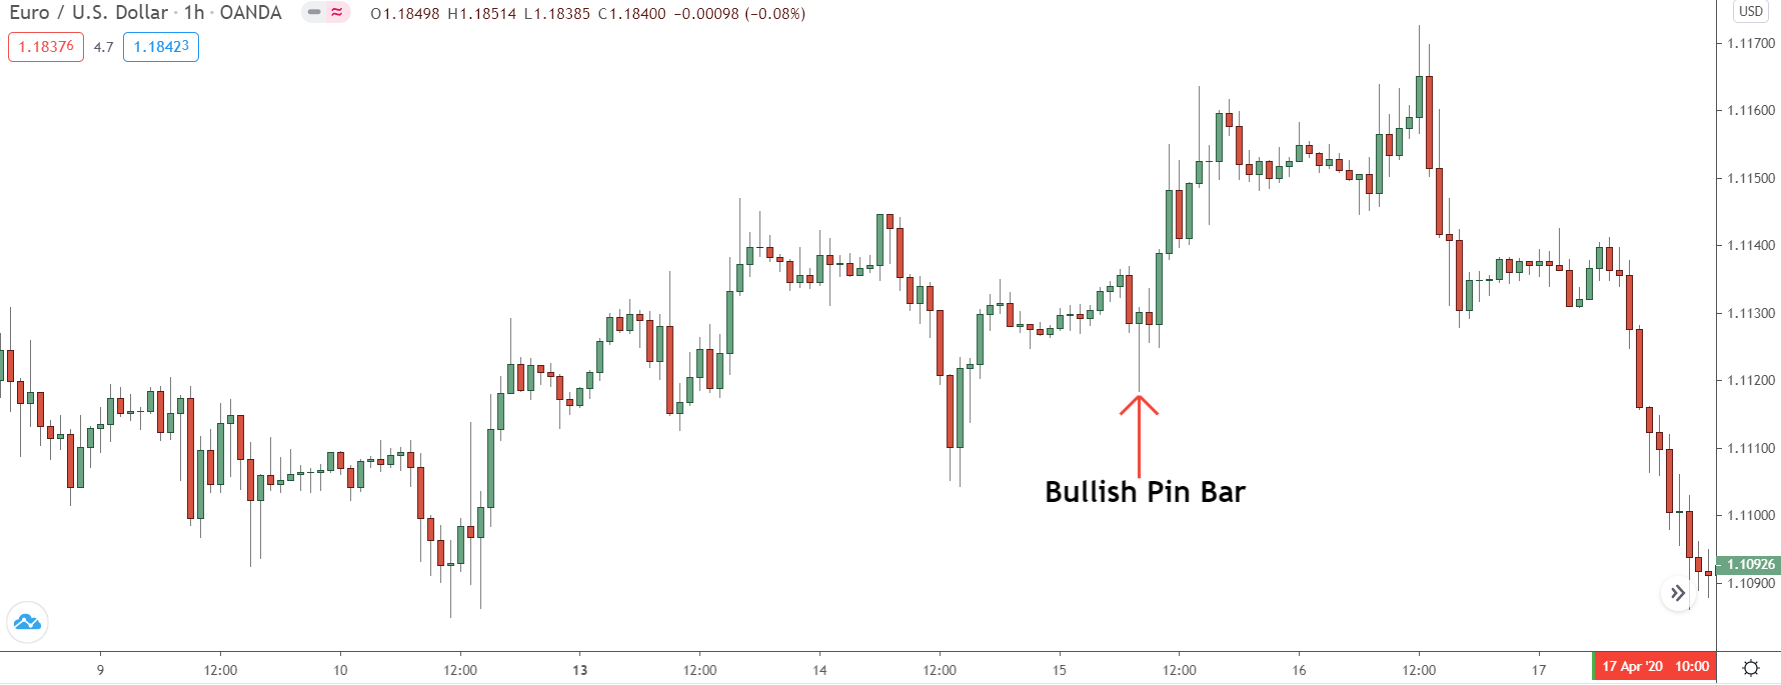
One of the most common patterns in all of forex, the bullish pin bar forms when the banks buy into heavy selling, causing a candlestick with a long lower wick and small body to form. You often see bullish pin bars form at major reversal points, creating significant swing lows.
To Trade Bullish Pin Bars, Follow These Steps:
- Watch for a candle with a long LOWER wick to form during an downtrend or downswing.
- Enter a market order to buy once the candle closes.
- Place your stop loss 5 – 10 pips below the low of the candle.
Pattern #2 Bearish Pin Bars
The bearish variation of the pin bar, is of course, the bearish pin bar. This pattern only forms during downtrends, downswings, or consolidations.
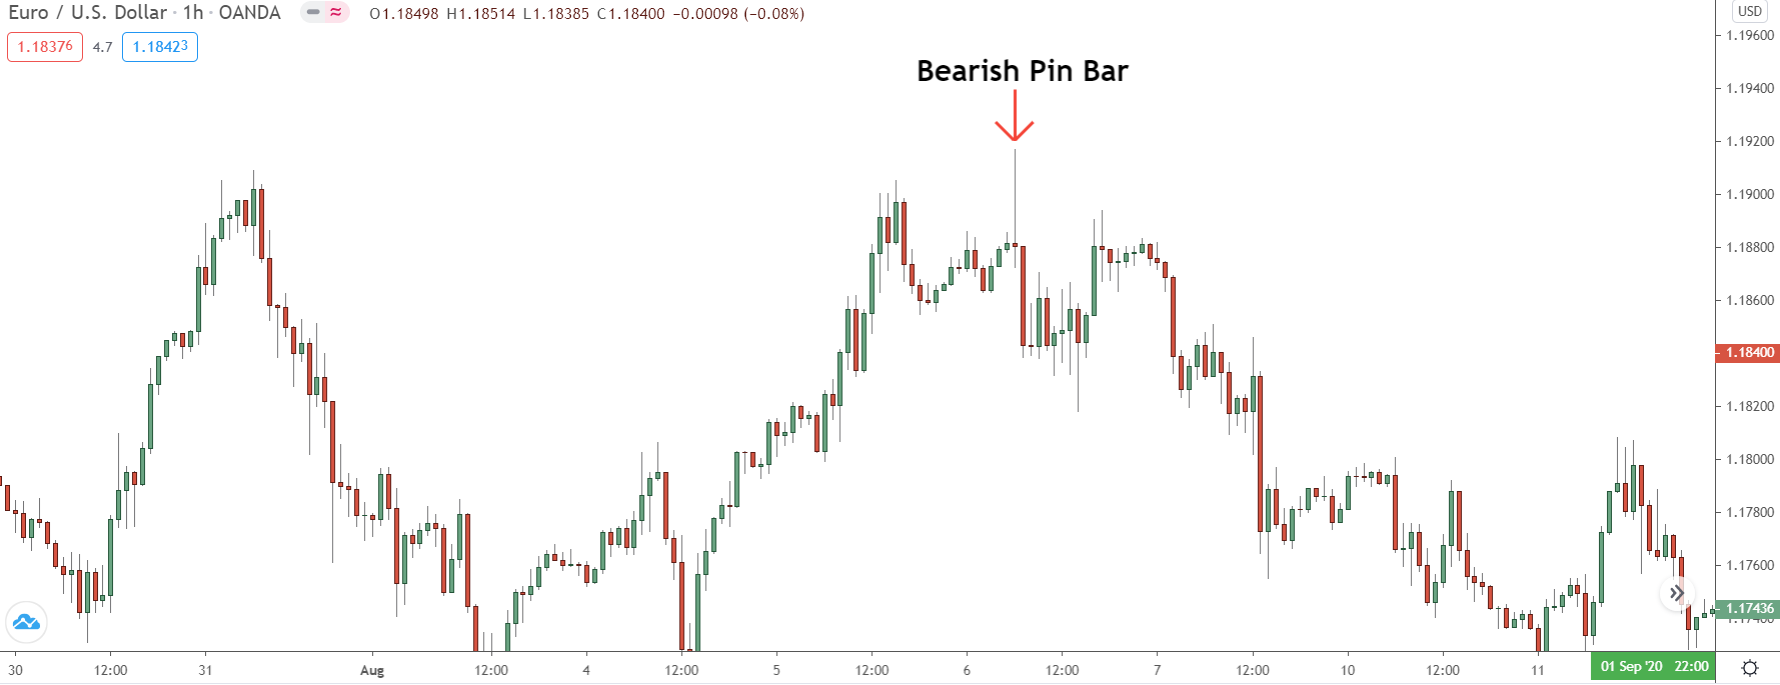
Like it’s brother, the bearish pin bar is very common in forex. It forms when the banks sell into significant buying pressure, resulting in a candle with a long UPPER wick and small lower wick that indicates price could be about to reverse. Both the bearish and bullish pins can close either bullish or bearish.
To Trade The Bearish Pin Bar, Follow These Steps:
- Watch for a candle with a large UPPER wick to form during an uptrend or upswing.
- Enter a market order to sell once the candle closes.
- Place a stop loss 5 -10 pips above the high of the candlestick.
How To Improve Trading Pin Bars
For the most part, James16 trades pin bars in much the same way I do; by waiting for them to form at important technical points, such as support and resistance levels.
However, I know a few little tricks that you can use to enhance them further.
Let’s take a look…
#1 Only Trade Pins That Close The Opposing Colour
Everyone knows pin bars with big wicks that stick out from the surrounding price action have a higher probability of being successful… it’s price action 101.
But what many don’t know are pins that close in the direction of the reversal also have a better chance of causing a reversal.
For example…
A bullish pin that forms at the end of a down move has a higher probability of causing a reversal if it closes bullish rather than bearish. Because closing bullish means, on a lower timeframe, price has engulfed the preceding candle, changing the prior momentum and turning the pin bullish.
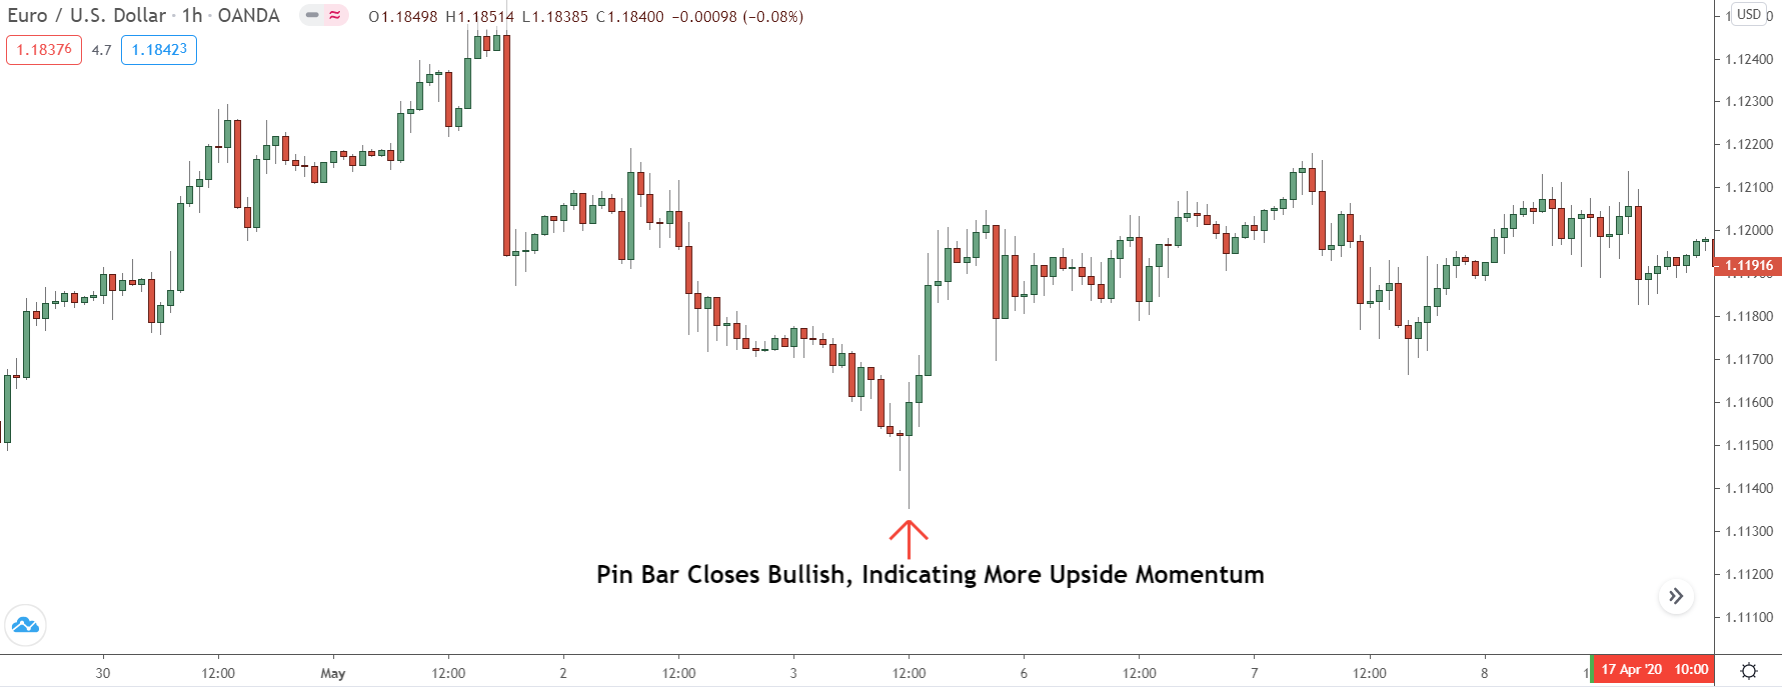
So, if you want to quickly improve your pin bar win rate, STOP trading the pins that form the opposite to the reversal they indicate, and ONLY trade the pins that form the same way, as I showed above.
That’ll allow us to trade the high probability pins while avoiding the low probability signals.
Easy.
#2 Watch For Pin Bars To Form Technical Levels – Especially Supply And Demand Zones
The easiest and most obvious way to improve your success rate trading pin bars is to wait for them to form at significant technical points, such as support or resistance levels or, (my favourite), supply and demand zones.
James16 uses technical levels to filter trades, which works really well.
The thing is, he only focuses on actual levels; the three main ones being support and resistance levels, Fibonacci retracements, and sometimes trend lines.
These levels, though they work well and are certainly better than trading pins in isolation, all have the same problem that drastically limits their usefulness…
That being: The levels are single lines that only cover one or two prices.
Being lines means price doesn’t always touch the level and form a pattern (a pin in this case) before reversing, which usually results in you missing the trade and reversal – seen this happen before?
For this reason, it’s much better to trade pins from zones, like supply and demand zones, for example…
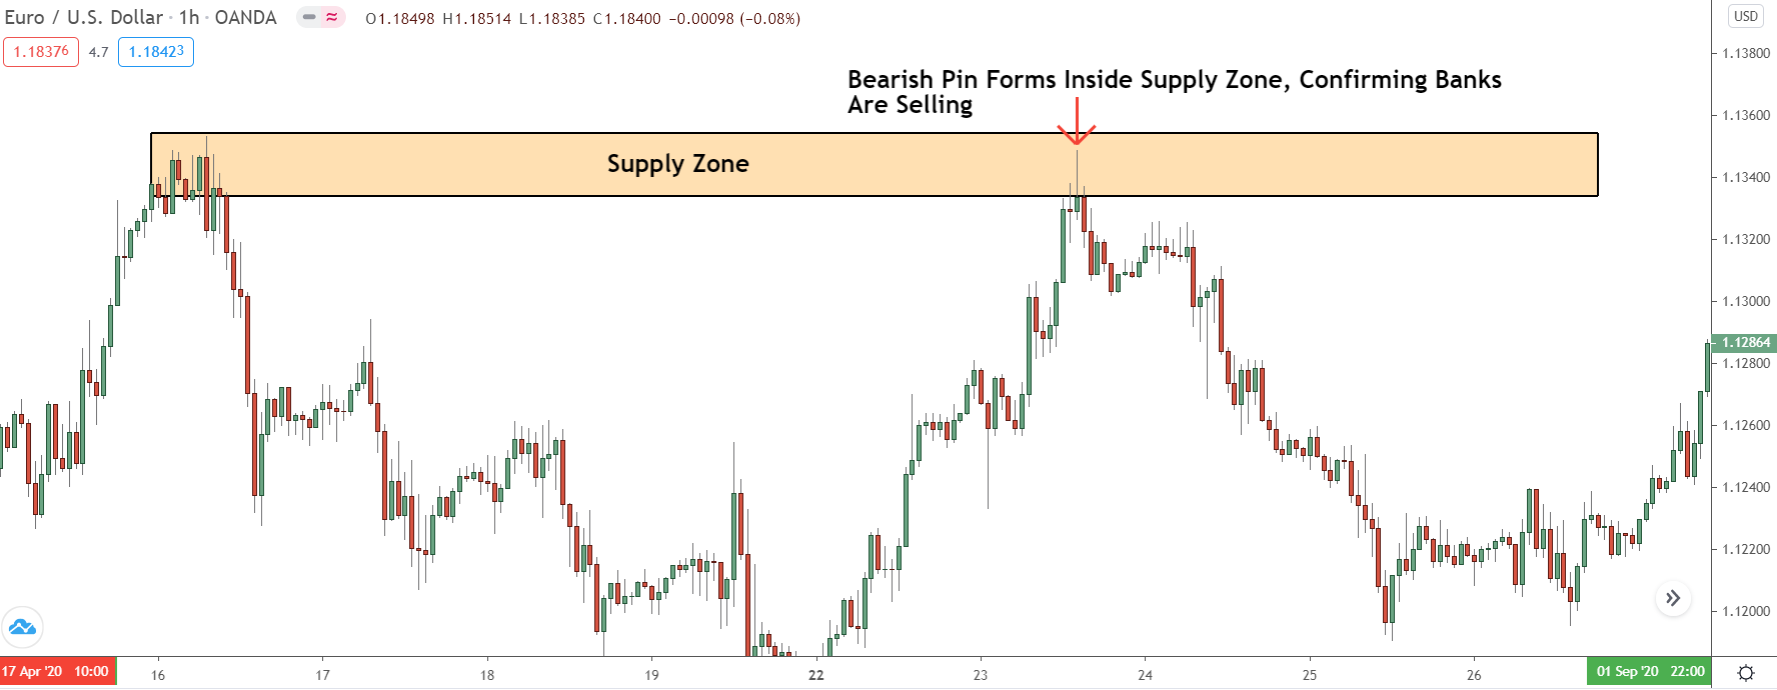
Zones give price a much bigger area to reverse in, increasingly the likelihood the pin will form inside and give a valid entry signal.
Supply and demand zones also form from the banks buying and selling, so seeing a pin form within is often great confirmation the banks are placing trades to start a reversal.
The Bottom Line
Take what you can from these strategies, and try them out yourself.
Like I said – you don’t need to trade them all to be successful.
One or two combined with a couple of setups, like trading stop hunts or fib retracements, is enough to create a method with a lot of depth behind it. And with multiple signals to what out for, your bottom line will be much more even, making it easier for you to generate consistent profits.