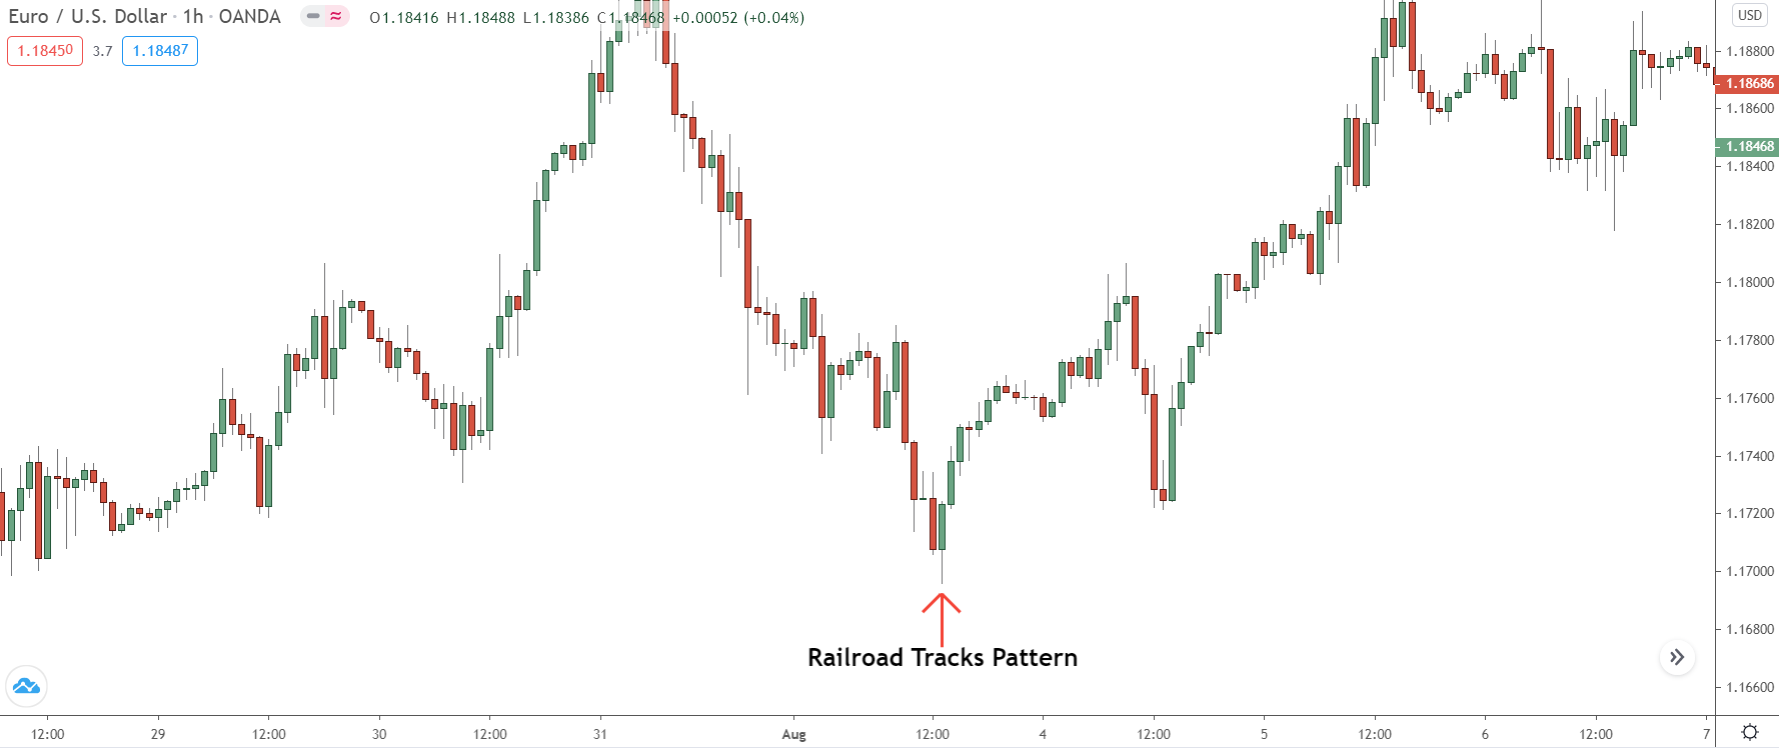
Let me introduce you to the “Railroad Tracks” pattern.
A lot of traders chase after more famous patterns, but this simple, reliable formation pops up all the time in forex. And when it does, it’s often a strong signal that a reversal is brewing.
The Railroad Tracks pattern deserves more love. That’s why I’m here to break it down for you, so you can add it to your trading arsenal.
We’ll cover everything you need to know:
What the pattern looks like and how to spot its bullish and bearish versions
My top two tips for using it in your trades
Where to set your stop loss for smart risk management
When to take profits to lock in those gains
Ready to discover the power of the Railroad Tracks pattern?
Let’s get started!
Railroad Tracks Pattern: What Is It And How Does It Form?
“The Railroad Tracks” is a simple two-step pattern that usually pops up at the end of trends or large price swings in the market.
Seen these before?
First, price makes a sharp sudden move, which causes a large bullish or bearish candle to appear on the chart. But right after that, on the next very next candle, an almost equally large candle forms in the opposite direction.
Put these two candles side by side, and they look like, you guessed it, railroad tracks!
Just like most patterns, the Railroad Tracks pattern has two different types:
Bullish Railroad Tracks
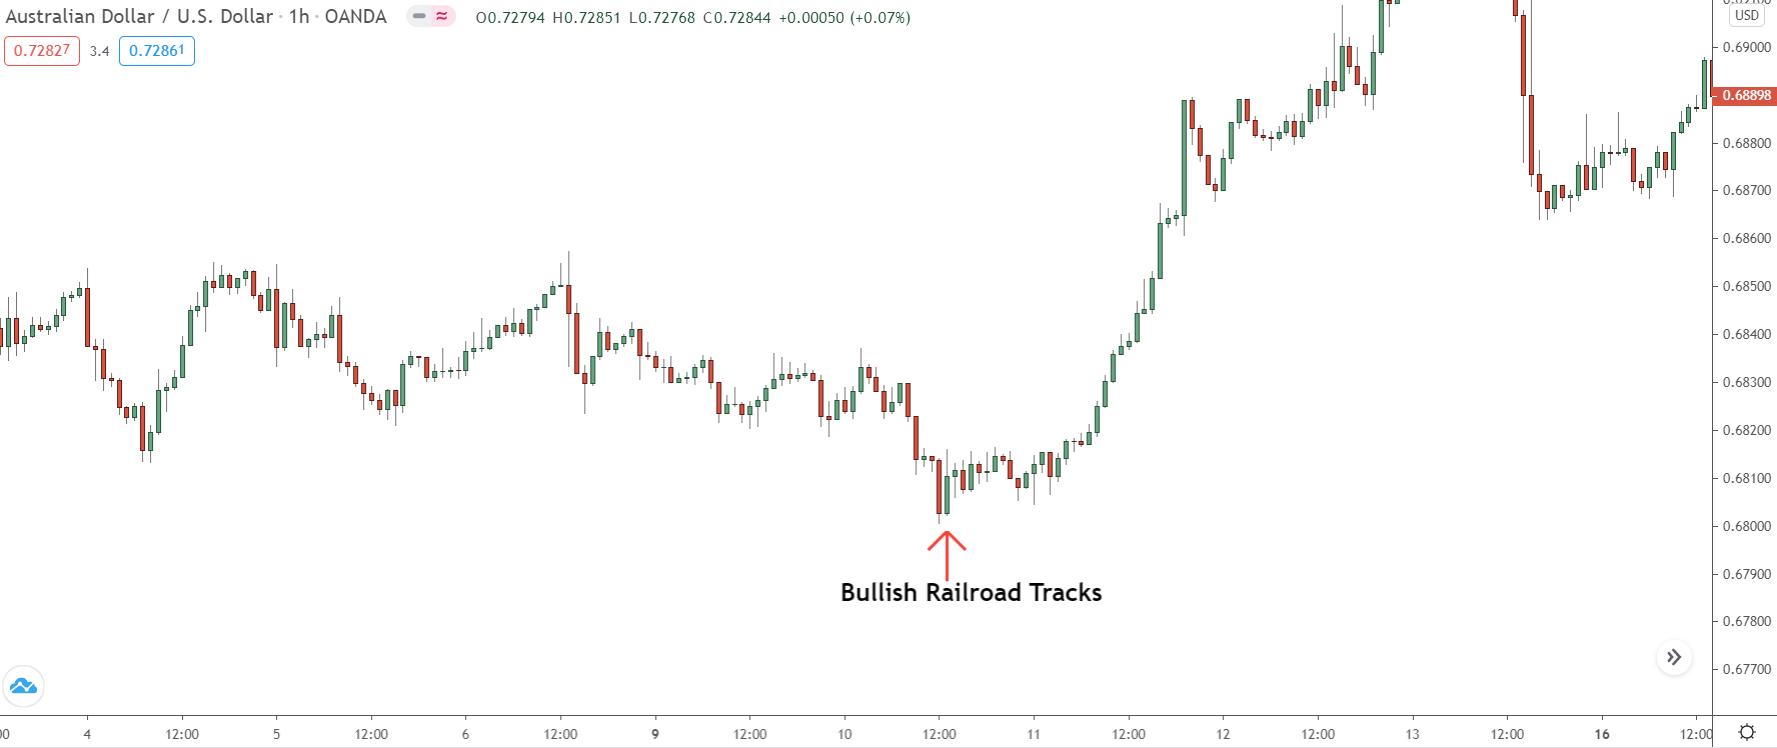
The bullish Railroad Tracks is the bullish variant.
Appearing mainly during downmoves or downtrends, this pattern signals a potential reversal to the upside upon formation.
Here’s how it works:
First a large bearish candle forms, which shows prices have been falling. But then, a strong bullish candle follows, and it’s almost as big as the bear candle! This wrestling match between the bear and the bull means we might see prices reverse and move higher.
To know it’s a real bullish Railroad Track, you need to look for:
- Two candles standing next to each other; a bear candle followed by a bull candle.
- Both candles need to be about the same size.
- The second candle (the bull) must not close higher than the first.
Bearish Railroad Tracks
The bearish Railroad Tracks, as you might have guessed, is the bearish variant of the pattern. Its formation indicates a possible reversal to the downside.
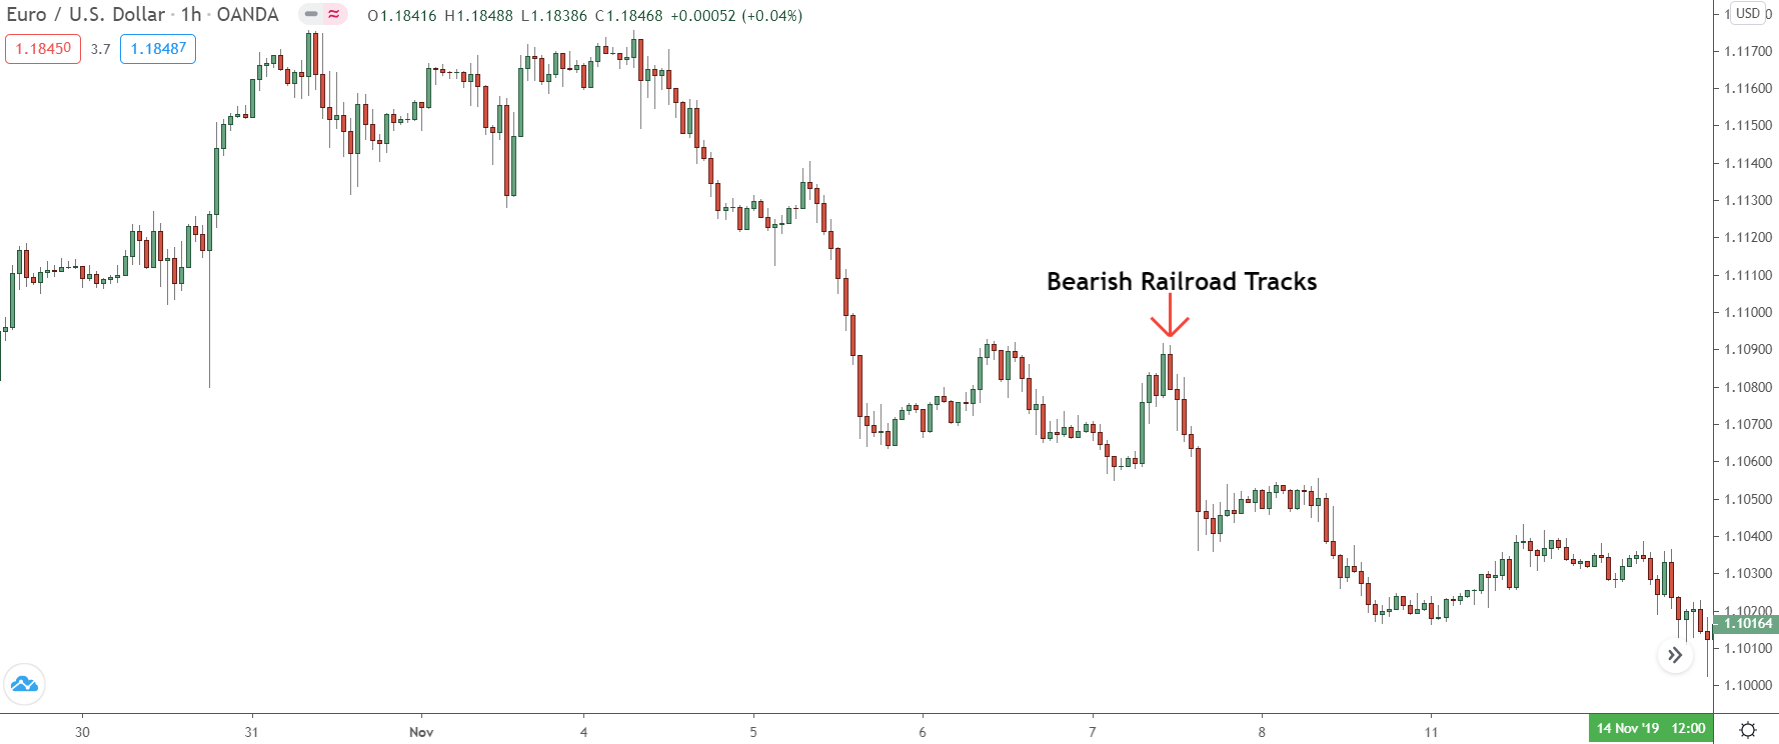
The bearish pattern forms when a large bull candle is followed by a large bear candle that’s eats up most of the bull candle.
For a real bearish Railroad Track, check for:
- Two candles standing side by side; a bull candle followed by a bear candle.
- Both candles should be about the same size.
- The second candle (the bear) mustn’t end lower than the first one.
Railroad Tracks usually appear at the end of uptrends or large upswings.
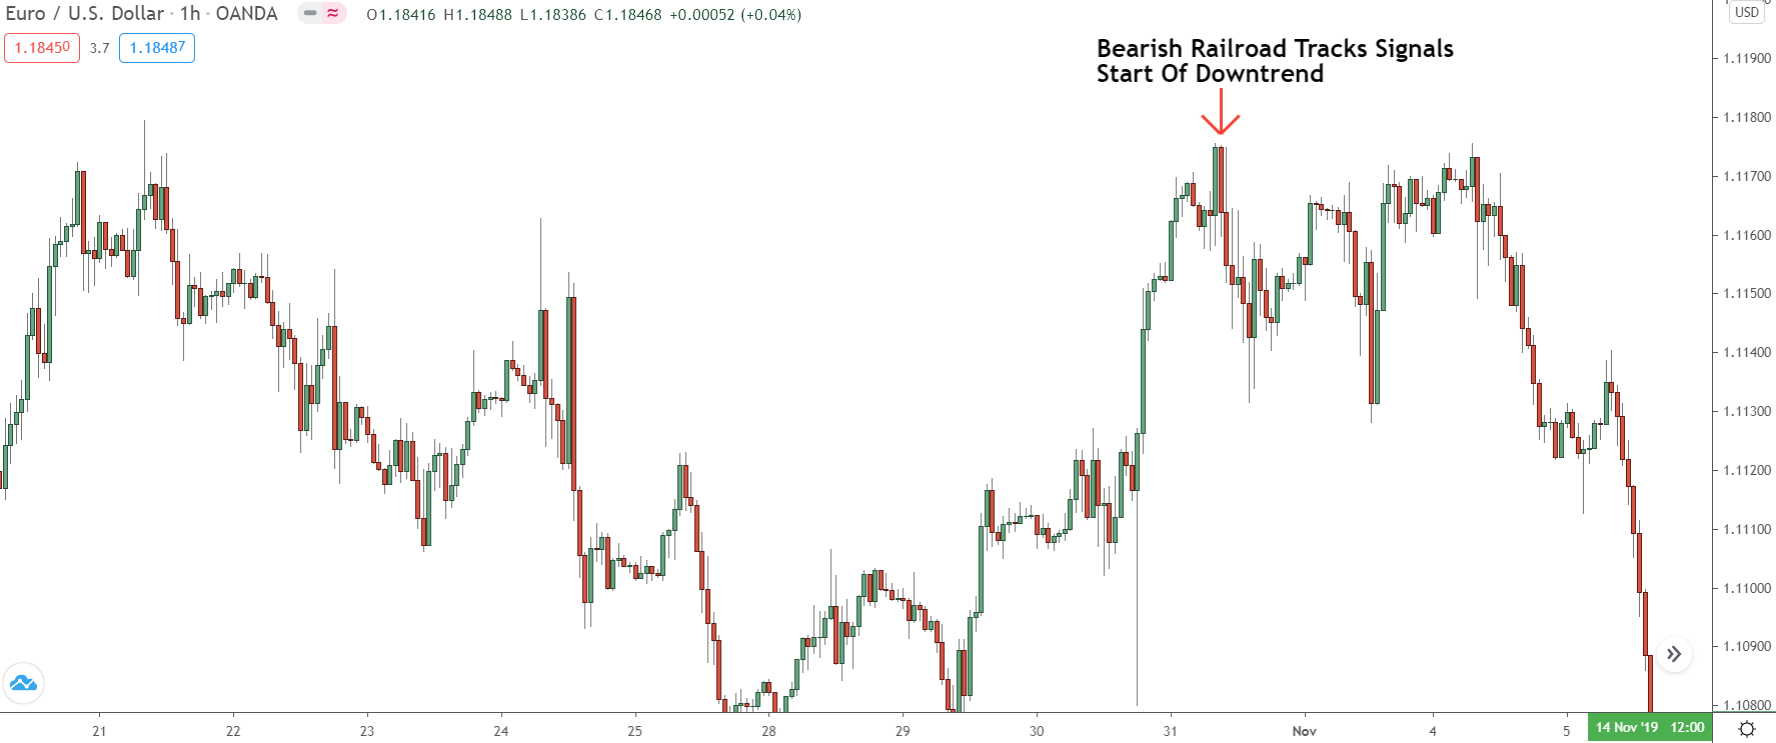
You can see this pattern signalled a reversal of the uptrend, resulting in a new downtrend beginning.
Remember: On it’s own, the pattern isn’t a great sign price is about to reverse.
So you need to combine it with other key technical points – like support and resistance levels, and supply and demand zones – to really get a high probability signal the current trend or swing could be about to reverse and change direction.
The Psychology Behind The Railroad Tracks
In terms of psychology, the Railroad Tracks pattern shows the bulls or bears, after being into almost total control, have been blown away by the other side, revealing their true momentum.
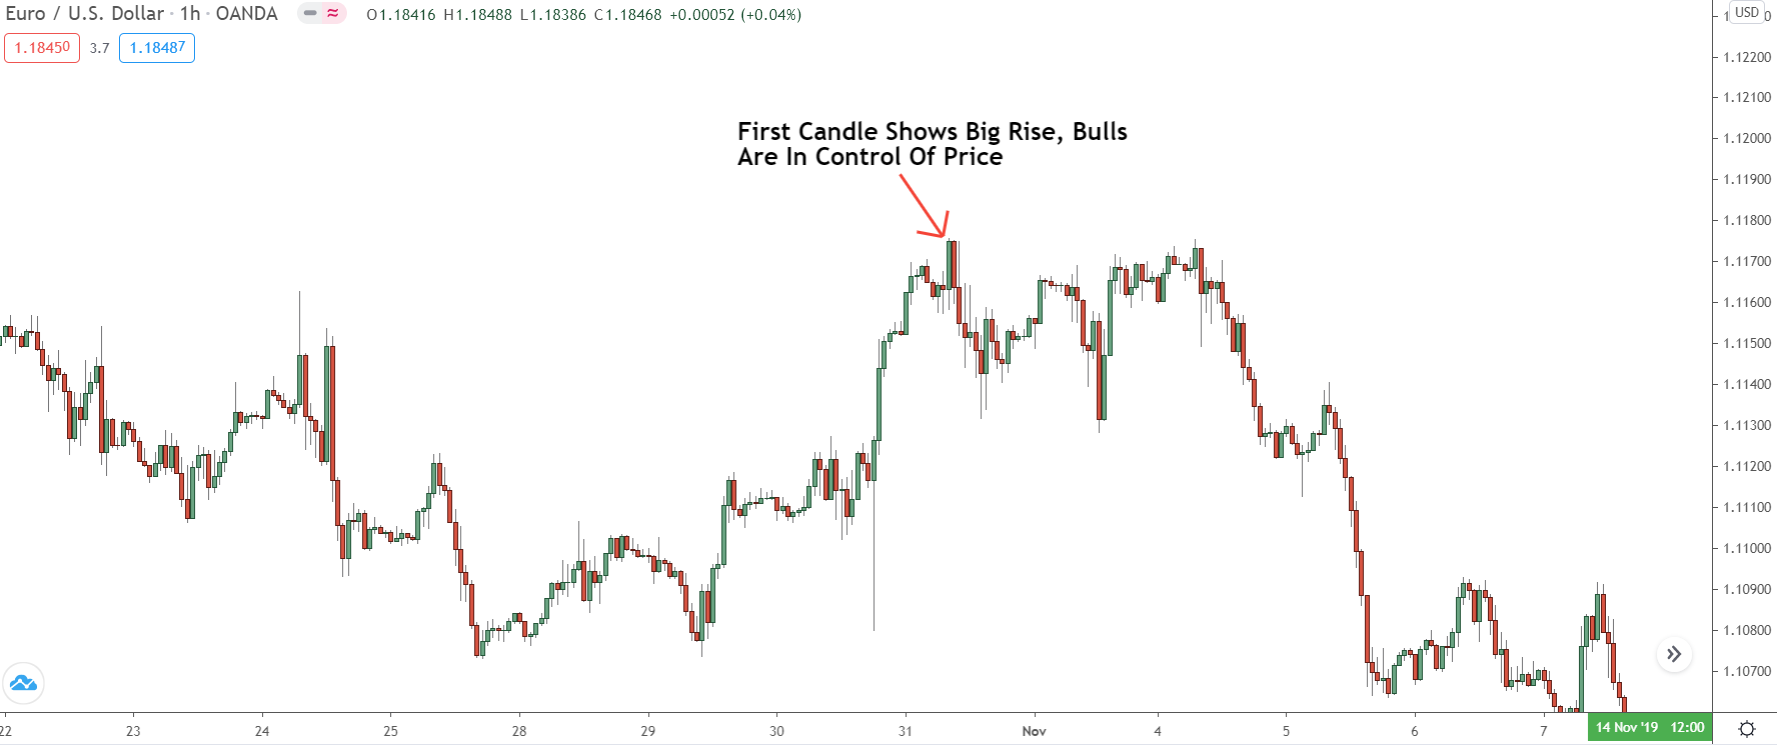
The first candle in the pattern, which always shows a strong price move, reveals the bulls are in total control. All the momentum is with them, which is why the candle is so large.
Then we get the second candle…
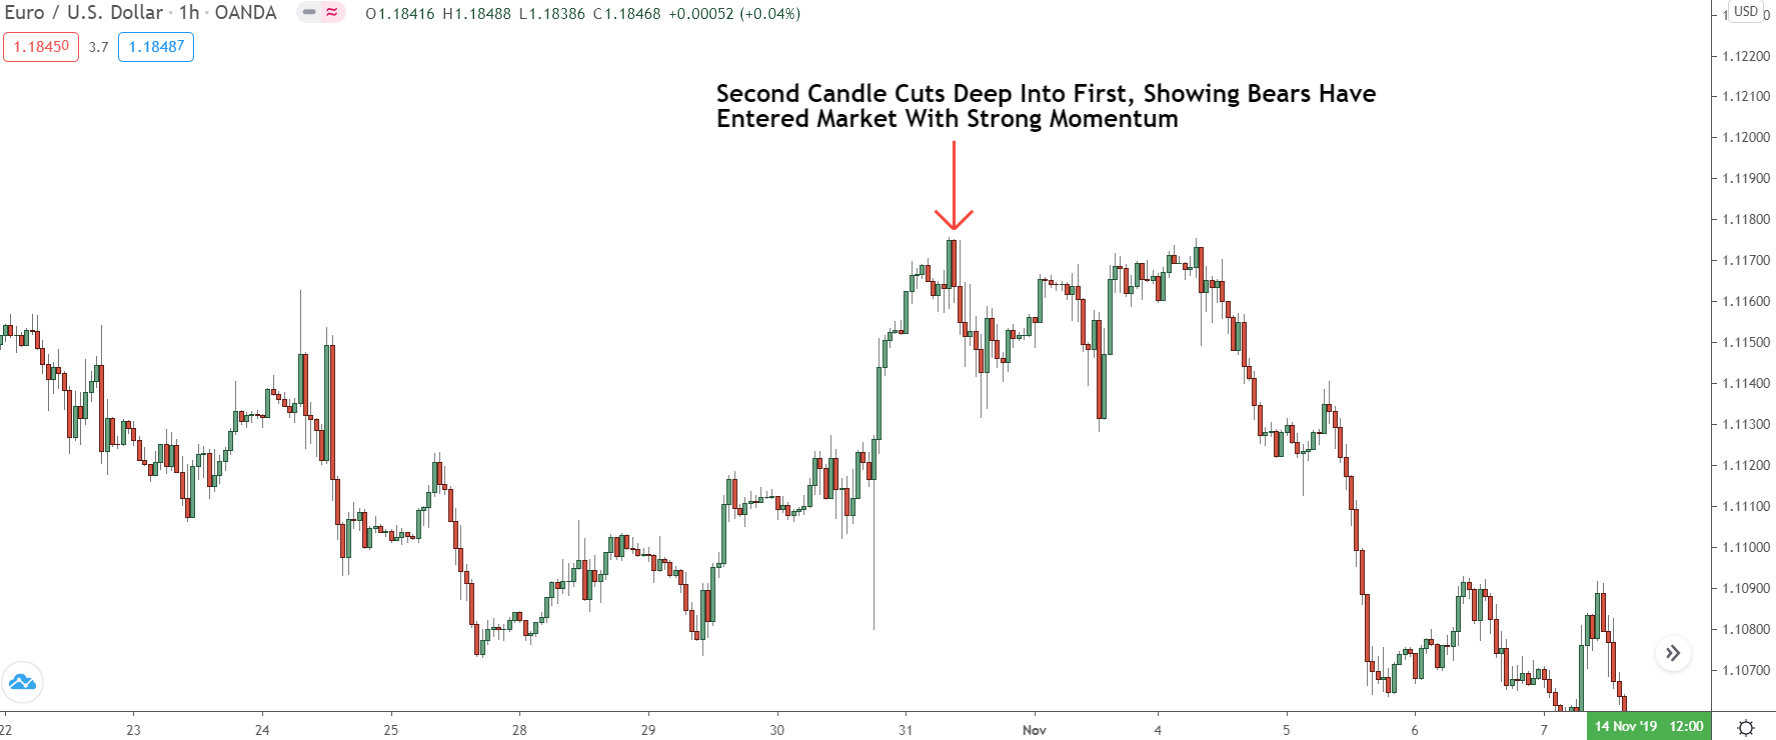
This is always appears the opposite of the first candle and pushes price almost back to the open of the first candle. It shows the other side (bears in our case) have entered the market with much more force (momentum) than the bulls.
The bulls thought they had the upper hand when actually the bears had much more in reserve.
How To Use The Railroad Tracks Pattern In Your Trading
While the Railroad Tracks doesn’t appear anywhere near as often as some of the more popular candlestick patterns, it’s still well worth watching for, and there are a couple of really useful ways you can use it in your trading.
Here are my two favourite ways to use them…
#1 Entry Signal Into Supply And Demand Zones
It’s super frustrating when you see price return to a good supply or demand zone, but then fail to form a pattern inside.
That means there’s no clear signal to jump into the potential reversal.
A cool way to fix this: Look out for more patterns.
That’s where our buddy ‘Railroad Tracks‘ comes in handy.
This pattern forms when one candle closes deep into the one before it, almost closing beyond like an engulf. So, the ‘Railroad Tracks’ acts like a signal showing the big guys (banks) have jumped into the market and decided to buy or sell a ton of currency.
This likely means a reversal is about to start.
Here’s an example for you…
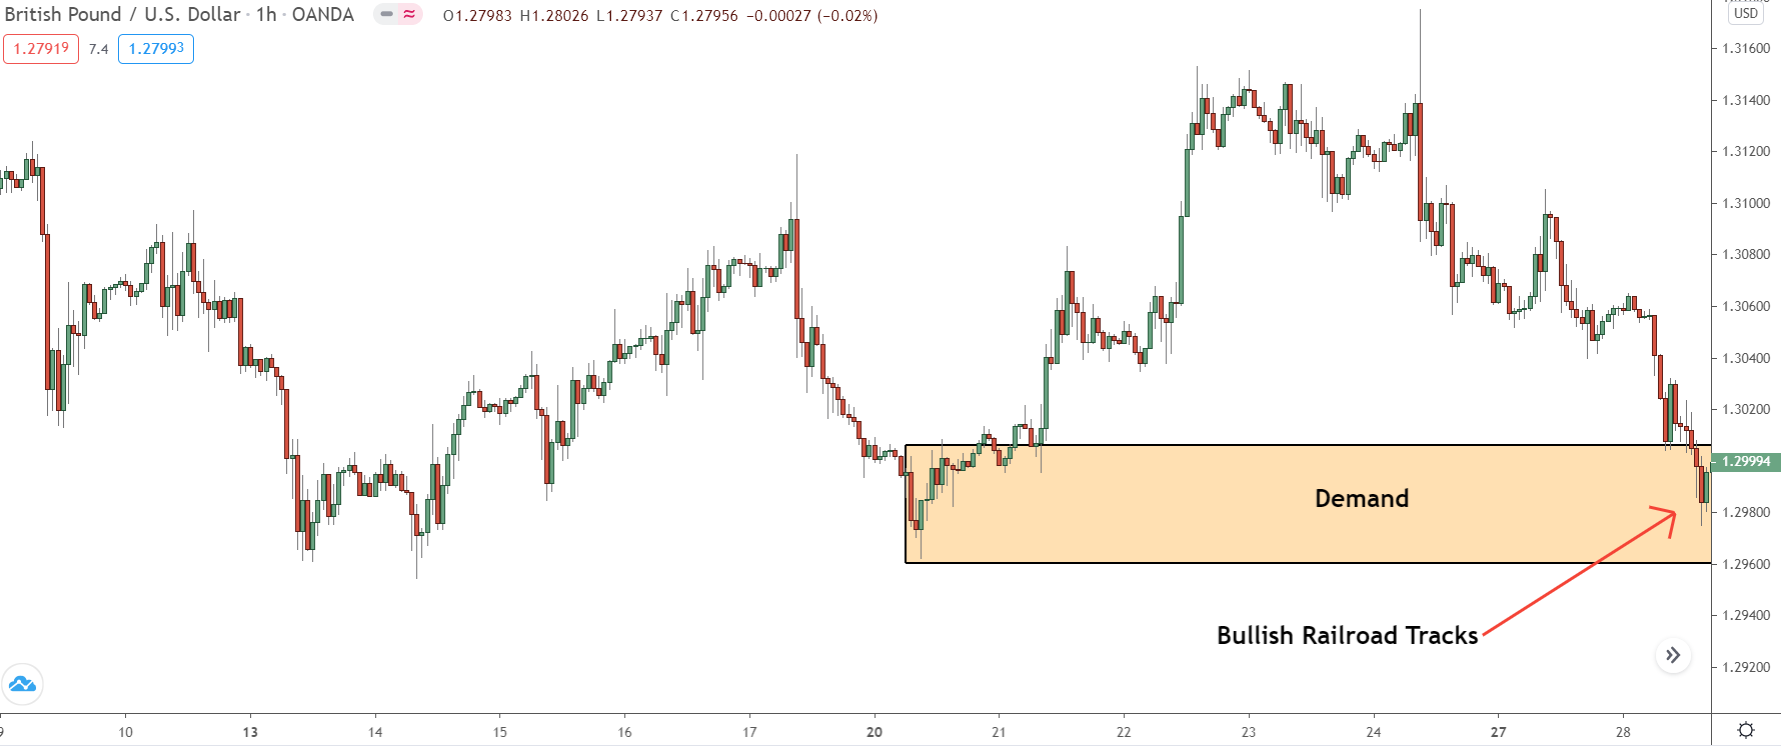
Right after price entered this demand zone (which, to be honest, wasn’t the best), a bullish ‘Railroad Tracks’ pattern formed.
This pattern tells us the banks have started buying.
We don’t know why – maybe they’re placing buy trades, taking profits off sell trades, or closing open sell trades – but, honestly, it doesn’t matter why. All we need to know is we should see price reverse and start rising out of the zone in the near future.
And guess what…
After the ‘Railroad Tracks’ pattern appears, price reverses and moves out the zone.
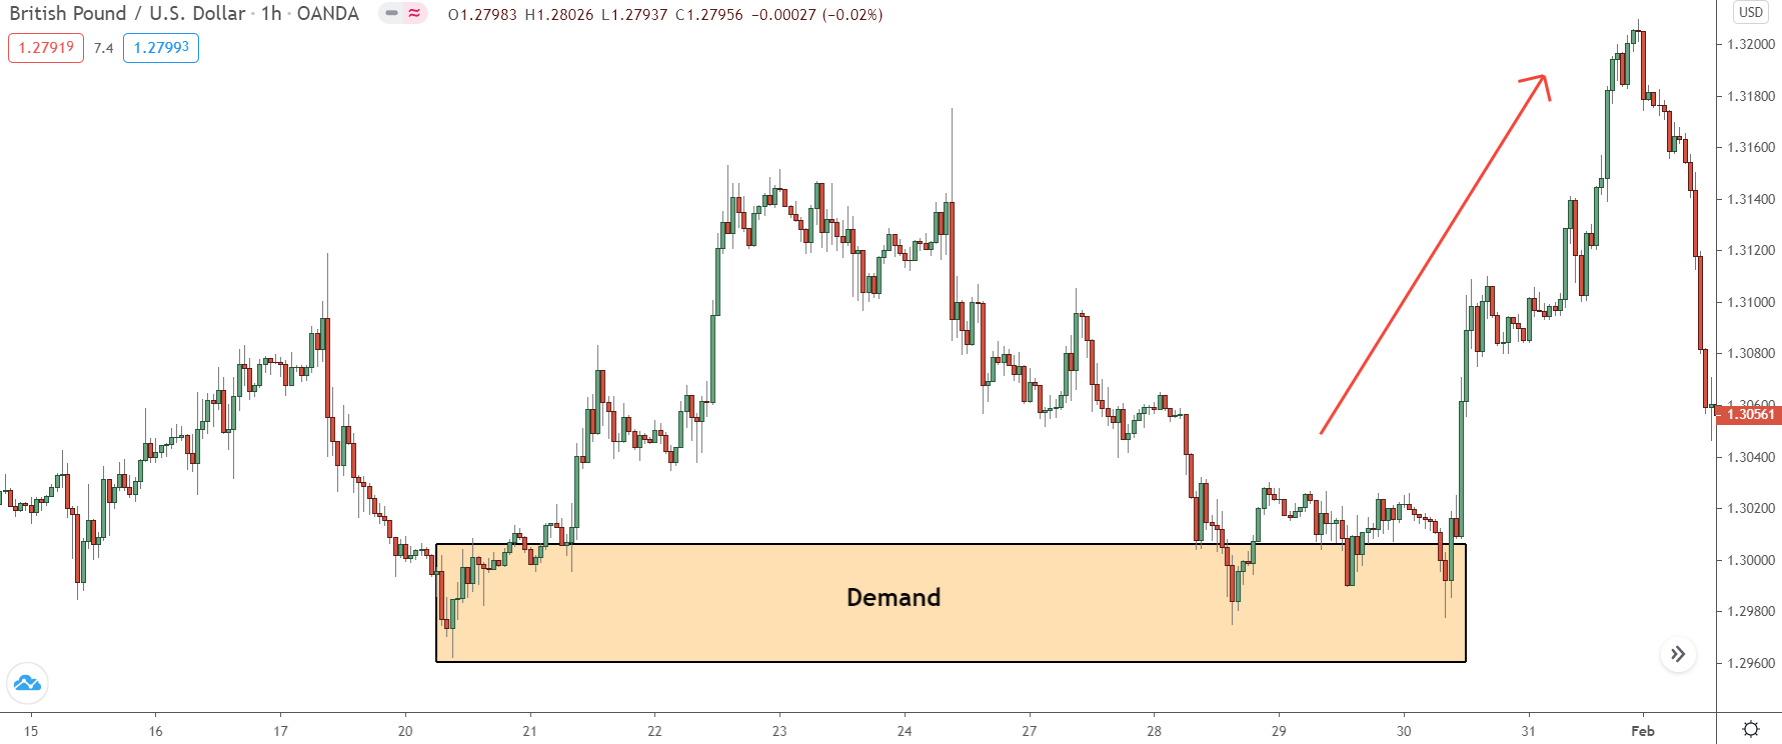
If you’re looking for another tip-top clue to help you with Supply and Demand (S&D) trades, start keeping an eye out for the ‘Railroad Tracks’ pattern. It’s a strong signal the banks want price to reverse from the zone and move the other way.
This is a useful signal to help you join the reversal that’s about to happen.
#2 Use Railroad Patterns To Get Into Support And Resistance, Fibonacci Trades
‘Railroad Tracks’ patterns are excellent signals to enter S&D zones, but they can also be used to enter reversal trades at regular technical spots like support and resistance levels or Fibonacci retracements.
Since the pattern is pretty much an engulf, it’s signals the banks are probably buying/selling to switch the price direction.
Here are a few examples…
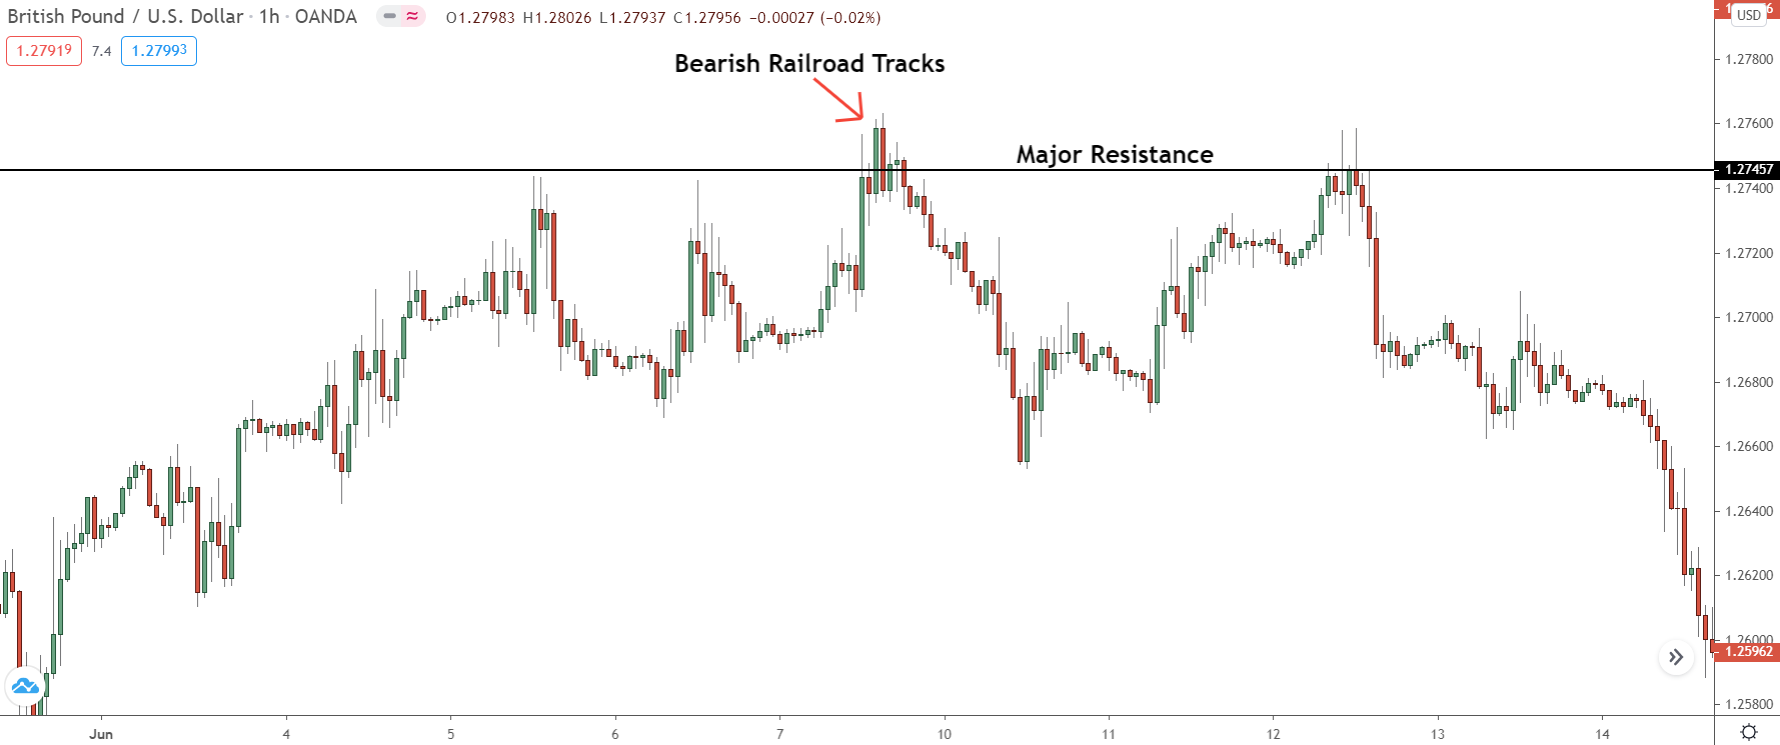
Notice how this ‘railroad tracks’ pattern appeared when price hit a major resistance level?
The pattern forming hints the banks might be selling because they want the price to reverse and move lower. It doesn’t mean price is definitely going to reverse – remember, nothing guaranteed in trading – but it does greatly up the chances it will, so it’s a good signal to enter short.
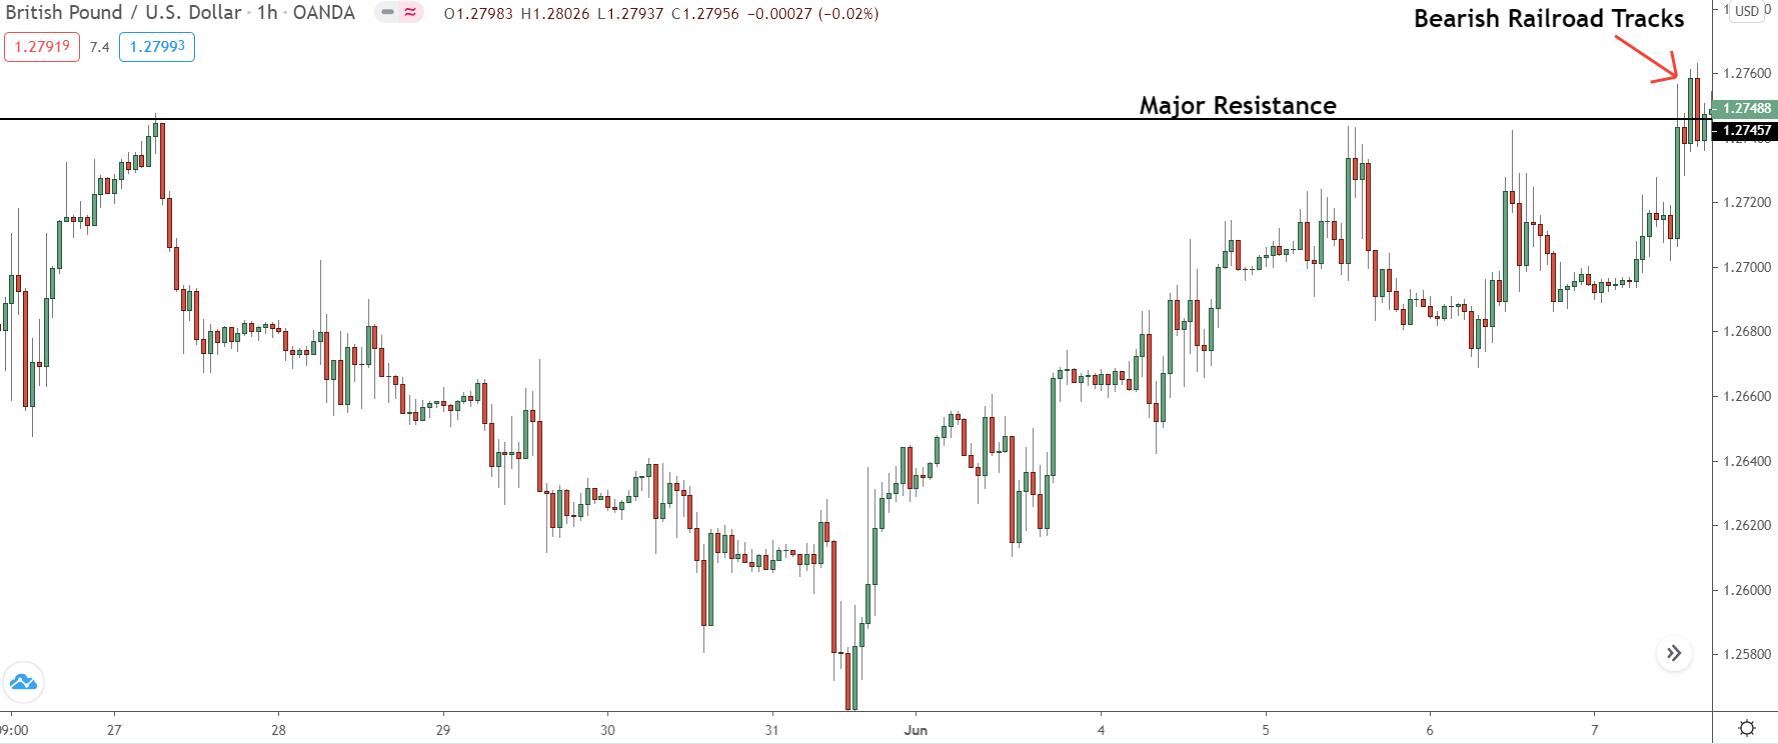
Later on, price reverses, which confirms the pattern was due to banks selling.
You can also use railroad track patterns as signals to enter pull-back trades with Fibonacci retracements.
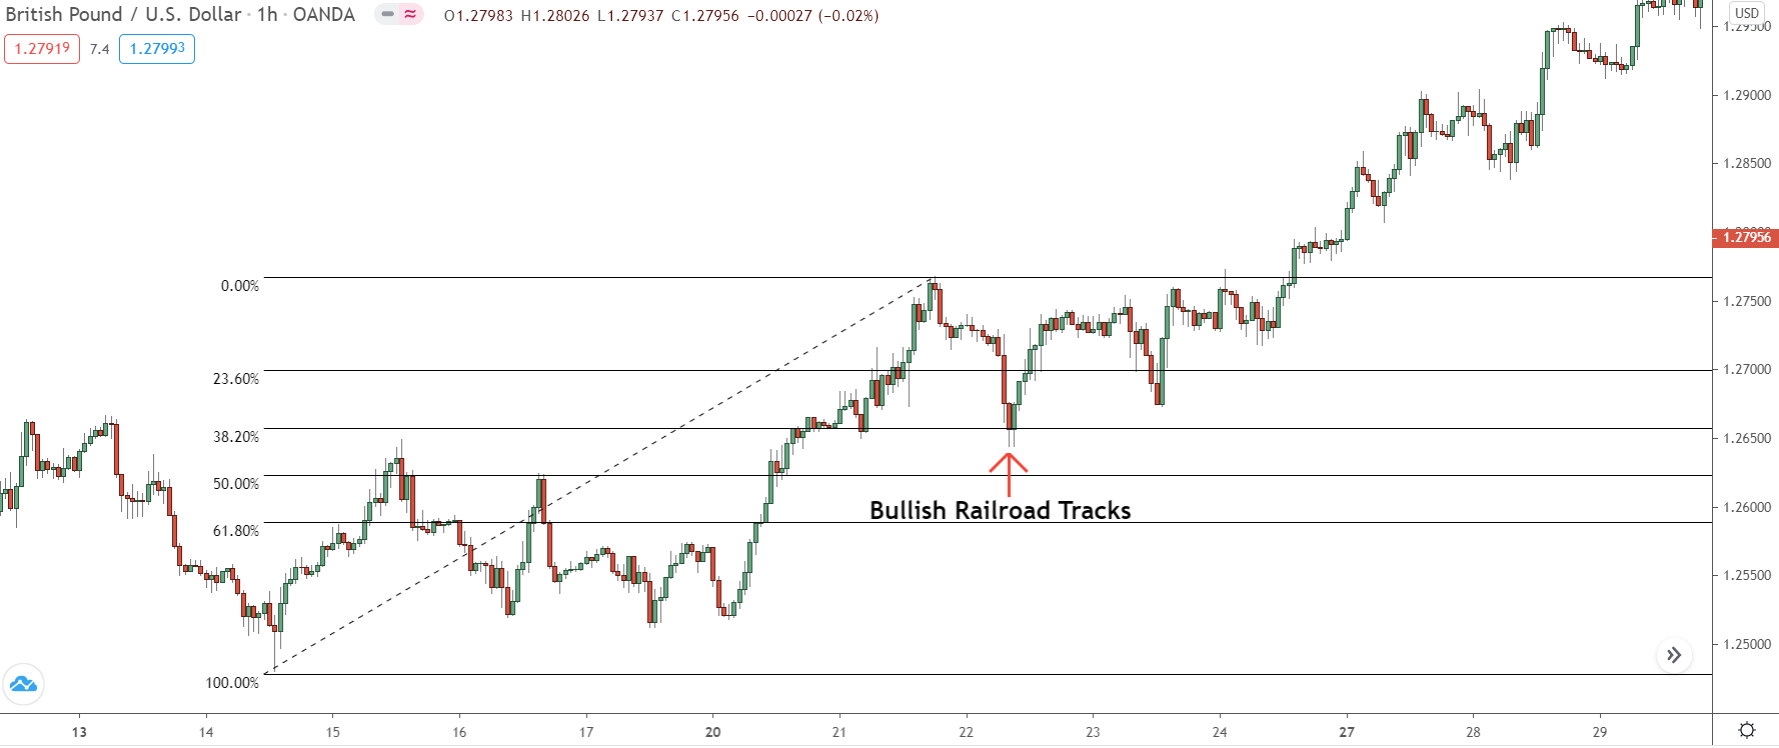
This is done in the same way as trading patterns at S & R:
You draw a “Fib retracement” on a pull-back, wait for price to return and touch the level (super important), then check if a bullish or bearish Railroad pattern forms and signals a change in direction.
If all goes as planned, price should reverse and go back to the previous trend.
Stop Location And Taking Profits
You always put a stop on a Railroad Tracks pattern trade below the lowest low of the two candlesticks for the bullish pattern.
For the bearish pattern, the stop should go above the highest high of the two candles.
It’s also smart to place it a bit above or below, not right at the low or high itself.
Sometimes, price will spike the high or low before reversing, so leaving a small space of a few pips between the high or low and the stop-loss price will make sure this doesn’t happen too often. Also, these rules don’t apply to supply and demand zones.
They have their own rules for where the stop must go – either above or below the zone.
If you put the stop above or below the candle inside the zone, price will usually break beyond before reversing, taking you out of the trade and causing you to lose.
When it comes to taking profits… that’s really up to you.
Any way you choose is fine, as long as it safely reduces the risk.
I mainly use lower lows/higher highs to know when to take profits, with the Heiken Ashi chart changing colour acting as a sign on when I should take a large chunk of profits off or completely close the trade.
This mix lets me stay in the trade longer and cash in at times when it’s safe to do so.
The Bottom Line
All things considered, you MUST add the railroad pattern to your list of price action signals.
While it doesn’t show up as often as more common patterns – like pin bars or engulfs – its power and usefulness make it worth watching for, whether as another signal to enter trades from key technical points or as an early warning price might be about to reverse.
Start using it today, and you’ll soon see how powerful the railroad tracks pattern is.