Gets old, doesn’t it?
You place a resistance level and wait anxiously for price to return, so you can (hopefully) get an entry into a large reversal. However, just as price nears the level, it reverses and moves away, leaving you no signal to get into the reversal.
Bummer.
If you trade support and resistance, the situation above probably sounds very familiar – it does for me, that’s for sure.
And yet, it’s one you can easily stop happening… not all of the time – price will still miss levels on occasion, even with what I’m about to show you – but far less than before. Want to know how?
By turning the levels into support and resistance zones.
Sound interesting?
Let’s take a look…
Why Price Often Misses Support And Resistance Levels
If you’re anything like me, you probably thought the reason price often reverses just before hitting a support or resistance level is simply down to luck… a wrong roll of the dice, if you will.
I mean, it makes sense, right?
What else could cause price to reverse? Sure, other technical concepts often come into play, and that’s why price sometimes reverses, but that doesn’t explain every instance. Price misses the levels far too often for that to be true, so it must be down to luck and the market then, right?
Not quite…
In reality, price misses the levels for a different reason… its got nothing to with luck, and it’s not because you’ve drawn the levels incorrectly.
The REAL reason price often reverses before hitting an S or R level is because the levels exist as lines.
Bet you didn’t see that coming, huh?
Forex is a wild market, with many different variables at play. The market contains all types of traders/investors, each with their own objectives and motivations. Traders aim to make money quickly, investors are in it for the long term. Companies buy and sell for business reasons, governments use the markets to hedge.
All these variables create a lot of randomness in that, while it’s possible to predict what the price may do, pinpointing EXACTLY when and where that’ll happen to the pip is extremely difficult.
So what’s this got to do with the levels being lines then?
Well, because support and resistance levels exist as lines, that randomness plays a larger part in how well the levels work and how often they cause reversals.
For price to signal a reversal, it must hit two or three prices covered by a tiny line – depending on its thickness. That’s a pretty big ask when you have these variables creating randomness. Sure, sometimes price will hit the line and reverse because of the probabilities, but often it won’t, which is why price misses the levels so frequently.
Think about it like this…
If you were out fishing in the ocean, trying to catch a large batch of fish, would you use a fishing rod or a big net?
You’d use a big net because the probability of catching lots of fish is higher due to its size. The net being bigger REMOVES some of the randomness of the water and fish movements, which increases the probability lots of fish will get caught and give you a catch.
With support and resistance levels, we’re trying to do the opposite; catch a fish (reversal) using a rod (line).
While we might catch one or two on occasion, most of the time, we won’t get anything because the randomness of the fish and ocean movements make it unlikely for a fish to bite the line and give us a catch.
Does that make sense?
That probably wasn’t the best example, but I think you get point. In any case, now let me explain how we turn the levels from a fishing rod to a big net… or something like that.
A Better Way Of Trading Support And Resistance
So, the big problem with support and resistance levels is just that… the fact they exist as lines. The lines are too small, that’s why price keeps missing them.
It’s not luck, we aren’t drawing the levels incorrectly – not always at least – price is missing the levels because of how small they are.
The question now then is how do we change the levels so price doesn’t miss them as often and cause us to miss out on lots of profitable trading opportunities?
Well, if you’ve read the title, you probably already know the answer to this…
The way to make support and resistance levels more useful and to stop price missing them is to simply stop drawing the levels as lines and instead draw them as zones. That’s right. Just like supply and demand, we’re going to change the levels and draw them as zones rather than lines, to give them a bigger surface area for price to reverse in.
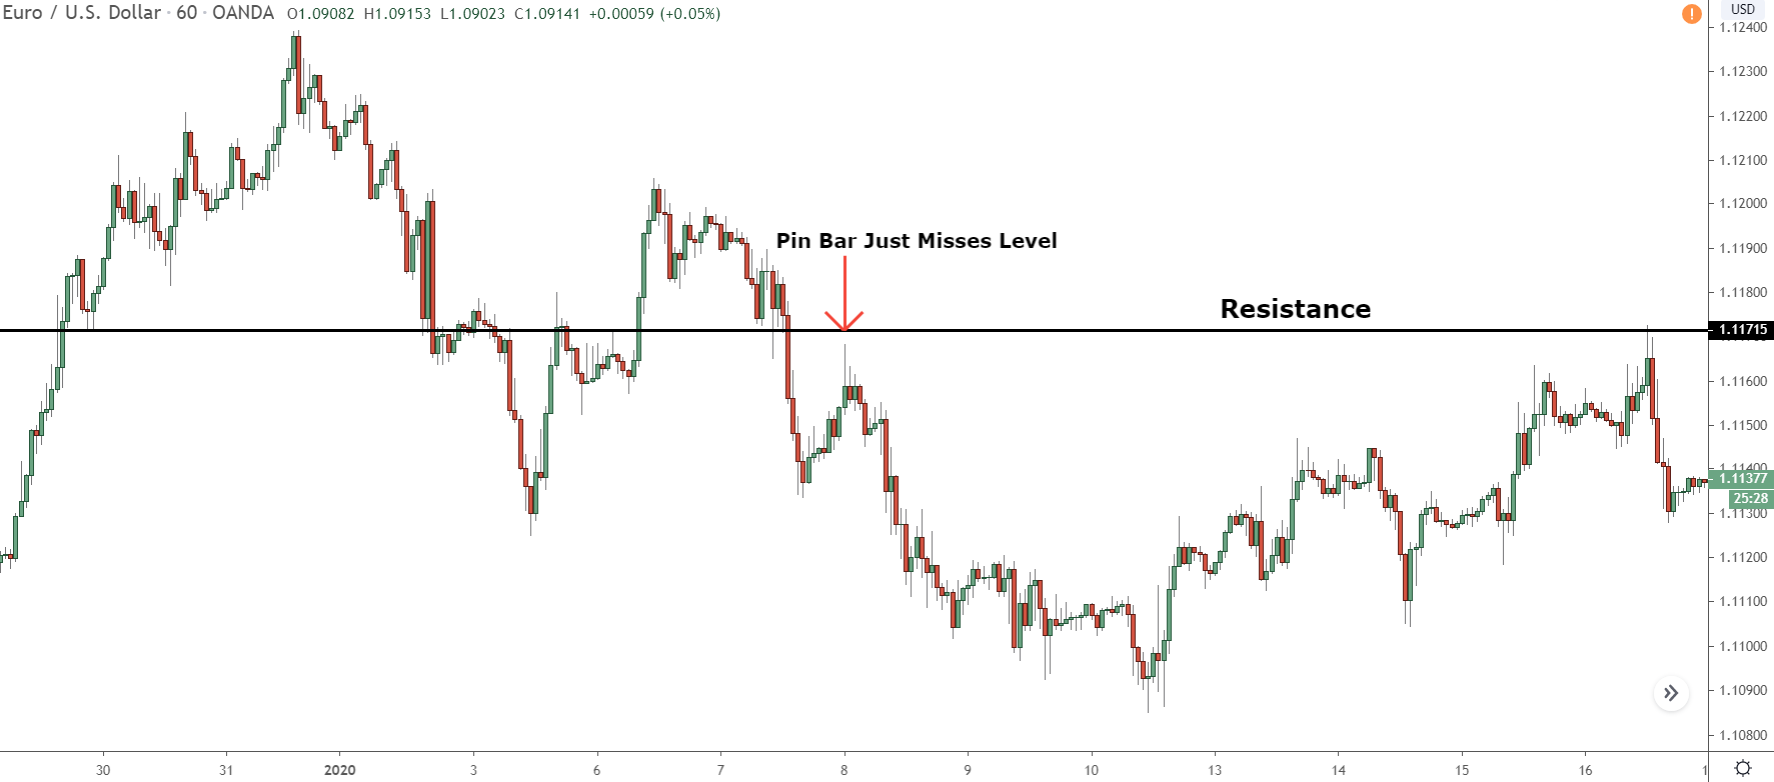
Here’s the typical missed trade scenario that happens using S & R as lines – look familiar?
Price rises to the level and then, a few pips before touching and providing some sort of entry pattern, reverses without giving any sort of entry signal.
Annoying, to say the least.
Now let’s take a look at this again, but this time, rather than draw the level as line, let’s mark it as a zone.
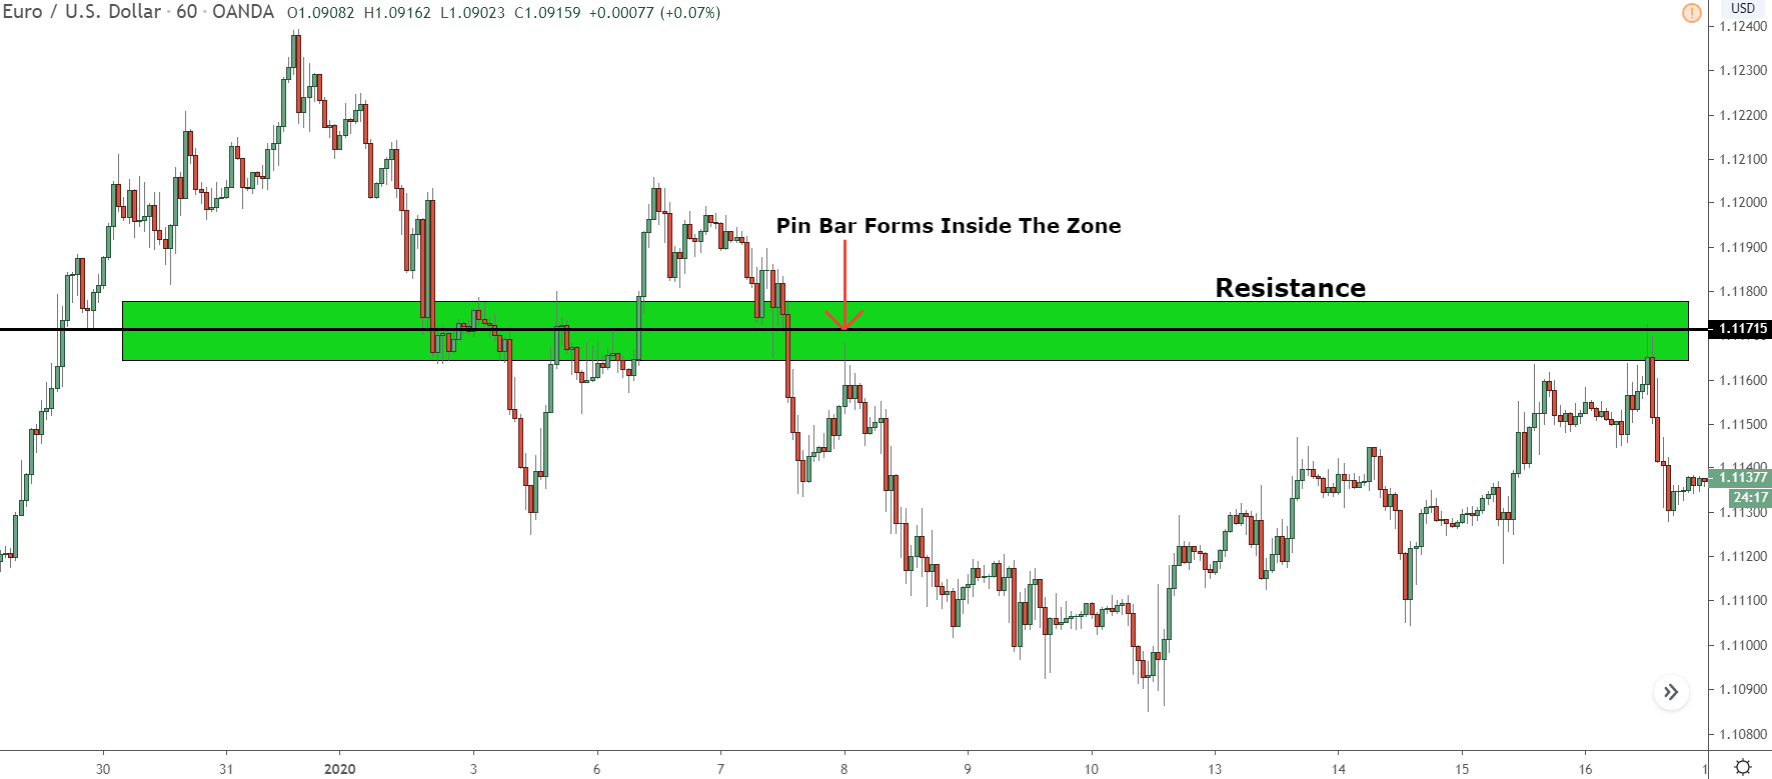
A huge difference, isn’t it?
When we mark the support level as a zone, rather than miss the level, price reverses inside. It falls, spikes into the zone, before reversing and moving higher. Sure, it doesn’t move completely into the zone – part of the pin bar still sticks out above – but touching and being partly inside is a valid signal to go long.
This is how useful support and resistance zones are, and why they work so much better than using lines.
When we marked the level with a line, we missed the trade… the pin never hit the level, so we got no signal to get in. Marking it with a zone, however, gave us a valid long signal, as the pin formed after price hit the zone.
So, support and resistance zones are obviously quite powerful, but how do we draw them on the chart?
Well, let me show you…
How To Draw And Identify Support And Resistance Zones On A Chart
You don’t need pro-level skills to draw support and resistance zones, but you must know how to find and draw the levels normally, so you know where to mark the zone.
I’ve seen a few gurus on the web teach people how to draw the zones, and let me tell you, some of these guys talk so much crap. Their method basically breaks down to: find a level, plonk a zone ontop, then call that the S & R zone. No logic or reasoning behind it, simply whack a zone on a level, and that’s your lot.
If you draw the zones this way, you won’t have much success, that’s for sure.
The correct way to draw the zones is to first find a level, mark a zone on top, and then tweak the zone so that each edge is the same number of pips away from the level.
Let me run you through an example…
So first off, find the support or resistance level you want to ‘zoneify’
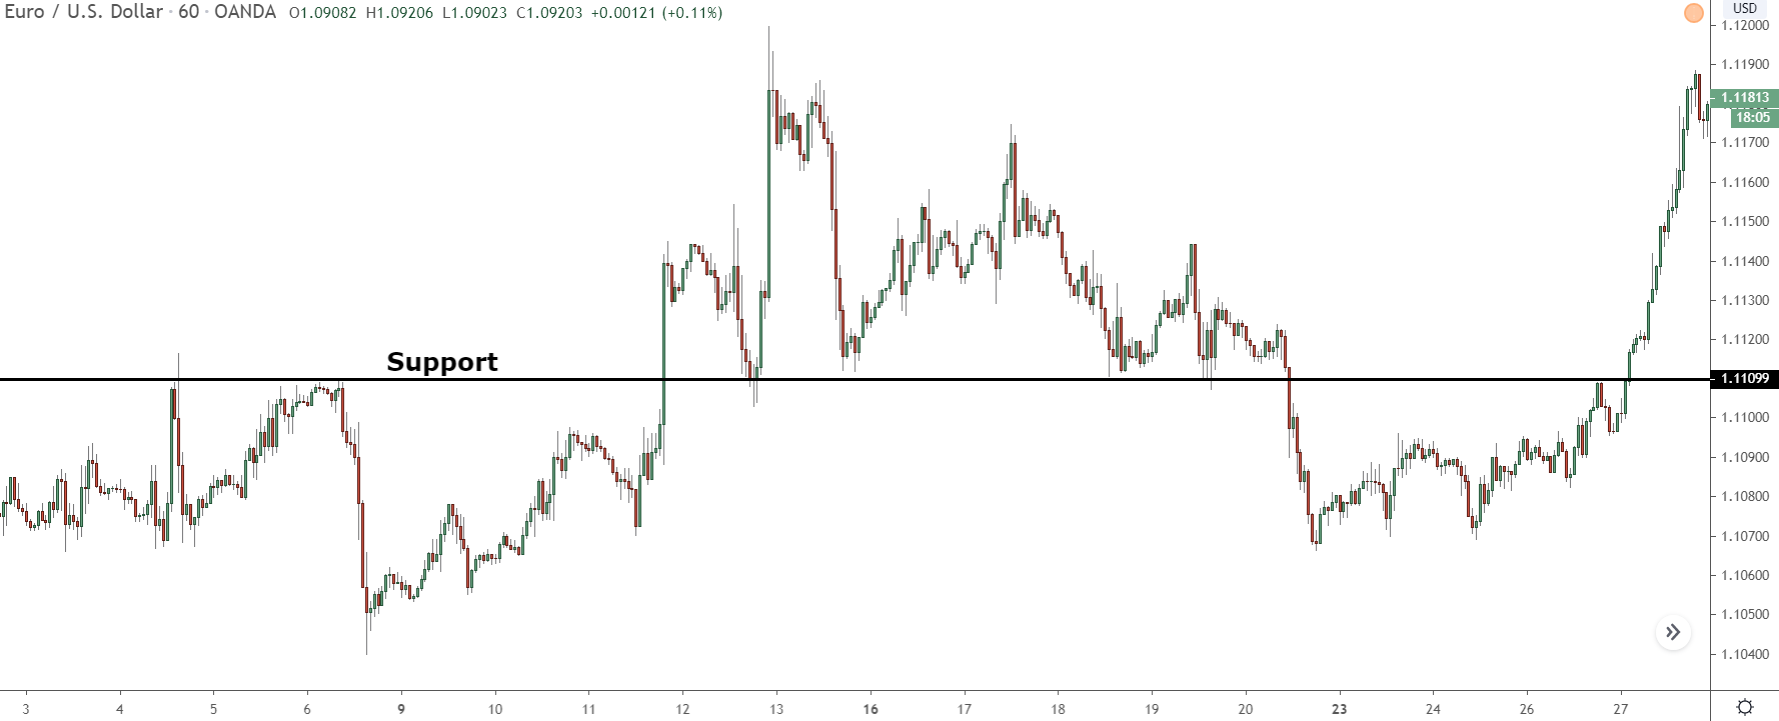
We’ll use this one, as it has lots of nice touches.
Now you can’t just plonk a zone over a level in any old fashion, that what’s the guru’s do. You need to place the zone so each edge is the same number of pips away from the level. If the edges are a different number of pips away, price won’t return to the zone properly, so you’ll still have lots of missed trades.
How many pips away from the line price needs to be depends on what timeframe the level has formed on.
Price doesn’t move as much on lower timeframes, so the zone doesn’t need to be that big. On the higher timeframes, the opposite is true; price covers a much bigger distance, so the zone needs to be larger.
Here’s a quick guide on how many pips from the centre you need to mark the zone.
1, 5 or 15 min – 5 pips
30 min, 1 hour – 10 pips
4 hour – 15 pips
Daily – 25 pips.
In our example, the zone formed on 1-hour time frame and at 1.11099. So, we need to mark a zone that goes from 1.10999 (10 pips below) to 1.11199, which is 10 pips above.
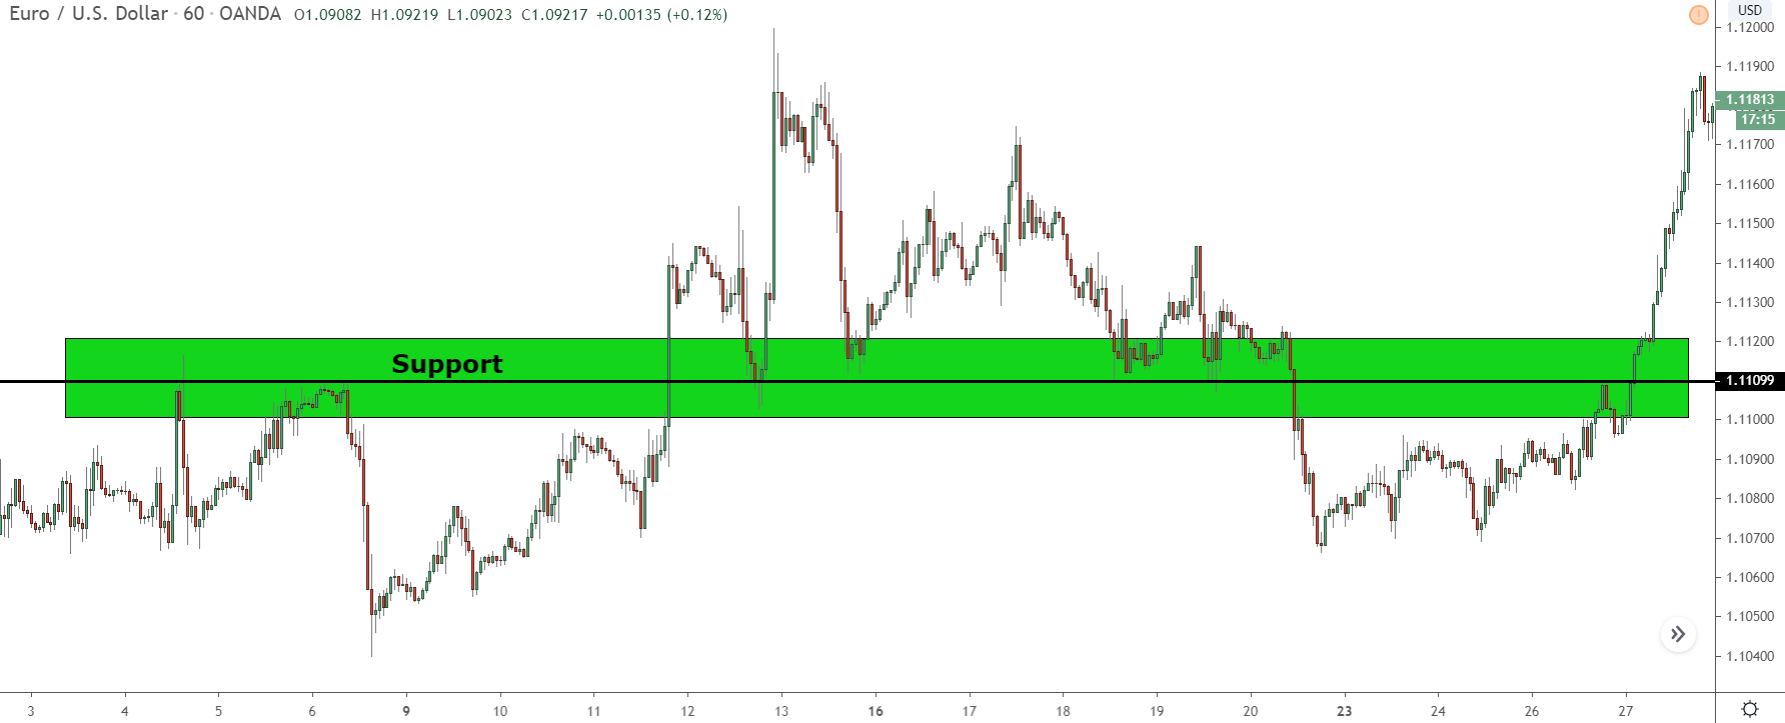
And with the zone marked, this is how it looks.
See how each edge is 10 pips below and above the level… or thereabouts? You don’t have to get this bang on when you mark the zone – don’t zoom right in to make sure it’s exactly 10 pips above and below the level. So long as it’s within a few pips, the level should work as intended.
Two Ways To Trade Support And Resistance Zones
When it comes to trading the levels, you have two options…
Either watch for pin bars and engulfing candles to form once price enters or touches the zone – just like trading normal support and resistance levels. Or place a limit order at the edge of the zone, so when price returns, it triggers the order and puts you in a trade.
For my money, waiting for pins and engulfs works better, but the limit order can also work well – I’ll try to get something out about this out sometime in the near future.
As for the stop loss, always place it the opposite side of the zone depending on what signal you took – so for a bullish pin, it goes BELOW the zone; above for a bearish pin. And once price moves out of the zone, make sure to move the stop to the low/high of the pattern. That’ll reduce some of the risk in case price reverses.
Remember: Support And Resistance Zones Are NOT The Same As Supply And Demand Zones
It’s easy to get confused between supply and demand zones and support and resistance zones, so before we come to the end, let get one thing straight…
Support and resistance zones are NOT the same as supply and demand zones.
Yes, they both exist as zones where price could reverse. And yes, we draw them in a (slightly) similar way. But S & R zones have NO resemblance to supply and demand zones. They don’t form in the same way, we don’t draw them from the same points, and they don’t cause price to reverse for the same reason.
If you’re ever in doubt, just remember…
Supply and demand zones only form AT THE SOURCE of rises and declines.
Support and resistance zones, on the other hand, only form at support and resistance levels. Sometimes they fall in-line with the source of rises and declines, like S & D zones, but they’re always drawn from the level first.
Make sure you don’t get mixed up between them, otherwise, you might find yourself getting into some strange trades.
Summary
Try support and resistance zones out for a while, see how you get on. I can’t promise you won’t still miss the odd trade from time to time – all strategies give missed signals, no matter how much you change them – but the zones will reduce this number drastically, making the levels much more profitable to trade.
there’s something wrong with the text. 100pips is way too large to be placed above and below the line on a 1hr chart. Pls check It again.
Sorry Percy, I meant 10 pips – I always get confused with pips and whatnot.
I’ll go correct the mistake now.