
You can’t trade price action without understanding the pin bar reversal.
Popular with both forex and stock traders, the pin bar reversal has cemented itself as one of the best price action strategies, and for good reason…
With its long, easy-to-spot wick and tendency to predict reversals, the pin bar is not only beginner friendly but also very effective.
Today I’m going to show you how to trade the pin bar reversal; how it works, what makes it tick. And also reveal why most gurus get it wrong when they say a pin bar shows a rejection (it doesn’t).
Ready?
Let’s get to it.
What The Hell Is A Pin Bar?
Tell me…
Have you ever seen a candlestick with a HUGE wick?
…a wick so big it makes the candle stand out from all the others?
If you have, guess what…
You’ve just seen a pin bar.
Identified by its long wick that sticks out from the surrounding candlesticks, the “pin bar” or “hammer candlestick”, as it’s sometimes called, is a reversal pattern that signals the price of a currency may be about to reverse. It forms on all currencies and time-frames in the market.
The name “pin bar” actually comes from Martin Pring, who named the pattern after the film Pinocchio – because it’s long wick ‘lies’ about the direction the price is going to move in. (this isn’t actually true though, as I’ll explain in a minute).
The pin bar comes in two variations…
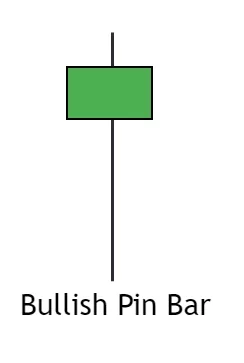
There’s the Bullish Pin Bar, which is a signal the price is likely to rise.
(Bullish pins always have their wick BELOW the body i.e pointing down).
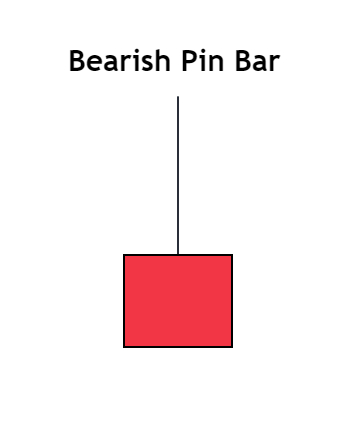
And the Bearish Pin Bar, which indicates the price is likely about to fall.
(These always have their wick ABOVE the body).
A Candle Is Only A Pin Bar If It Has These Three Features
Pin bars, even though they’re made up of the same features (long wick, small body), never look the same when they form on the chart.
Figuring out whether a candlestick is a valid pin bar or not is can be tricky. Luckily, there are 3 key features a candle must have in order for it to be a pin bar…
- A long wick that sticks out from the surrounding candlesticks (this should be 2- 3 times the size of the entire candlestick).
- The wick can either be below the body (in which case it’s a bullish pin bar) or above the body (where it’s a bearish pin bar), and is sometimes called the “tail” or “shadow”.
- A small body – shown by the open and close being very close together – that is found at, or very close to one end of the candlestick.
Important: Don’t get too caught up trying to determine whether a candlestick is actually a pin bar or not. 95% of the time if a candle features a long wick that protrudes out from the surrounding candlesticks, it’s a pin bar.
What Most Forex ‘Gurus’ Get Wrong About Pin Bars
If you read the many guides and blog posts people have made about pin bars on the web, I can guarantee at some point you’ll hear something along the lines of…
“Pin bars show a price rejection” or,
“A pin bar forms because traders have rejected higher/lower prices”.
To those not ‘in the know’, these statments make a lot of sense. I mean, the long wick clearly indicates a the market quickly retraced after reaching a certain price – how else would price reverse and create the pin? For a long time, I believed those statements above were what caused pin bars to form.
But I can tell you right now, I was DEAD WRONG!
Write this down somewhere…
A Pin Bar DOES NOT show that market has rejected higher/lower prices or a key level.
In reality, what it indicates depends on two factors:
1. – WHERE the pin bar has formed on the chart, and…
2. – WHO caused the pin to form.
Most traders forget (or don’t know perhaps) that forex doesn’t function as a one massive hive mind of people collectively making decisions on when and where price moves.
Multiple groups of people operate in the market for different reasons.
Banks and hedge funds buy and sell mainly to make money from retail traders (i.e, us). Companies also buy and sell to meet the needs of their business. Retail traders aim to make money from predicting price movements, usually by watching news or using technical analysis.
These groups can all cause pin bars to form for reasons that have NOTHING to do with a rejection or reversal.
Take Toyota for example…
If Toyota needs to buy parts from Europe, it must sell Yen for Euros.
When they sell, the resulting decline could cause a bearish pin bar to form.
Does that pin have a high chance of initating a reversal?
HELL NO!!
Now if you don’t know they’ve sold (which you won’t), you’re not going to know the pin bar has a low probability of causing the price to reverse; you’ll just treat it like any other pin, possibly resulting in a loss.
My Point: Don’t assume all pin bars signal a reversal or rejection.
Some of them do, yes, but the vast majority don’t.
Always think about how and why a pin has appeared before taking any signal. Checking the wick length can give you some idea – pins with HUGE wicks usually indicate a reversal – but due dilligence is still nessacary.
Keep this in mind the next time you see a pin form.
The 3 Best Pin Bar Trading Strategies You Can Use Right Now
The pin bar is a great signal for many different reasons, but one of the main ways the pin bar is so popular with traders is the sheer number of different ways it can be used when trading.
Simply put:
The pin bar is one of the most versatile price patterns in forex.
You can use it on its own, as a signal to take profits, combine it with support and resistance levels, trend-lines, fibonacci retracements…. and that’s just a few of the ways.
Listing all the different ways to trade/use pin bars would be impossible.
So what I’ve done below is list the three most profitable ways of using them as well give you an overview of how to use them yourself.
Pin Bars At Support And Resistance Levels
The most well-known way of trading pin bars (and probably the best, at least in the forex market) is at significant levels of support and resistance.
On their own, pin bars and support and resistance levels aren’t that great:
Pins often fail to cause reversals and the price sometimes smashes through S & R levels as if they don’t exist.
But when a pin bar forms at a support or resistance level, the chances of a reversal increase dramatically, making it a powerful and accurate trading strategy.
To trade pin bars at support and resistance levels, mark some levels on your chart and then wait for the price to reach one of them. Once it does, monitor the price to see if a bullish or bearish pin bar forms – watch for bullish pins at support levels, bearish pins at resistance.
If a pin appears, open a trade using one of the two entry methods listed later on.
Easy.
At Fibonacci Retracements
You can also trade pin bars at fibonacci retracements.
You won’t get as many trades as trading them at S & R levels – because retracements don’t occur that often – but the trades you do get will have a higher probability of being successful, which still makes it a worthwhile strategy.
Trading the pins is simply a matter of waiting for the price to hit a retracement level and then seeing if a bullish or bearish pin bar forms.
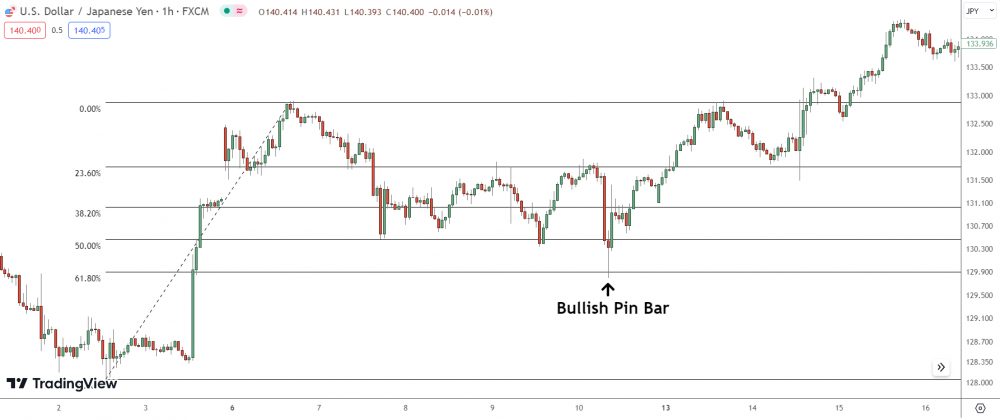
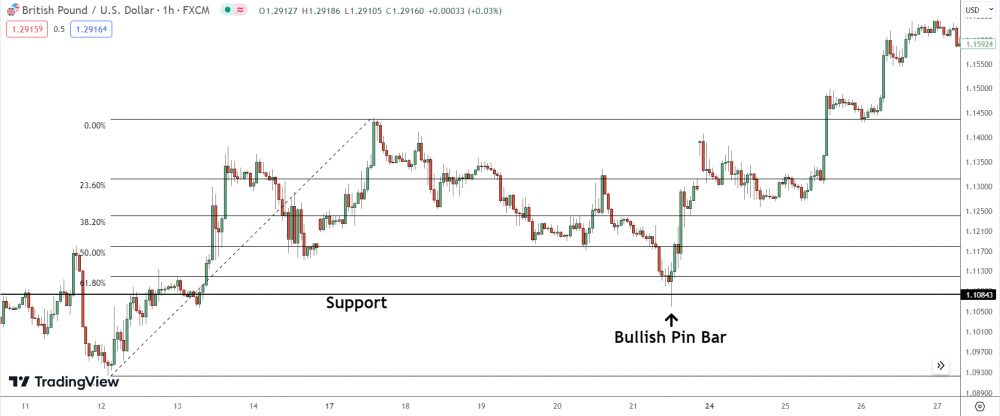
In the image you can see a sharp decline caused the price breakthrough several retracement levels before reversing at the 61.80% level, resulting in a bullish pin bar forming. After the pin appeared the price reversed entirely, rising almost 70 pips in this case.
Note: Only trade bullish pin bars that form at retracements drawn on upswings and bearish pin that form on retracement drawn on a down-swings.
On Their Own
Pin bars are best traded at support & resistance Levels or fibonacci retracements.
But you can also trade them on their own with no other confirming factors.
The thing you must remember about trading pins on their own is to always think about WHY they’ve formed.
Like I said earlier, pin bars don’t form for the same reasons.
Most form as a result of people buying and selling for reasons that have nothing to do with causing reversals, like taking profits for instance.
So before you take a pin bar trade, at least when trading them on their own, look at WHERE the pin has formed and then think about WHY it might have formed there.
Ask yourself: “Has this pin formed because of traders taking profits, or do traders actually want the price to reverse from here?”.
How To Trade The Pin Bar Once It Has Appeared
Whichever way you decide to trade pin bars, you have two different methods available to enter a trade.
Method 1: Market Order Entry
This method is where you enter using a “Market Order”, or “Instant Order” as some brokers call it.
To enter, wait for a pin bar to close (by seeing the next candle open) and then buy or sell using a market order.
The market order entry is good for guaranteeing you get into a pin bar trade, but it does require a bigger stop loss than the limit order entry, so you do have to risk a little more money using it.
Method 2: Limit Order Entry
The other method is to enter using a “Limit order” – an order set at a price the market hasn’t reached.
The price often (but not always) retraces to the halfway point of a pin bar before it reverses.
By placing an order at the halfway price, you can enter at a lower price, decreasing the risk and increasing the reward.
To enter using a limit order, find the halfway point of the pin (by placing the fib tool on the high and low and looking for the 50% level) and then place the order at the 50% level price.
Example Of Pin Bars In The Market
Pin bars form in all conditions; during up-trends, downtrends, consolidations etc… which is just another reason I highly recommend you start looking for them.
To get you up to speed with what they look like during these conditions, and give you a few tips for trading them, here are some examples of pin bars in the market.
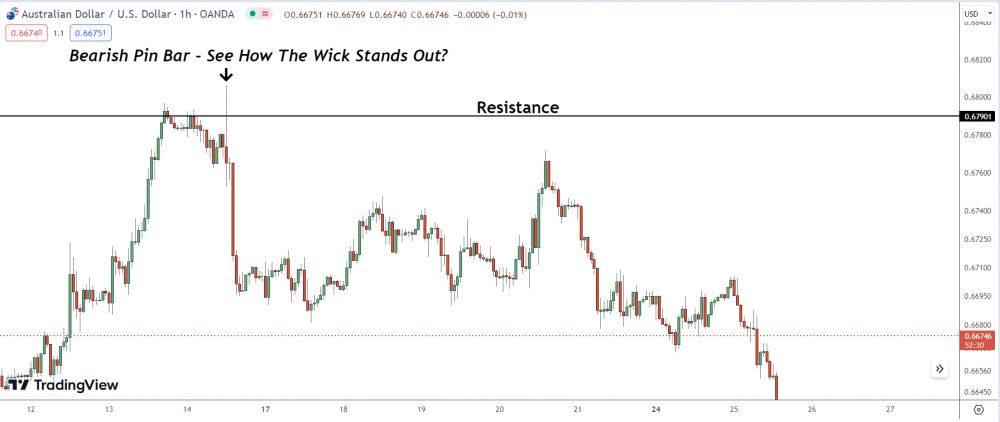
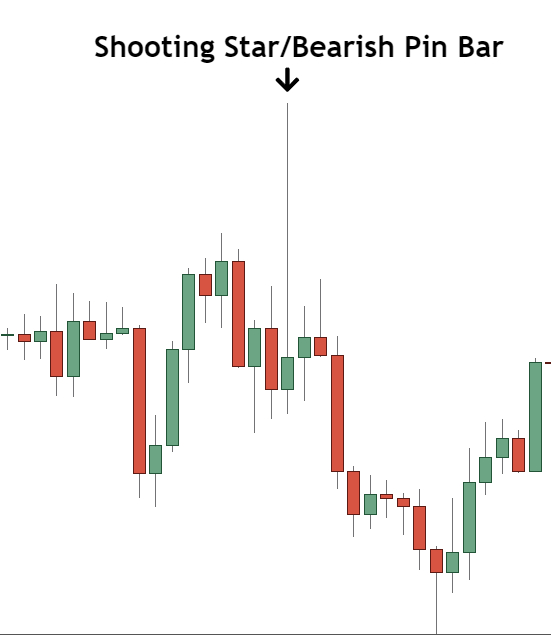
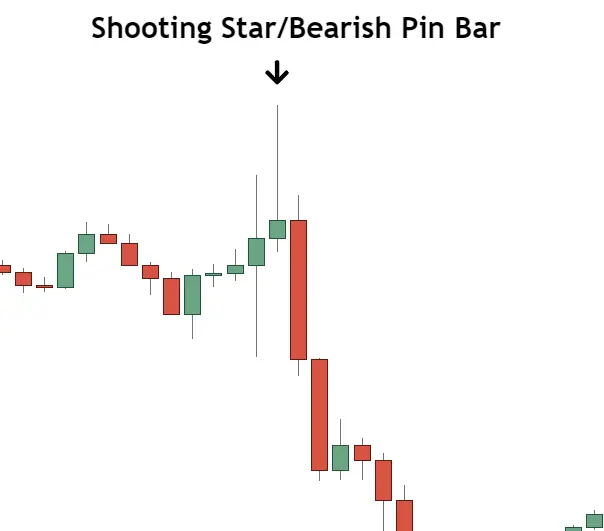
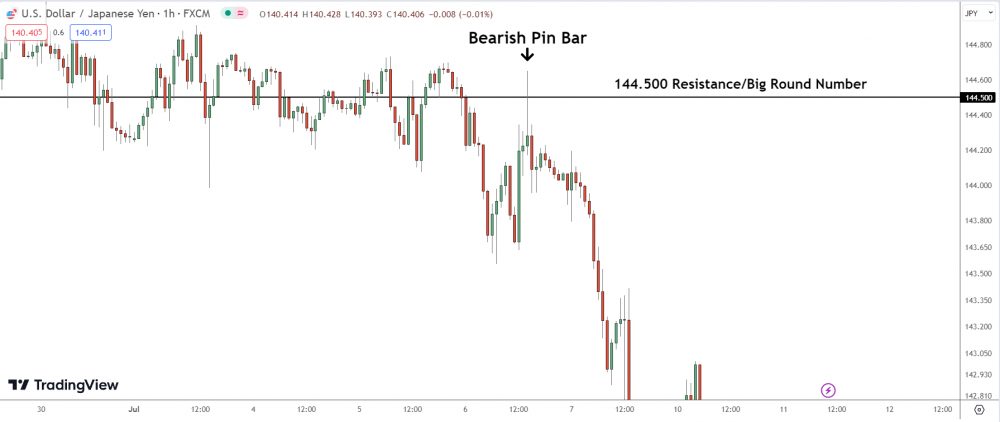
Here’s what I’d call the “classic” pin bar setup:
The price rises up to a resistance level, goes beyond it slightly, then falls again, creating a long wick and causing a bearish pin bar to form.
Take note of how the wick sticks out, even against the surrounding candles. These are the type of pin you want to look for; small square body at one end of the candle, long wick below.
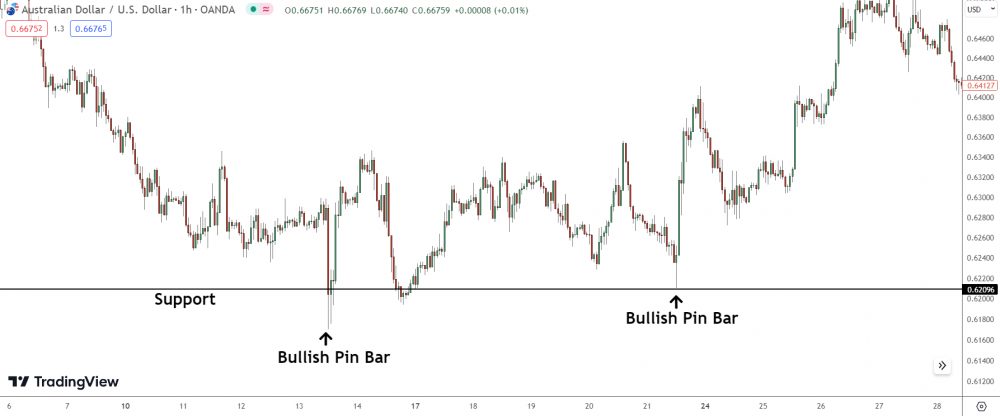
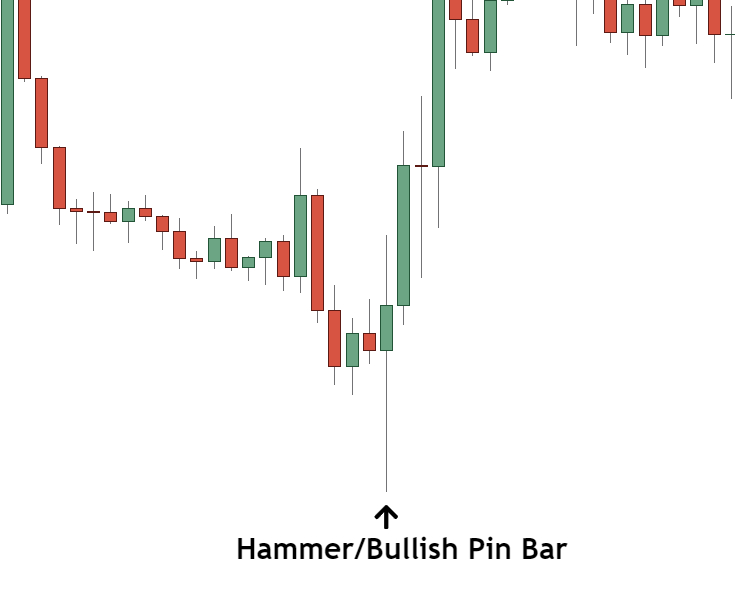
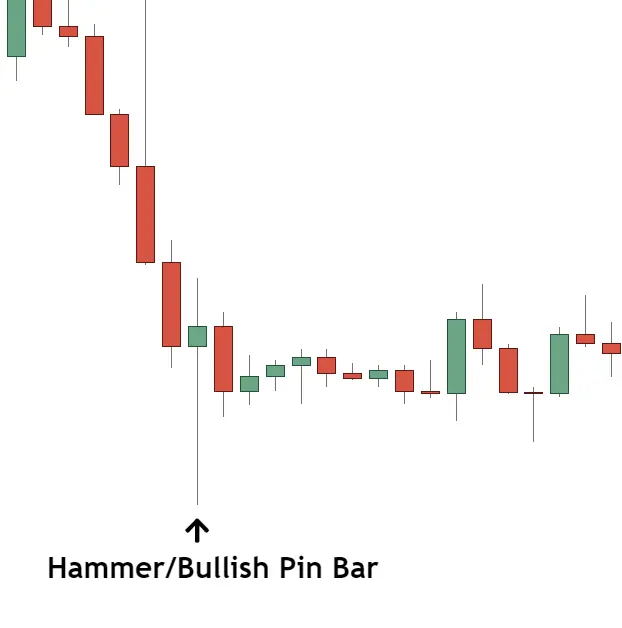
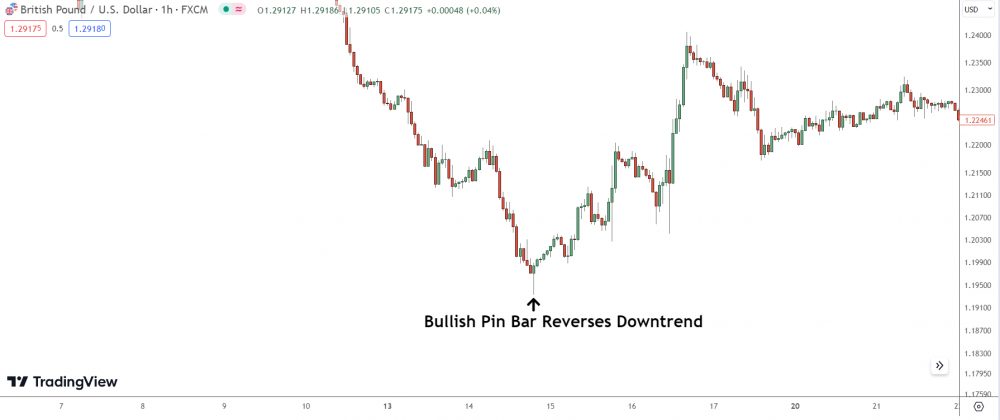
This image shows a couple of pins that formed at support levels against the trend – a downtrend in this case.
Pins that form against the current trend, whether on their own, at S & R levels or fib retracements, don’t tend to work that well; sometimes they can cause a small reversal, but most of the time, the price will go straight through them – usually because they’ve been created by profit taking.
If you do want to trade a pin against the trend, make sure it has a long wick and confirmation with multiple technical levels e.g it’s formed at a strong level of support and a retracement level.
If you do want to trade a pin against the trend, make sure it has an especially long wick and confirmation with multiple technical levels e.g it’s formed at a strong level of support and the 50% retracement level.
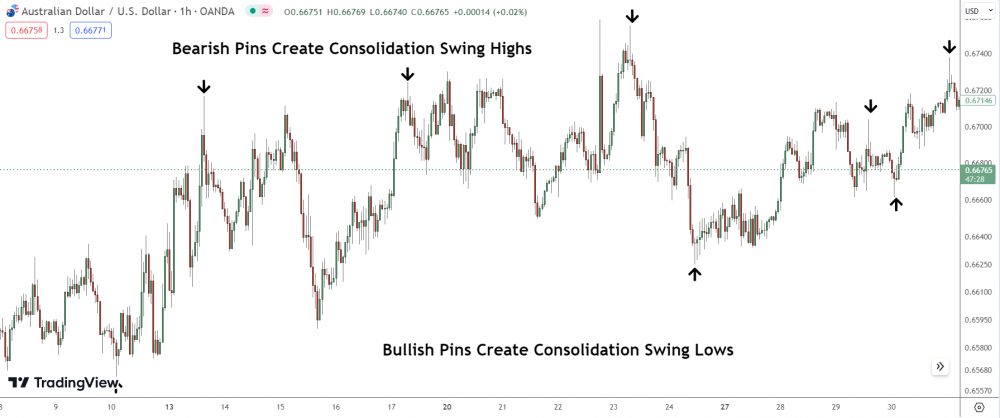
Pin bars also form frequently during consolidations.
Most form when the price is travelling to one side of the consolidation to the other, but the best ones (the ones you want to be trading) appear at the sides or edges of the consolidation, and usually signal a move back to the other side is about to take place.
Pin bars have a much better chance of being successful when they form at a point of confluence.
Notice how the pin above has formed at a support level which is in line with the 38.5% retracement level?
That’s called a point of confluence, because a pin, support level and fib retracement have all met at the same point, which increases the probability of a reversal taking place.
The 3 Most Common Mistakes People Make Trading Pin Bars
Time and time again I see people make the same mistakes with pin bars.
Some of the mistakes everyone knows and is guilty of, like trading against the trend, but others aren’t as obvious, and this mainly due to the misleading information books and forex gurus have given people about what pin bar is and what causes them to form.
To help you avoid these mistakes, here’s the 3 most common…
Trading Pin Bars That Form Against The Current Trend
Trading against the trend is never a good idea, yet it’s a mistake pin bar traders make all the time.
Most of the pins that form against the trend the trend don’t end up being successful for a very simple reason…
Profit taking.
9 times out of 10 the pins that form against the current trend appear because of traders taking profits, NOT buying/selling to make the price reverse.
These pins, of course, have a low probability of causing a reversal, because the traders still want the price to continue moving in the direction of the trend.
They do work on occasion, but most of the time they don’t.
So make sure you don’t trade them.
Taking Pins That Appear During Low Volume Times
Loads of traders make this mistake, but its one I think most traders aren’t even aware of.
A pin bar that forms during a low volume time, like when a pair is out of its normal trading hours, DOES NOT have a high probability of causing a reversal.
The reason why is simple:
For a pin bar to cause a reversal, traders with big money (such as those that work in banks and hedge funds) must be active in the market.
If these traders aren’t active, which they aren’t outside of currencies normal trading hours, any pin bar that forms is unlikely to cause the price to reverse.
So the next time you see a pin bar form at midnight on Eur/Usd, DON’T trade it, because it hasn’t been created by big money traders buying and selling, therefore it has a LOW probability of causing a reversal to take place.
Note: Pins that form during low volume times are usually much smaller than other pins.
Trading Pin BarsThat Appear After Sharp Rises And Declines
Ever seen a pin form after a sharp rise or decline, entered a trade to try to catch the reversal, only to then see the price continue to rise or fall?
…Annoying isn’t it.
These pins usually meet all the right criteria, but there’s a simple reason they rarely work:
They’re created by profit-taking.
Just like the pins that form counter to the current trend, the pin bars that form after sharp rises and declines usually appear because of traders taking profits off their trades, not as a result of buying or selling to make the price reverse.
These pins obviously don’t have a high chance of causing a reversal, a big one at least. But because of how they look people often trade them assuming they’re good signals.
So, don’t trade the pins that form immediately after sharp rises or declines take place.
Wait for more signs of a reversal such as retracements and multiple highs (or lows if it’s a decline) forming and then if another pin appears, take a trade.
The Bottom Line
All in all, the pin bar is one of the most effective price action strategies you can use in the forex market. It’s easy to spot and trade, making it an effective strategy for beginners and professionals alike.