Ever come across the “Pin Bar Reversal”?
If you’re serious about trading price action, this is one pattern you need to have in your toolkit.
Here’s the thing:
The pin bar reversal isn’t just another candlestick pattern.
It’s your ticket to spotting high-probability trades without needing a PhD in technical analysis.
In this guide, I’m breaking down on the pin bar reversal. You’ll learn how it works, why it’s so effective, and a little secret: it doesn’t always mean a price rejection (yeah, I was surprised too!).
Ready to get the lowdown?
Let’s dive in!
What The Hell Is A Pin Bar?
Imagine this:
You’re looking at a bunch of candlesticks, and you notice one with a HUGE wick.
…a wick so massive it stands out from all the others.
If you’ve seen that, congrats…
You’ve just spotted a pin bar!

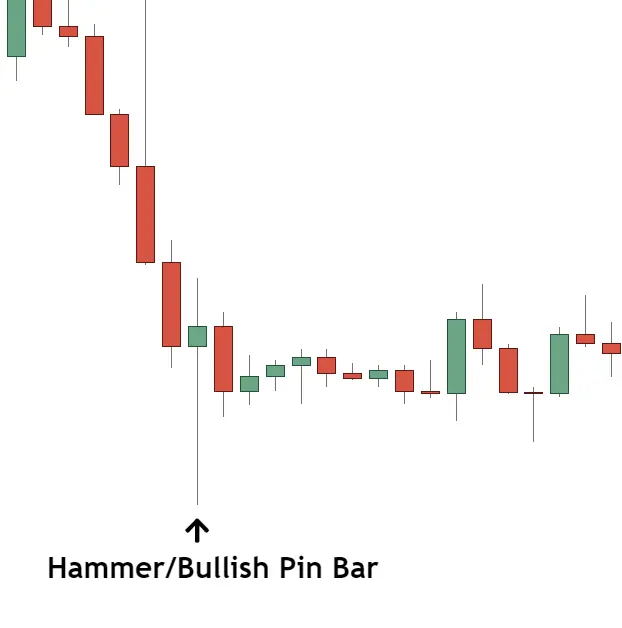
The “pin bar” or “hammer candlestick” is a prominent reversal pattern, easily recognizable by its extended wick which distinguishes it from other candlesticks. This pattern suggests a potential price reversal and can be observed across various currencies and time frames.
Ever wondered why it’s called the “pin bar”?
It’s kind of a funny story.
The name comes from Martin Pring, who borrowed the idea from the movie Pinocchio.
Just like Pinocchio’s long nose was a sign he was lying, the long wick of the Pin Bar ‘lies’ about the direction the price is going to move.
Now, Pin Bars comes in two types…
Bullish Pin Bars
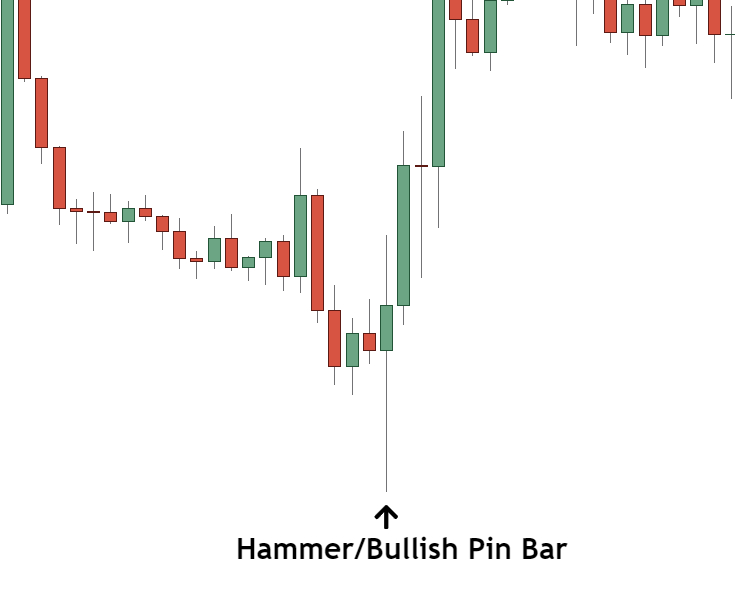
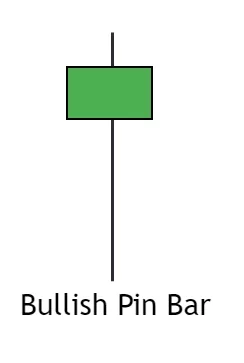
Bullish Pin Bar: Signifying a potential upward price reversal.
The main characteristic of Bullish Pin Bars is its wick positioned BELOW the candlestick body, resembling a downward-pointing candle.
Bearish Pin Bars
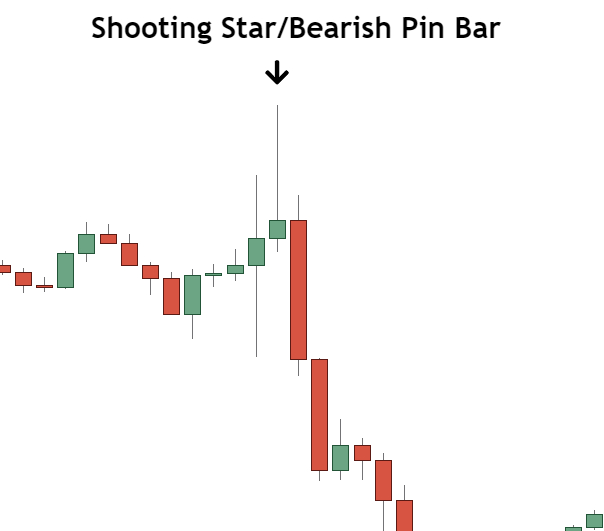
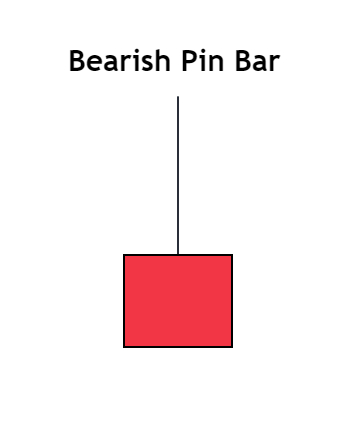
The Bearish Pin Bar: Indicating a possible downward price reversal.
In contrast, the Bearish Pin Bar has its wick situated ABOVE the candlestick body, giving it an upward-pointing appearance.
The Key Feature Which SeperatesPin Bars From Other Candlesticks
Pin Bars might seem like they’re cut from the same cloth, they can actually vary quite a bit on a chart.
So, how do you spot the real pins?
- A long wick roughly 2-3 times the size of the entire candlestick).
- The wick can either be below the body (Bullish Pin Bar) or above the body (Bearish Pin Bar).
- Sometimes, this wick is referred to as the “tail” or “shadow”.
- A small body – indicated by the open and close being close together – found at the end of the candle.
Pro tip: If you’re scratching your head wondering if you’re looking at a Pin Bar, here’s a quick hack. If the wick is blatantly long and hard to miss, you’re probably (like 95% sure) staring at a Pin Bar.
What Most Forex ‘Experts’ Get Wrong About Pin Bars
Now, if you’ve been trawling through Forex blogs or guides, you’ve probably stumbled upon statements like:
“Pin Bars show a price rejection” or,
“A Pin Bar forms because traders have rejected higher/lower prices”.
If you’re not an expert, these claims sound pretty legit. The long wick shows the market quickly went back after hitting a certain price – how else could price reverse and form the pin? I also thought these claims explained why Pin Bars form, but I was SO WRONG!
Here’s the truth…
Contrary to popular belief, a Pin Bar is NOT a definitive indicator the market has rejected higher/lower prices or encountered a key level.
In fact, what the pin shows depends on two factors:
- WHERE the Pin Bar appears on the chart, and…
- WHO caused the pin to form.
It’s crucial to understand the forex market isn’t a massive hive mind with a singular mindset. Instead, it’s a dynamic arena where diverse groups, each with their own objectives, play their part.
For example, banks and hedge funds buy and sell mainly to profit off us regular traders.
Companies also buy and sell to fulfill business needs.
We traders try to make money by predicting price movements, often by keeping an eye on the news or using technical analysis. All these players can influence the formation of Pin Bars, and their reasons might be entirely unrelated to price rejection or reversal.
Consider this scenario:
If Toyota needs to procure components from Europe, it would necessitate the exchange of Yen for Euros. Such a transaction could lead to the formation of a bearish Pin Bar.
But does this Pin Bar signify a high likelihood of a price reversal?
NO WAY!!
Without the knowledge of Toyota’s transaction (which is not public information), one might mistakenly interpret this Pin Bar as any other, leading to a misguided trading decision and subsequent loss.
My point?
Don’t assume all Pin Bars signal a reversal or rejection.
While some might signal a reversal, a significant majority do not.
Before making any trading decisions based on a Pin Bar, always delve into its origins and the circumstances of its appearance. Checking the length of the wick can give you some idea – pins with MASSIVE wicks usually indicate a reversal – but doing your homework is still essential.
Keep this in mind next time you spot a pin forming.
The 3 Best Pin Bar Trading Strategies You Can Use Right Now
The Pin Bar is one of the most flexible price patterns in forex.
You can use it as a signal on it’s own, to decide when to take profits, or use it alongside other technical concepts and factors.
Such as…
- Support and resistance levels,
- Supply and demand zones,
- Trend-lines,
- Fibonacci retracements.
…and that’s just naming a few of the ways.
Trying to list all the different ways to trade or use Pin Bars would be like trying to count the stars in the sky.
So, I’ve listed the three most profitable ways to use them below and given you a quick guide on how to use them yourself.
Pin Bars At Support And Resistance Levels
The most famous way of trading Pin Bars (and probably the best one, at least in forex) is at important support and resistance levels.
On their own, Pin Bars and support and resistance levels aren’t great:
Pins often fail to cause price reversals, and sometimes price busts through S & R levels like they’re not even there.
But when a Pin Bar forms at a support or resistance level, the chances of a reversal go up significantly, making it a powerful and accurate trading strategy.

To trade Pin Bars at support and resistance levels, mark some levels on your chart and then wait for price to reach one of them. Now watch price to see if a bullish or bearish Pin Bar forms – look for bullish pins at support levels and bearish pins at resistance.
If a pin shows up, enter a trade using one of the two entry methods I’ll talk about later.
Easy peasy.
At Fibonacci Retracements
Trading Pin Bars at Fibonacci retracements is also an option.
Now, you won’t get as many trades compared to trading at support and resistance (S & R) levels. Why? Because retracements (those little reverse movements in a bigger trend) don’t happen all the time.
But don’t fret!
The trades you do manage to get usually have a higher chance of success, which makes this strategy a good deal.
So, how do you trade these pins?
Just wait for the price to hit a retracement level and then see if a bullish or bearish Pin Bar forms.

Take a look at the image.
You’ll notice a quick drop in price which breaks through several retracement levels before it reverses at the 61.80% level. This resulted in a bullish Pin Bar forming. After this pin showed up, price completely reversed, rising almost 70 pips in this case.
Heads up: Only trade bullish Pin Bars which form at retracements during upswings and bearish pins that form at retracements during downswings.
On Their Own
Pin bars are best traded at support & resistance levels or Fibonacci retracements.
However, you can also trade them on their own, without any other confirming factors.

The important thing to remember when trading Pin Bars alone is to always consider WHY they’ve formed in the market.
Pin bars don’t appear for the same reasons every time.
Most develop because people are buying and selling for reasons not related to causing significant reversals, like taking profits or closing trades, for example. These pins rarely result in successful trades, so you should avoid them as best you can.
Before you make a trade based on a Pin Bar, always look at WHERE the Pin Bar has appeared and then think about WHY it might have popped up there.
Ask yourself: “Did this Pin Bar show up because traders are taking profits, or do traders actually want price to reverse from here?”.
How To Trade The Pin Bar Once It Has Appeared
There’s two different ways to trade Pin Bars once they form:
Method 1: Market Order Entry
This method involves using a “Market Order,” or an “Instant Order” as some call it.
So, how do you do it?
- Wait for a Pin Bar to close.
- Enter using a market order.
- Place a stop above or below the high.
Easy!
The great thing about the market order entry is it’s a surefire way to get into a Pin Bar trade. But the downside is, it needs a bigger stop loss than the other method, the limit order entry. This means you might have to risk a little more money using it.
Method 2: Limit Order Entry
This one involves using a “Limit Order” – an order set at a price the market hasn’t hit yet.
You’ll often see price backtrack to the halfway point of a Pin Bar before it fully reverses. If you place an order at this halfway price, you can get in at a lower price.
That means less risk and more reward – sounds good, right?
To do this, find the middle of the pin (you can use the fib tool on the high and low, and look for the 50% level), and then place your order at the 50% level price.
Example Of Pin Bars In The Market
Pin Bars can form in all market situations; during upward trends, downward trends, consolidation, you name it.
That’s why they’re so worth watching out for.
To help you see what they look like in these situations, and to give you some tips for trading them, let’s check out a few examples of Pin Bars in the market.

This is what I’d call the “classic” Pin Bar setup:
Price climbs to a resistance level, spikes beyond it, and then reverses and falls. This creates a long wick and causes a bearish Pin Bar to form.
Take note of how the wick sticks out, even compared to the candles around it. These are the kinds of pins you want to look for: a small square body at one end of the candle and a long wick either above or below the candle.

This picture shows a few pins at support levels.
Pin bars which go against the current trend don’t usually perform too well.
Sometimes they can cause a reversal, but more often than not, price just blasts right through them. This is usually because they’ve been created by profit-taking.
If you really want to trade a Pin Bar against the current trend, make sure it has a massive wick and it also falls inline with multiple technical levels – like a pin which has formed at a strong level of support and a retracement level.

Pin Bars also form frequently during consolidations.
The best ones (the ones you should be trading) appear at the sides or edges of the consolidation and usually mean a move back to the other side is about to happen.

See how the pin above formed at a support level in line with the 61.80% retracement level?
That’s what we call a point of confluence. It’s when a pin, support level, and fib retracement all meet at the same point.
This increases the chances of a reversal happening.
The 3 Most Common Mistakes People Make Trading Pin Bars
I see people mess up with Pin Bars all the time, again and again.
Some mistakes are common and we all know about them, like trading against the trend. But some are not so obvious, mostly because some books and forex experts have been giving people confusing info about what Pin Bars are and how they form.
To help you steer clear of these mistakes, here are the top 3 that I see the most…
Mistake 1: Trading Pin Bars Against The Current Trend
Going against the trend is never cool, but it’s a slip-up Pin Bar traders make all the time.
Most of the pins which form against the trend don’t become successful, and there’s a simple reason for that – profit taking.
Here’s the deal:
9 times out of 10, pins which form against the current trend are created by traders taking profits… NOT because they’re buying or selling to cause a reversal. These pins usually don’t cause a reversal, because traders still want price to keep moving in the direction of the trend.
Sometimes they work, but most of the time they don’t.
So, just avoid them.
Mistake 2: Trading Pins Created When Volume Was Low
This is a mistake many traders make, but I think most aren’t even aware of it.
A Pin Bar which forms during a low trading volume time, like when a pair is outside its normal trading hours, does not have a strong chance of causing a reversal.
And here’s why:
To reverse price, big money traders (like the ones in banks and hedge funds) must be actively trading.
If they’re not around, which they aren’t outside of normal trading hours, any Pin Bar which forms probably won’t cause price to reverse. The incentive and liquidity to make price reverse and move the other way just isn’t there.
Quick Note: Pins created when trading volume is low are usually much smaller than other pins.
Mistake 3: Trading Pin Bars Appear After Steep Rises/Declines
Ever noticed a “pin” appearing right after a steep rise or drop, and tried to grab the reversal, only to see price continue going up or down?
Frustrating, right?
These pins often seem to meet all the right conditions, but they rarely work, and there’s a simple reason why:
They’re created by profit-taking.
Just like pins which appear against the current trend, Pin Bars created after steep rises and falls typically form because smart money traders are taking profits. They’re not the result of banks buying or selling to reverse the current price direction.
These types of pins don’t have a high chance of sparking a reversal. But because they look convincing, people often trade them, thinking they’re solid signals.
So, here’s a tip: Don’t jump on pins created right after steep rises or falls.
Wait it out.
Look for other signs a reversal might be on the horizon, like pullbacks and the formation of several highs or lows at similar prices.
If another pin forms after those signals, then give the trade a go.
The Bottom Line
The Pin Bar is a trusty sidekick you can always count on – easy to spot, simple to trade, and always ready to help you bag those major reversals. Whether you’re just starting out or you’ve been trading for years, the Pin Bar is a versatile setup that can fit seamlessly into your strategy.
Why’s it so great?
- Clear as Day: That distinctive long wick (or tail) makes it easy to identify on your charts.
- No-Nonsense Trading: The entry and exit rules are straightforward, making it beginner-friendly.
- Backed by the Big Boys: Pin Bars often signals where the institutional players are making their moves.
So, if you’re looking for a reliable, high-probability setup to add to your trading arsenal, the Pin Bar is definitely worth considering. It might not be the flashiest setups, but it’s the one you’ll keep coming back to time and time again.
Pin Bar FAQ’s: Your Questions Answered!
Still scratching your head about pin bars? We’ve got you covered. This comprehensive FAQ tackles the most common questions and concerns about trading with pin bars. From identifying pin bars to managing risk, you’ll gain the knowledge you need to trade pin bars like a pro.
Hi,
During the weekend, i read your book about pinbar for more than 3 times. Im still digesting by studying the past chart from my trading platform.
There are 2 questions appeared now in my mind:
1. The validity of signal when appeared at area of pinbar, is 24 hours timer still valid or can use let say 48 or 72 hours area?
2. Is pinbar reversal can say it supply when appeared on top and demand when appear on bottom?
3. About profit target, in your book, you mention in detail regarding entry location, criteria, reason and stop lose. May i know how to determine the profit target? Is it last significant swing low/high? Trailing stop? Risk:reward ratio?
4. This question is abit out from pinbar, how if i see engulf candle in the area of pinbar reversal, what should i do?
So far thats all my questions that appeared after reading you new ebook about pinbar.
As usually thank you in advance for your reply.
Regards,
My Response:
YES, the 24-hour rule is still valid.
Pin bar setups:
These aren’t exclusively meant for trading at supply or demand zones. However, it’s a different story when it comes to institutional reversal pins.
The majority of substantial reversals will kick off when the market hits a supply/demand zone, or a buy/sell zone. These reversals will usually show multiple swing highs/lows before the reversal fully takes place.
The institutional reversal pin one you’d ideally be trading often appears as one of these pre-reversal swings.
Your Second Question:
I’m a bit unsure about what you’re asking. If you could provide a bit more context or rephrase it, I’d be more than happy to answer it for you.
Profit Targets:
I honestly don’t have any set in stone… Instead, I prefer moving my stop to secure profit as the market swings in the direction of my placed trade. On occasion, I’ll aim for a higher timeframe supply or demand zone, or a buy or sell zone, but only if I believe the market is likely to reverse once it hits the zone.
The decision hinges on the strength of the zone, which, in turn, depends on how many orders were entering the market when the zone formed.
Whether an engulfing candle forms or not doesn’t affect your trade as long as the market hasn’t breached the most recent point where the banks have positioned their trades.
Your Trade stays open regardless of whether an engulfing candle forms after the pin bar. If you’re trading an institutional reversal pin and an engulfing candle pops up, you keep the trade open until the market pierces through the point where your stop is located.
For a bullish reversal, the market would have to cut through the lowest swing low formed during the reversal for your trade to be closed.
For a bearish reversal, the engulfing candle would have to push the market through the highest swing high formed during the reversal to close your trade.
I hope this clears things up,
Best Regards,
PAN.
Hello,
I was so eager to start today… I sat down at the computer, setting up my alerts so I only watch the last 5 mins of the hour and the first 5 mins…Tried to find pinbars… Saw some, not much, but got mixed up in thinking how to use it in combination of trading towards the recent new HH/LL…
I’m so sorry, but I messed it up in my head…
Read the pinbar articles of yours I’ve printed but it still doesn’t make sense how to practically trade a pinbar towards the last high/low… It all seems that, once the new High/Low is set, after a new pinbar the trend has changed?
Could you please do me a favor by marking a H1 chart and trading the pinbar towards the new high/low how you suggested in your email?
I hope I can be more ready tomorrow… Hope I didn’t let you down by writing this…
Talk soon,
My Response:
Don’t sweat it!
You’re just getting your feet wet with a new method; no one expects you to be an ace right off the bat.
Let me break it down for you:
I’ve attached an image of today’s USD/JPY action.
At the top, you see last week’s low.
As the market opened today, price dipped and a new low formed. That’s your cue to hunt for a bearish pin bar, as the lower low hints at more downside.
A small rebound happened, ending with a less-than-obvious bearish pin bar.
What you gotta do is hunt for these elusive bullish and bearish pins amidst the retracement chaos.
It’s tricky with some currencies where retracements look more like consolidations, offering more false signals.
Look at the current EUR/USD down-move for an example.
Post bearish pin, price took a nosedive, made a new lower low, and paused.
Four candles into the pause, another bearish pin popped up, and the price dropped again three candles later.
Takeaway?
Both bearish pins emerged after the market hinted at wanting to move lower (think new low).
And hey, they both paid off!
When you’re scouting for pins, keep your eyes peeled for a recent high or low break. Old lows and highs? Irrelevant.
What matters is the most recent low/high.
Spot a new one?
Wait for a retracement and watch for a pin bar to form.
Once it pops up, place your trade long or short.
You’re facing minor hurdles that’ll fade away as you gain more experience with pin trading. Hang in there!
Good morning,
Haha, you said I can go ahead with more questions, so here is one regarding the pin bars:
It is my understanding that you prefer engulfing bars versus the pinbars. Why is that? Imagine a bearish engulfing bar following a bullish bar, and a bearish pin bar with the close lower than the open (on a H1 chart, for example).
Isn’t it the same price action in both cases, only for the pin bar it happened faster, in only one hour instead of 2? I would say the pin bar carry the same significance in this case, or maybe more.
Of course a bearish pin bar but with the close higher than the open will be less significant than a bearish engulfing.
But if you put a pending sell order below his low (expiring in one hour) and it gets triggered, the resulting trade will be similar to a bearish engulfing trade, right?
Have a good day!
Cheers,
My Response:
In terms of candles, I tend to lean towards engulfing candles for entries into supply or demand zones.
When it comes to trading pins and engulfs independently, I don’t really have a preference.
You’ve made a good point about pin bars with a lower close than the open technically being engulfs.
Yet, what we need to remember is: we can only perceive this engulf if we switch to a different time-frame…
If a bearish pin bar forms on the 1-hour chart, composed of a bullish candle and an engulf on the 30-minute chart, traders observing the 1-hour chart would interpret it as a pin bar. This influences their reactions differently than how they’d respond to a bearish engulfing candle on the same 1-hour chart.
So, it’s a bit of a paradox: yes, the pin bar is technically an engulf, but simultaneously, it isn’t…
To see it as an engulf, we must change time-frames.
I hope this clears things up.
Hi Liam, I can’t see where I can purchase your course?
Really understandble work sir keep it up I really like it and understand it too
Thank you so much for all the content, it is extremely helpful. Is your course still available?