
In today’s post, I’m going to unveil a tool pivotal for decoding price movements: the Fibonacci retracement tool.
Or, as I like to call it, the “Fib tool”.
Imagine having a souped-up version of support and resistance lines, pinpointing potential price reversal zones during a pullback. The best part? The Fib Tool automates this for you, eliminating the need for those pesky subjective lines.
Here’s the game plan…
We’ll kick things off by demystifying what the Fib Tool really is and its inner workings. Trust me, it’s straightforward and won’t eat up much of your time. Next, I’ll walk you through the step-by-step process of integrating it seamlessly into your charts.
To wrap things up, I’ll share 3 killer strategies to supercharge your trading with the Fib Tool.
And hey, if you’ve got insights, queries, or just want to chat, hit up the comment section below.
Ready to level up?
Let’s jump right in!
Fibonacci Retracements In Trading
If there’s one thing that’s true about forex it’s price never moves in a straight line.
Most of the time price will advance, correct a certain distance, advance again, then correct a bit more before continuing to advance… and so and so forth.
This is the natural behavior of the market.
Price is ‘breathing’, expanding and contracting as money from different parties flows in and out.
When price moves in one direction and then starts to correct (move in the opposite direction), it’s called a retracement, or pullback as some people know.
I’m sure you’ve heard of these before?
Retracements offer a low-risk way to get into an existing trend or strong movement. The fact price moves counter to the main direction gives you an opportunity to buy low and sell high (or sell high and buy low if you enter short).
The Fibonacci retracement allows you to gauge when and where these retracements may end.
Through the use of some complex calculations, the tool marks 5 horizontal lines on the chart.
These lines, which can be thought of as support and resistance levels but marked automatically rather than manually, show the points where a retracement has a high probability of ending.
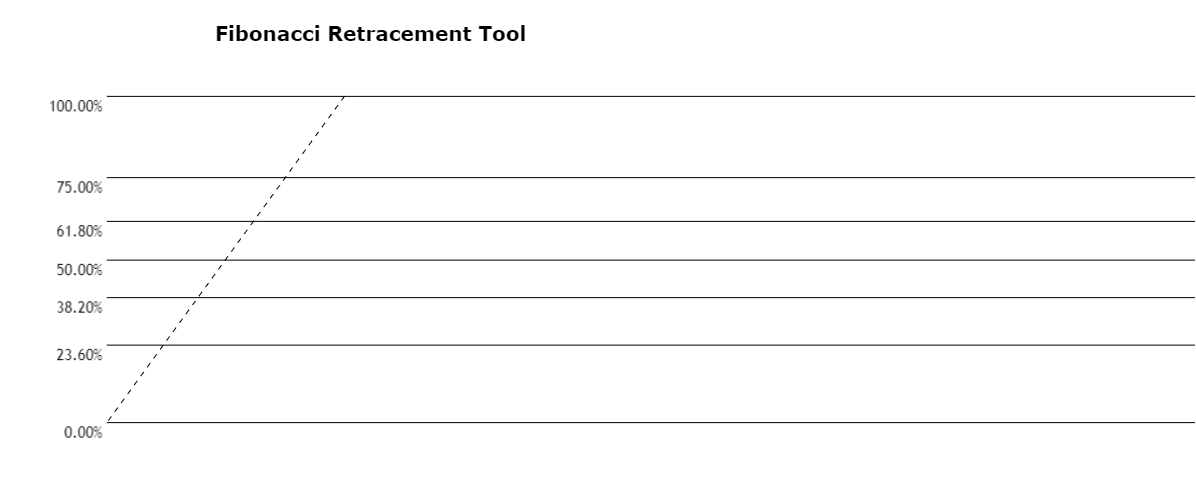
And here’s what the tool looks like.
As you can see, it’s just 7 horizontal lines – 5 if you count the 0 and 100 levels, which we don’t use in trading.
These lines are the retracement levels.
They’re the points the Fibonacci tool has calculated where price has a high probability of ending during a retracement or pullback.
See how each level has a little percentage attached?
This tells us how far price has moved back into the previous swing.
The reason the percentages look a bit odd, like 38.20%, 61.80%, and so on, is because of the calculations the tool uses.
The fib tool uses the Fibonacci number sequence, which is a fancy maths calculation, to find the levels and mark them on the chart. It works out these levels in numbers (for example, 38.20% is 0.382) and then converts them into percentages.
So that’s what the tool looks like, but how does it actually work?
Well, let me show you with a few examples…
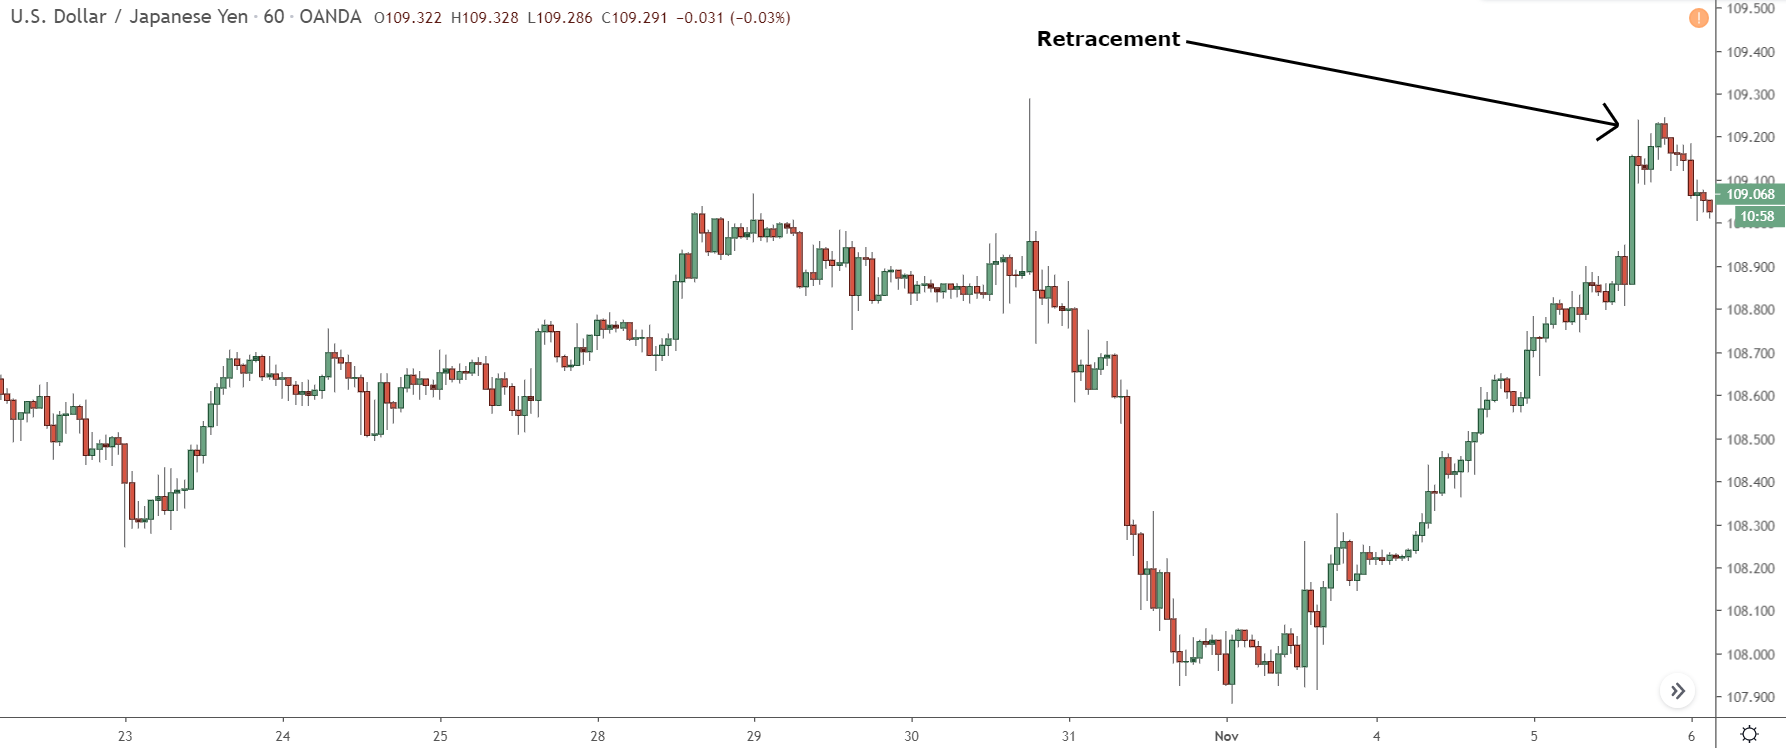
Here’s a retracement on the 1-hour chart of Eur/Usd.
Usually, you might use support and resistance levels, or if you’re a bit more experienced, supply and demand zones, to guess where this retracement might stop.
These methods are pretty solid – they often match up with where retracements actually end.
The issue is, they’re not specifically designed to pinpoint the end of retracements. They’re more like techniques used to guess when a trend might reverse, but they’re being used for retracements. Because of this, they don’t always work that well.
As mentioned, they often line up where retracements end, but they’re not accurate in predicting them or showing how they’ll play out.
That’s where the Fibonacci retracement tool comes in handy.
The cool thing about this tool is that it’s specifically made for retracements, which means it’s much better at predicting where they’ll end and how they’ll develop.
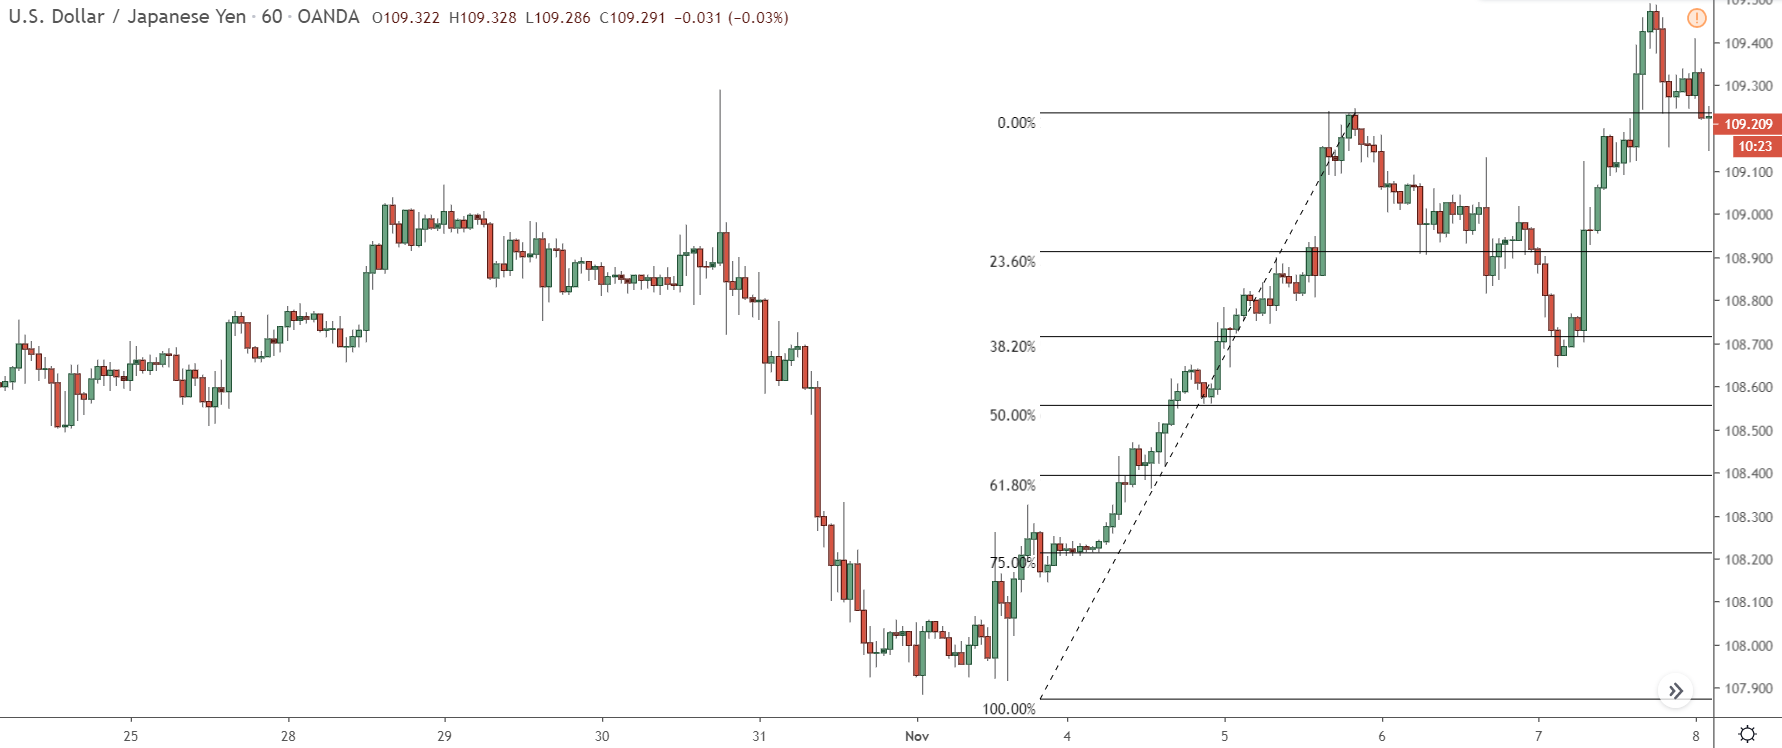
Here’s what the retracement looks like when we use the Fibonacci tool.
See how the tool showed the fall?
When the retracement started, price dropped for a while before finding support at the 23.60% level.
After hanging around for a few hours, price fell again before bouncing back to where the drop started. Another, much larger, drop followed until the price hit the 38.20% level.
At that point, it reversed, and the retracement ended.
Now, let’s take a look at another example…
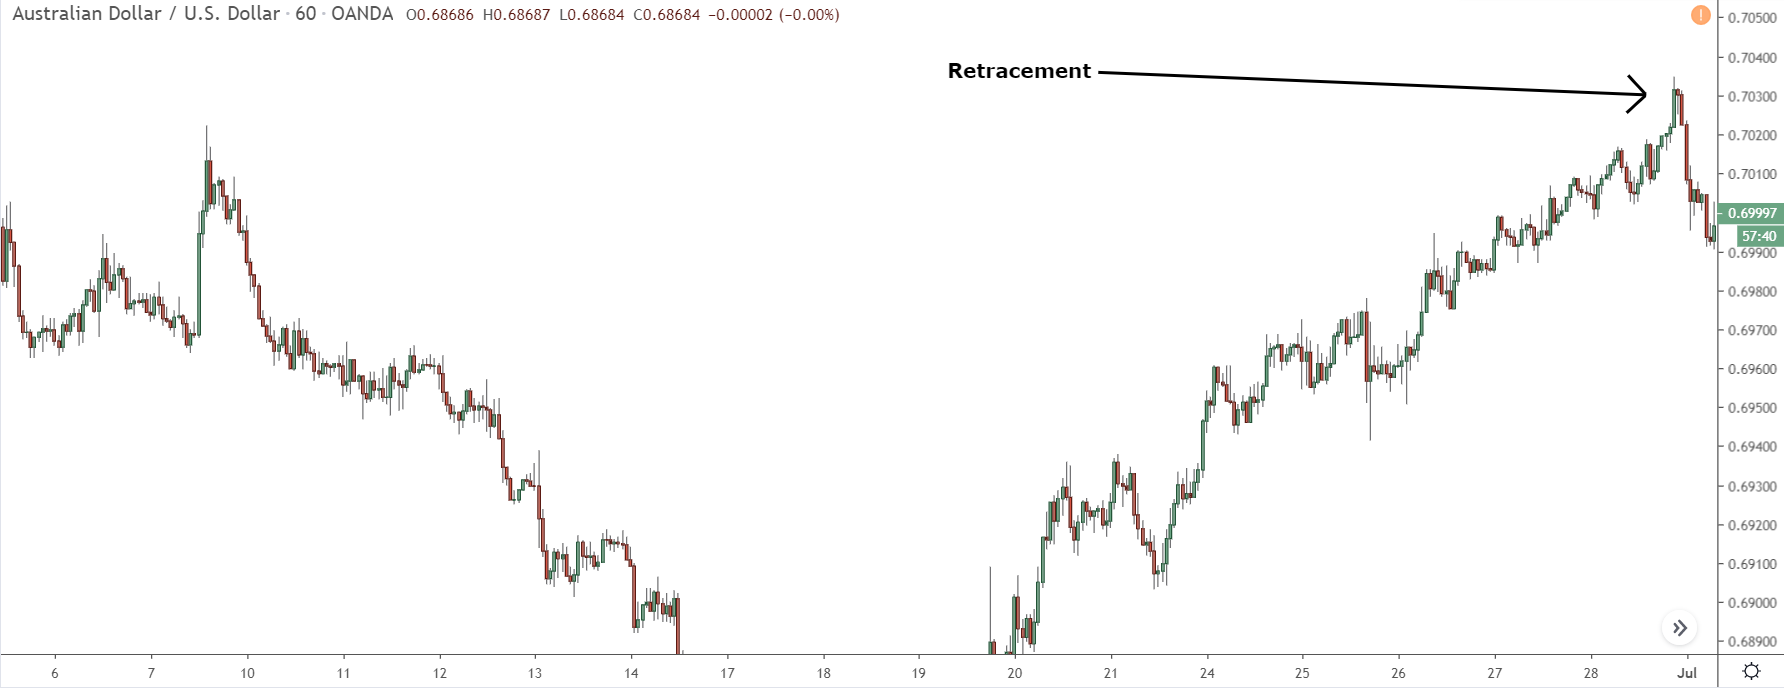
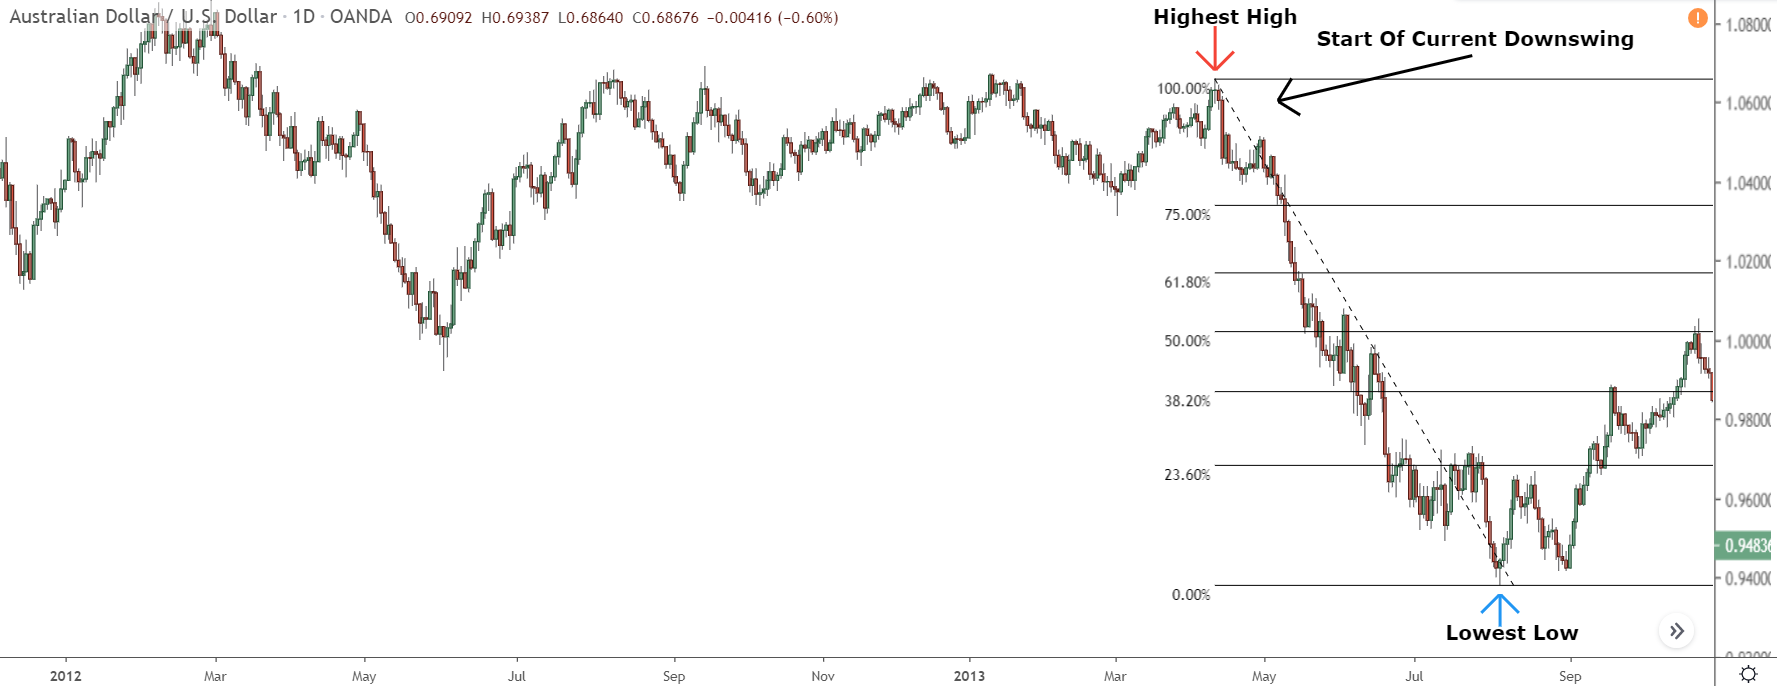
Here’s another retracement, this time on the 1-hour chart of Aud/Usd.
Again, normally we wouldn’t know where this retracement might end or how it could unfold. With the Fibonacci retracement tool, though, we have a good idea of both.
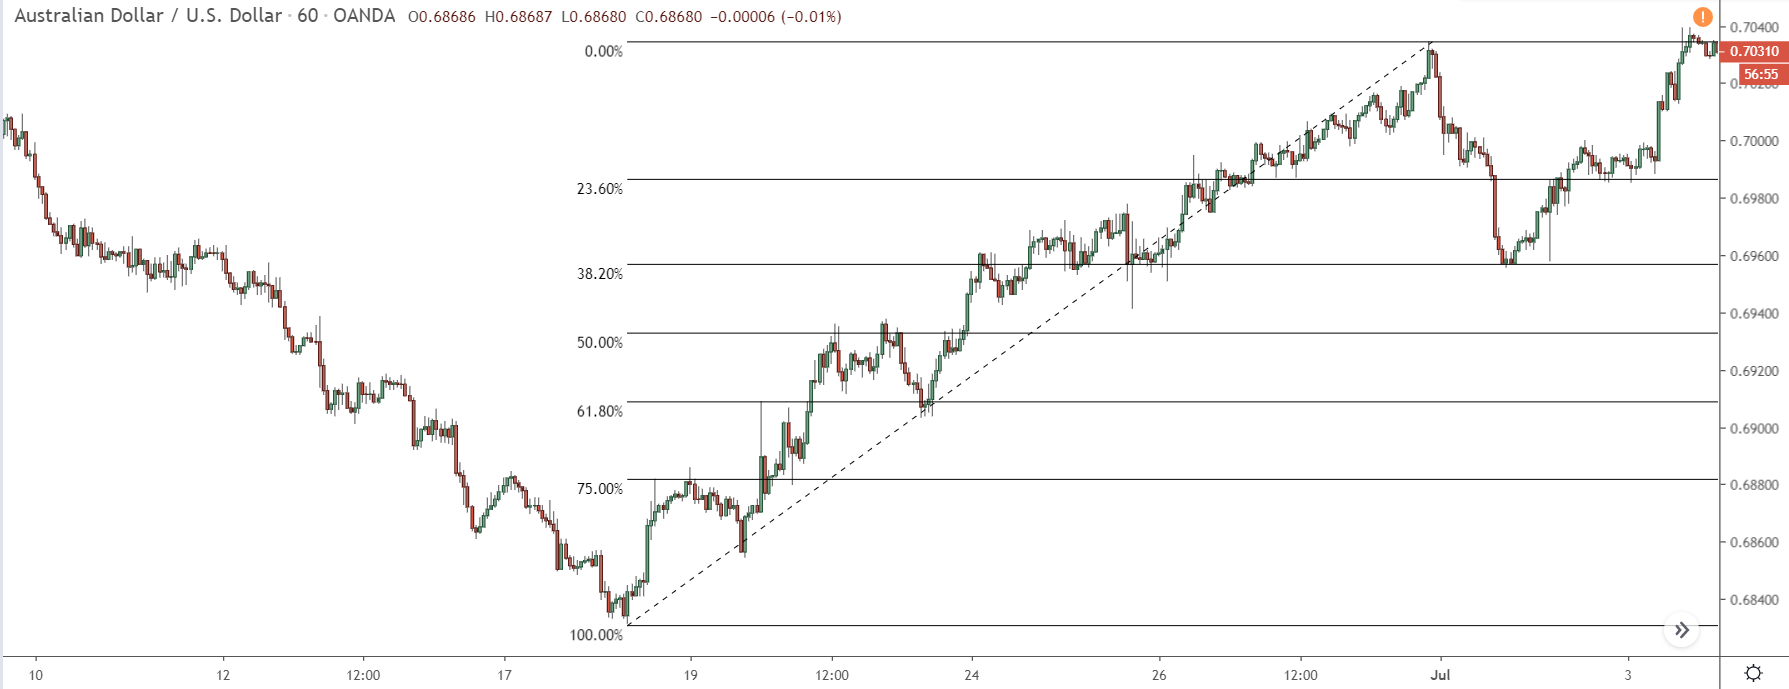
And here’s how it panned out.
Just like the other example, the tool predicted how the retracement would develop and where it might end. We didn’t see price stall at any of the levels like in the previous example, but it did reverse at the 38.20% level, which the tool marked for us on the chart.
Which Retracement Level Is The Price Going To Reverse At?
The Fibonacci retracement tool makes it easy to see where a retracement could end and how it might develop.
What it doesn’t do, however, is tell you which level price will ultimately reverse at.
It’s not all bad, though…
Even though the tool can’t tell you which retracement level price will reverse at, there are times when it’s more likely to reverse at one level over the other.
For example:
A correction after a sharp price movement is much more likely to end at the 38.20% or 23.60% retracement levels than the others.
The reason why is because traders and investors set greater profit targets after a sharp movement, (due to price covering a big distance in a short amount of time). This means they take less profit off their trades, which in turn, means price doesn’t correct as much during retracements.
For more gradual movements, the opposite is true.
Instead of being more likely to reverse at the upper levels (23.60% – 38.20%), price instead has a much higher chance of reversing at the lower levels (61.80% – 78.60%). This is because investors and traders take a lot more profit off their trades during gradual movements, causing deeper retracements to take place.
Keep in mind: Even though price is more likely to reverse at these ratios under differing conditions, it’s not guaranteed.
There will still be times when price reverses at the lower levels after sharp movements, and times when it reverses at the upper levels after gradual movements.
These aren’t cold hard rules, more just guidelines.
Another point: When you see price hit a retracement level, don’t assume it’s going to reverse.
The levels, while they all have a high probability of causing price to reverse, aren’t guaranteed. You have to wait until price has given a signal which confirms the correction is likely to be over before you enter.
How To Draw Fibonacci Retracements Correctly
Now that you’ve got a handle on what the Fibonacci retracement tool looks like and a basic understanding of how to use it, let’s get into the really important stuff:
Drawing the retracements the right way.
The Fibonacci tool doesn’t do all the work for you. It doesn’t automatically put the levels in place. You’ve got to do that yourself, based on the swing where the retracement is happening.
Mostly, it’s a breeze.
Just locate the swing, pick the tool, and then plonk it on the chart.
But wait up!
There’s a couple of key points you need to be aware of.
These will help you make sure the tool is set up right, and the levels appear where they’re supposed to.
- Identify the Swing High and Low: Fibonacci retracements are created by taking two extreme points (peak and trough) on a chart and dividing the vertical distance by the key Fibonacci ratios of 23.6%, 38.2%, 50%, 61.8%, and 100%. Therefore, correctly identifying the swing high and swing low is the first step.
- Correct Direction: Remember that retracements measure potential pullbacks within a trend. So, in an uptrend, you draw the Fibonacci levels from the swing low to swing high. In a downtrend, you draw from the swing high to swing low.
- Selecting Appropriate Timeframe: Just like other technical analysis tools, Fibonacci retracements can be applied on various timeframes. However, it’s often considered that retracement levels are more reliable when drawn on longer timeframes as they are based on larger price movements.
- Consolidation and Confluence: Pay special attention when a Fibonacci level coincides with other technical indicators such as supply and demand zones or major support/resistance levels. This confluence can provide more reliable retracement signals.
- Not All Levels Are Equal: While all Fibonacci levels can act as potential support or resistance, typically the 38.2%, 50%, and 61.8% are considered the most significant in trading.
Here’s what you need to do:
Step 1) Select The Fibonacci Retracement Tool
The Fibonacci retracement might be new to you, but it’s extreamly popular in forex. This tool is available on almost every trading or charting website you can find.
To select the tool on Tradingview – the site I use – click the 3rd icon down in the tool window…
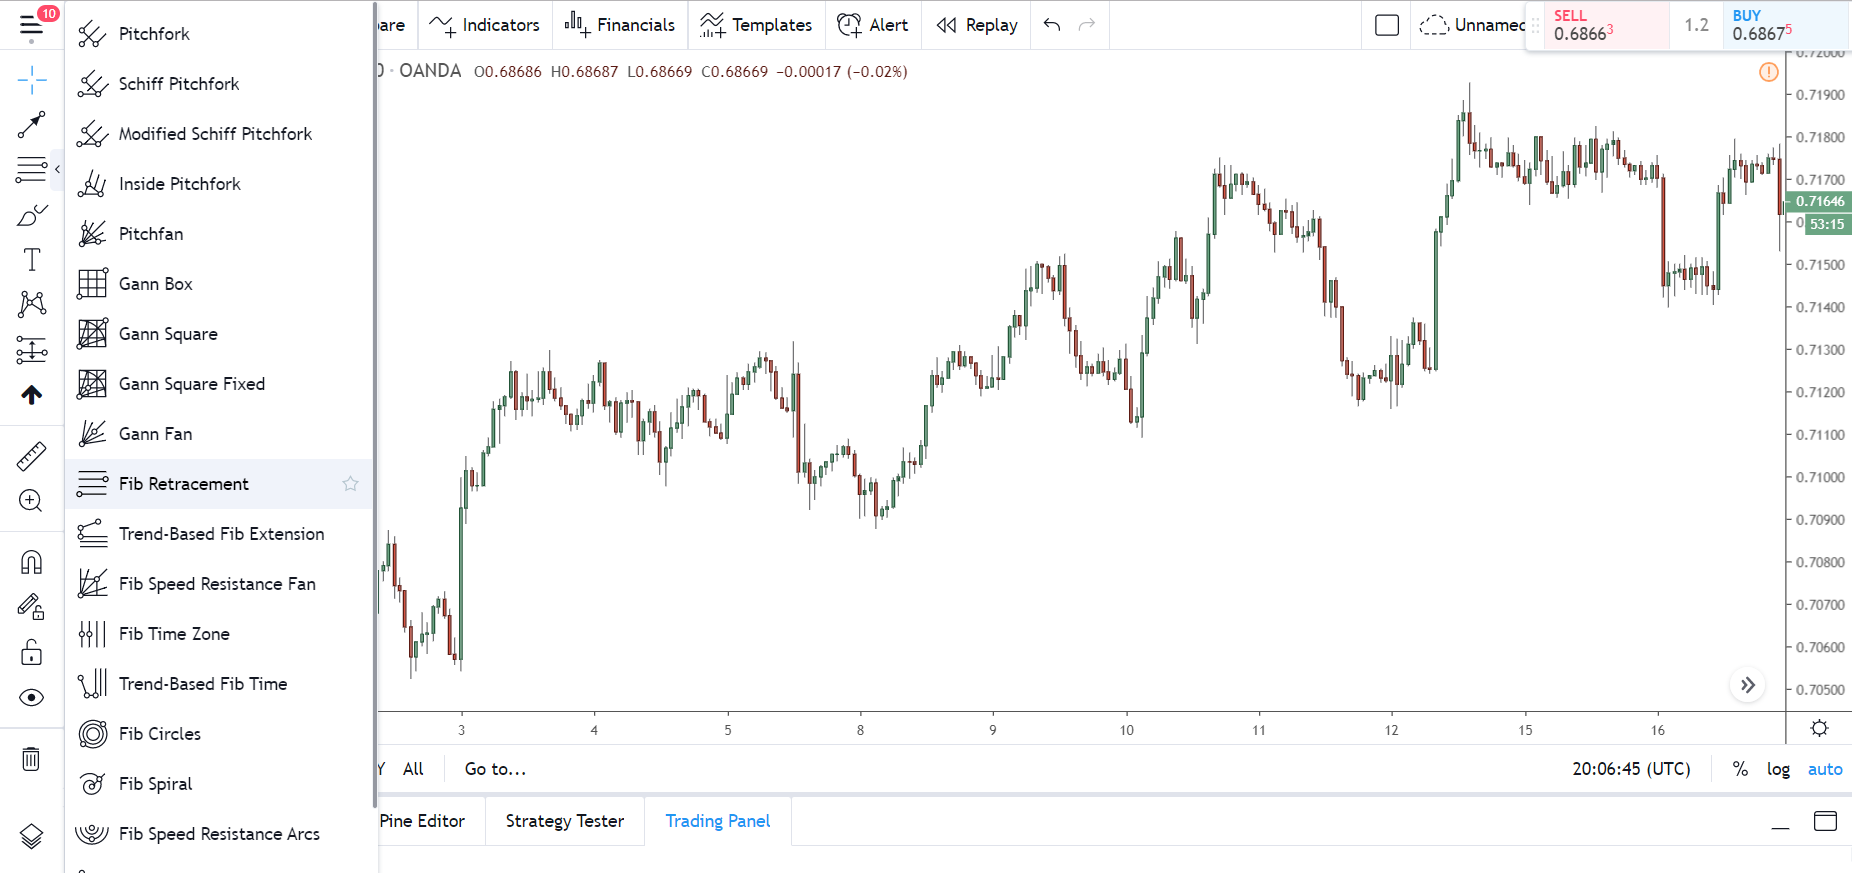
And then click the “Fib Retracement” from the drop down list.
Step 2) Locate The Beginning And End Of The Current Price Swing
Okay, here’s where things get a bit tricky…
The retracement tool calculates where the levels should be based on the prior price swing. So to mark the retracement levels correctly, you must find the beginning and end of the swing to which the retracement is taking place on.
A swing forms when price rises or falls for sustained length of time before moving in the opposite direction.
There are two types:
Upswings – Swings created when price rises for an extended period after previously falling.
Downswings – Swings created when price falls for an extended period after previously rising.
All price movement in forex consists of upswings followed by downswings followed by upswings and vice versa.
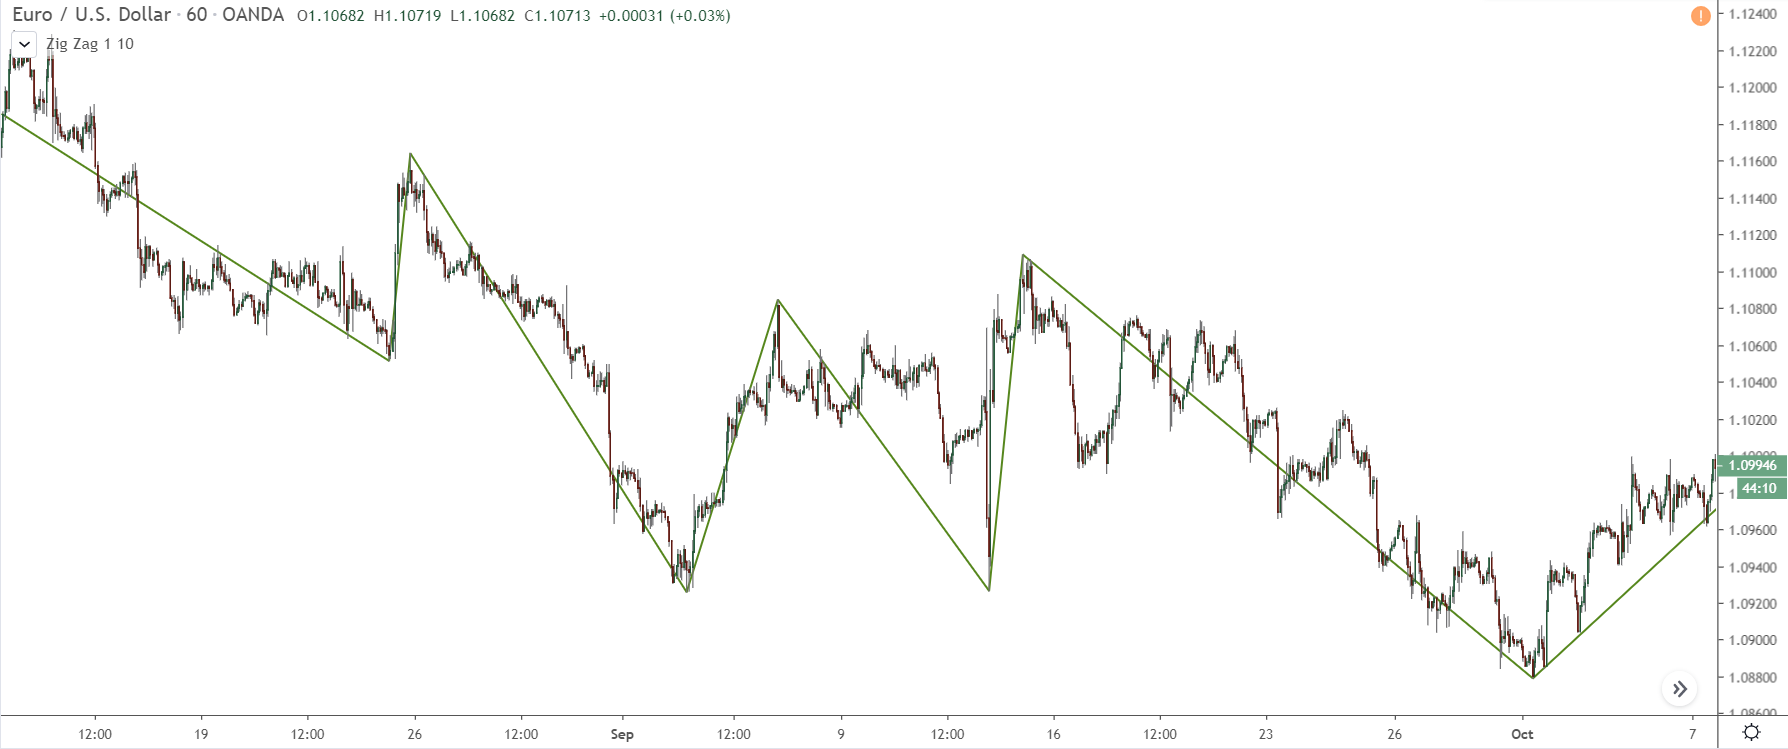
If I put a zig-zag indicator on the chart, this becomes obvious.
To figure out where a swing starts and ends, you first have to spot where the swing kicked off. Then, look for the spot where it terminated and price started moving the other way.
Here’s how you can do this for upswings:
Upswings
For upswings, the starting point is the low (called the swing low) formed at the lowest point of the sustained price rise.
How to spot it?
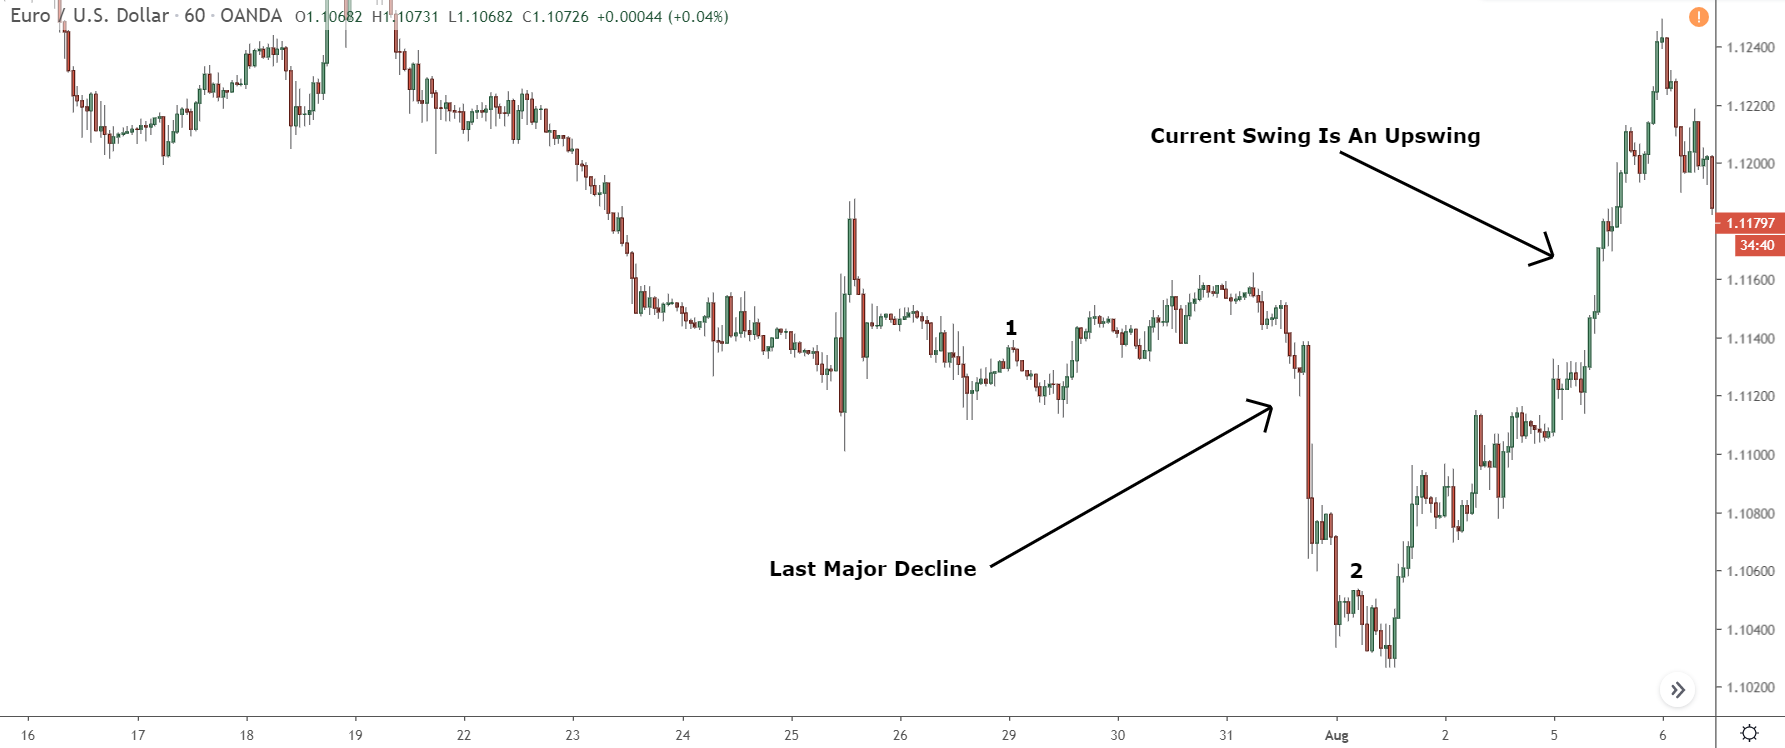
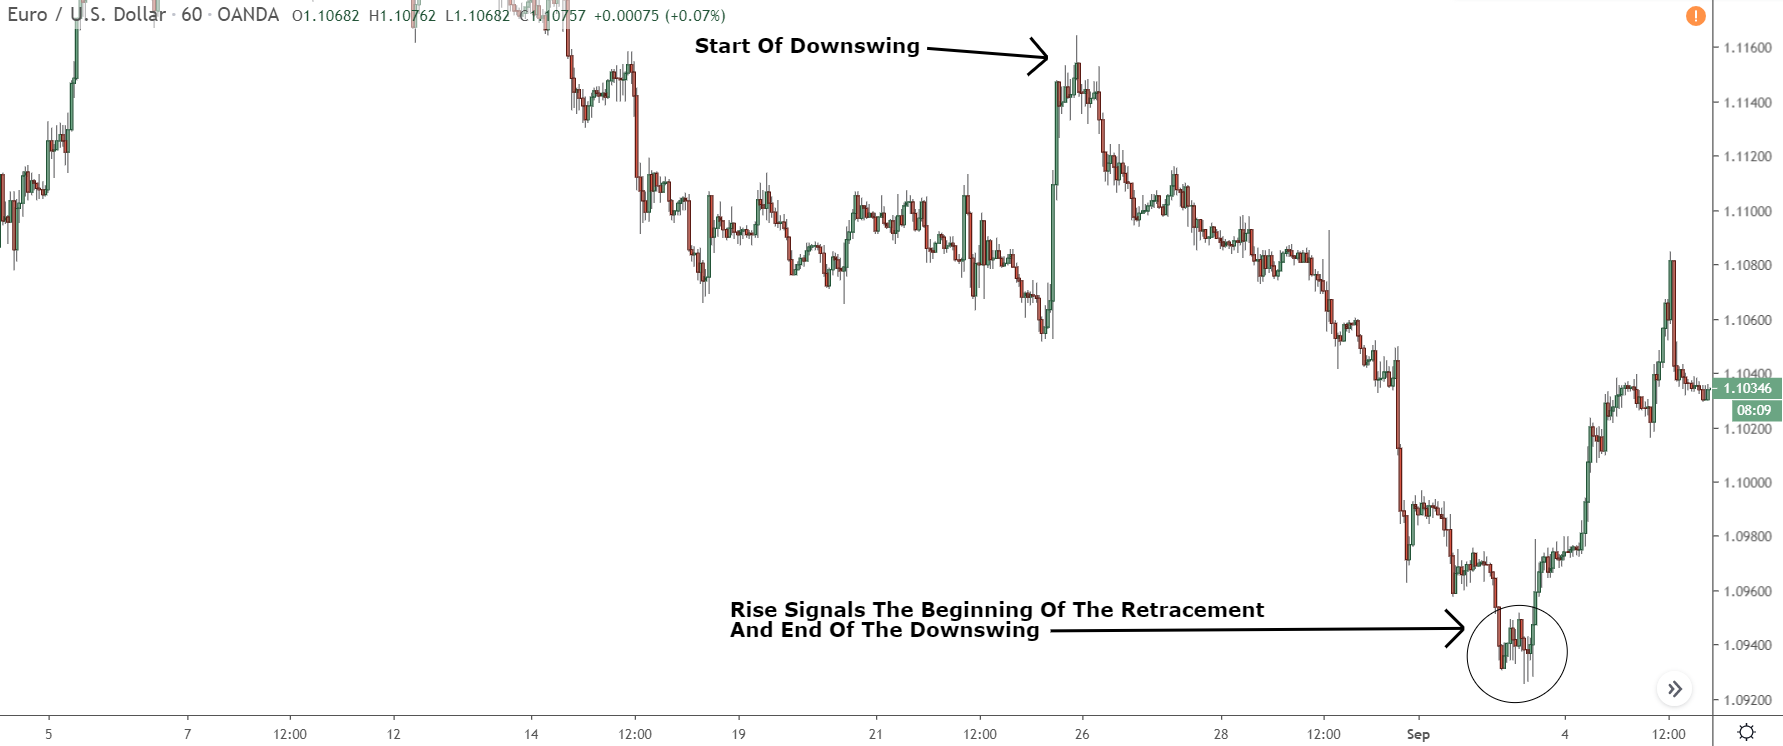
Look for the point where the last sustained price decline reversed and started rising. The lowest low found at this reversal is the swing low.
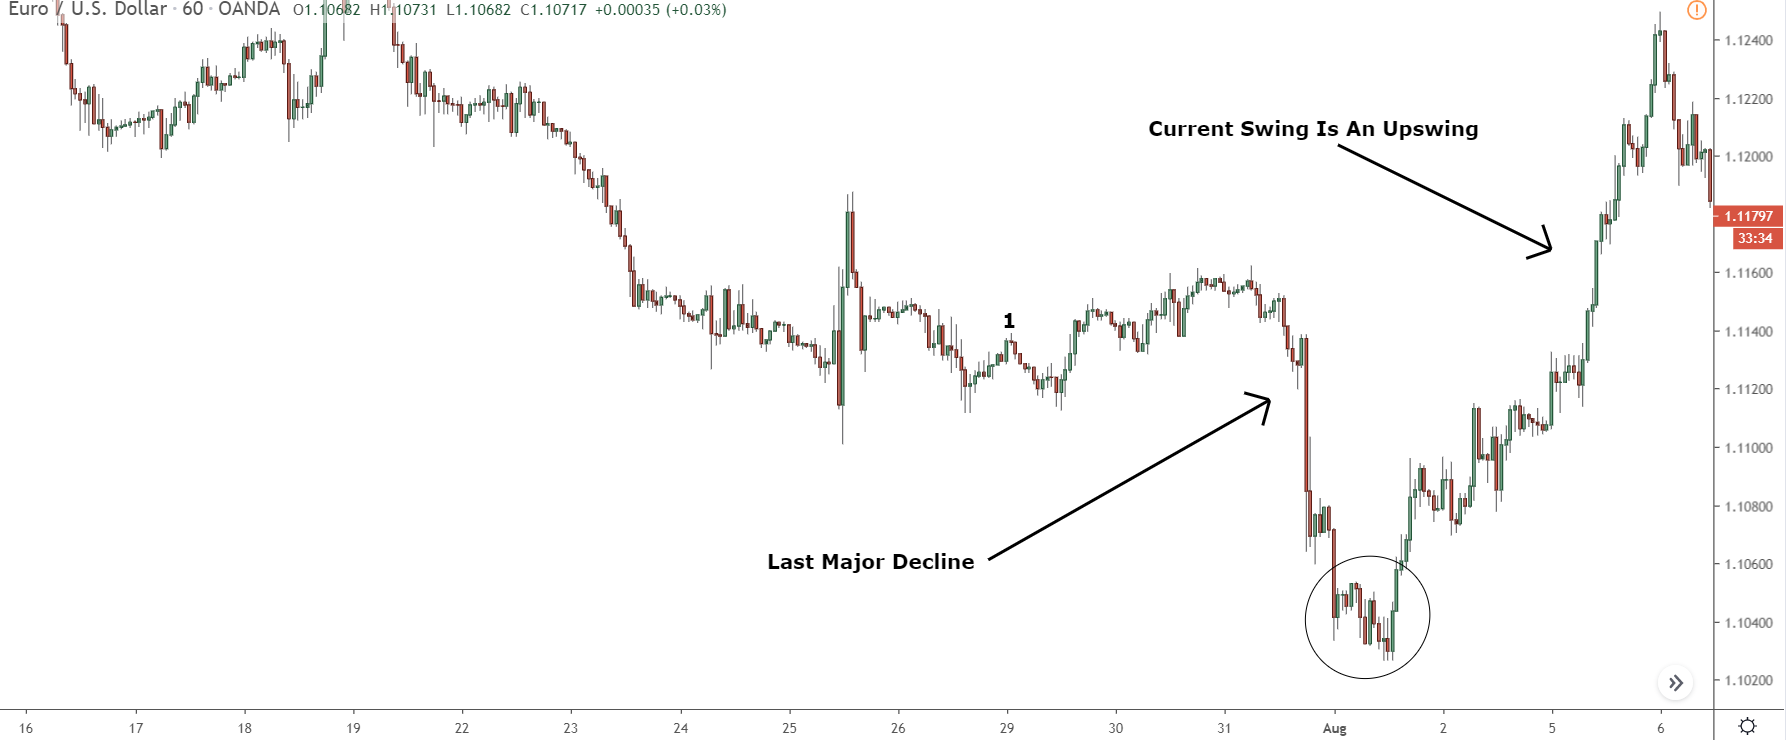
In this scenario, we see price reverse and begin rising where I’ve marked the circle. So, the swing low is the lowest low found at this point.
Figuring out where this upward swing ends is easy.
All you have to do is see where the ‘retracement’, begins.
This retracement is a downward movement. Like I mentioned before, downward movements always come after upward ones, and the other way around. Hence, the start of this retracement is actually the end of the previous upward movement.
Now, let’s shift our focus to downswings…
Downswings
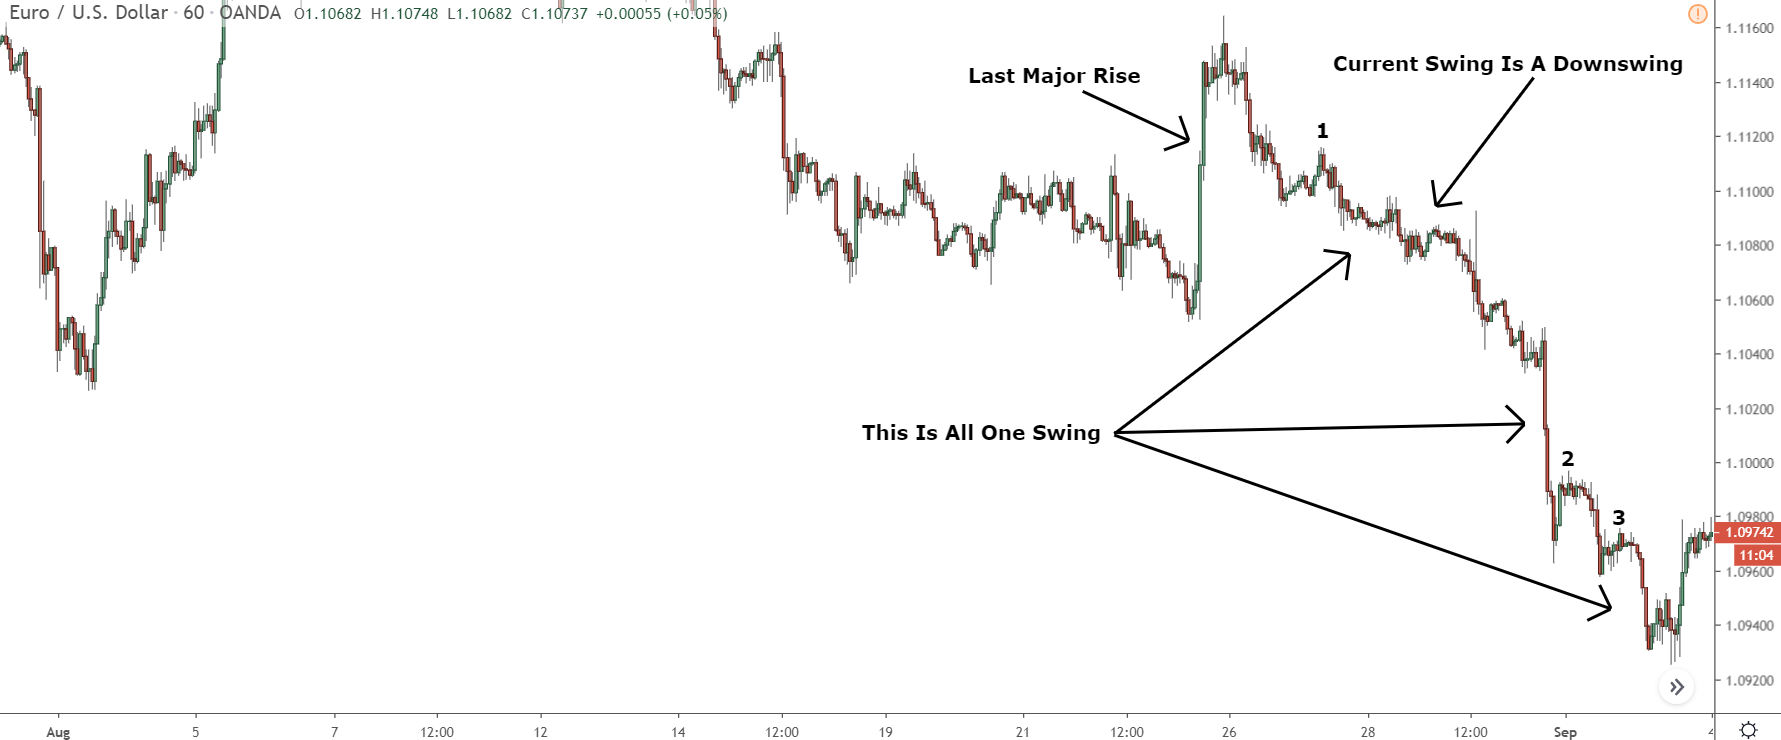
For downswings, the starting point is the high (called the swing high) formed at the highest point of the sustained price decline.
To find it, just look at where the last sustained rise terminated and a new sustained decline began. The highest point of the reversal is the swing high where you draw the retracement from.
In our case, the swing high is the highest price inside the outlined circle.
As with upswings, the easiest way to find the end of a downswing is to locate the beginning of the retracement since that’s the start of a new swing.
With that out of the way, let me show how how to place the tool.
Step 3) Drag The Retracement Tool From The Beginning Of The Swing To The End
So, you’ve found where the current swing begins and ends.
The next step is to place the Fibonacci retracement tool at the beginning of the swing and then drag it either down or up (depending on the swing) to the end.
The way you do this is easy: you just drag and hold from the beginning of the swing to the end. There are a couple of nuances to it, however, so let’s do a quick walk-through now.
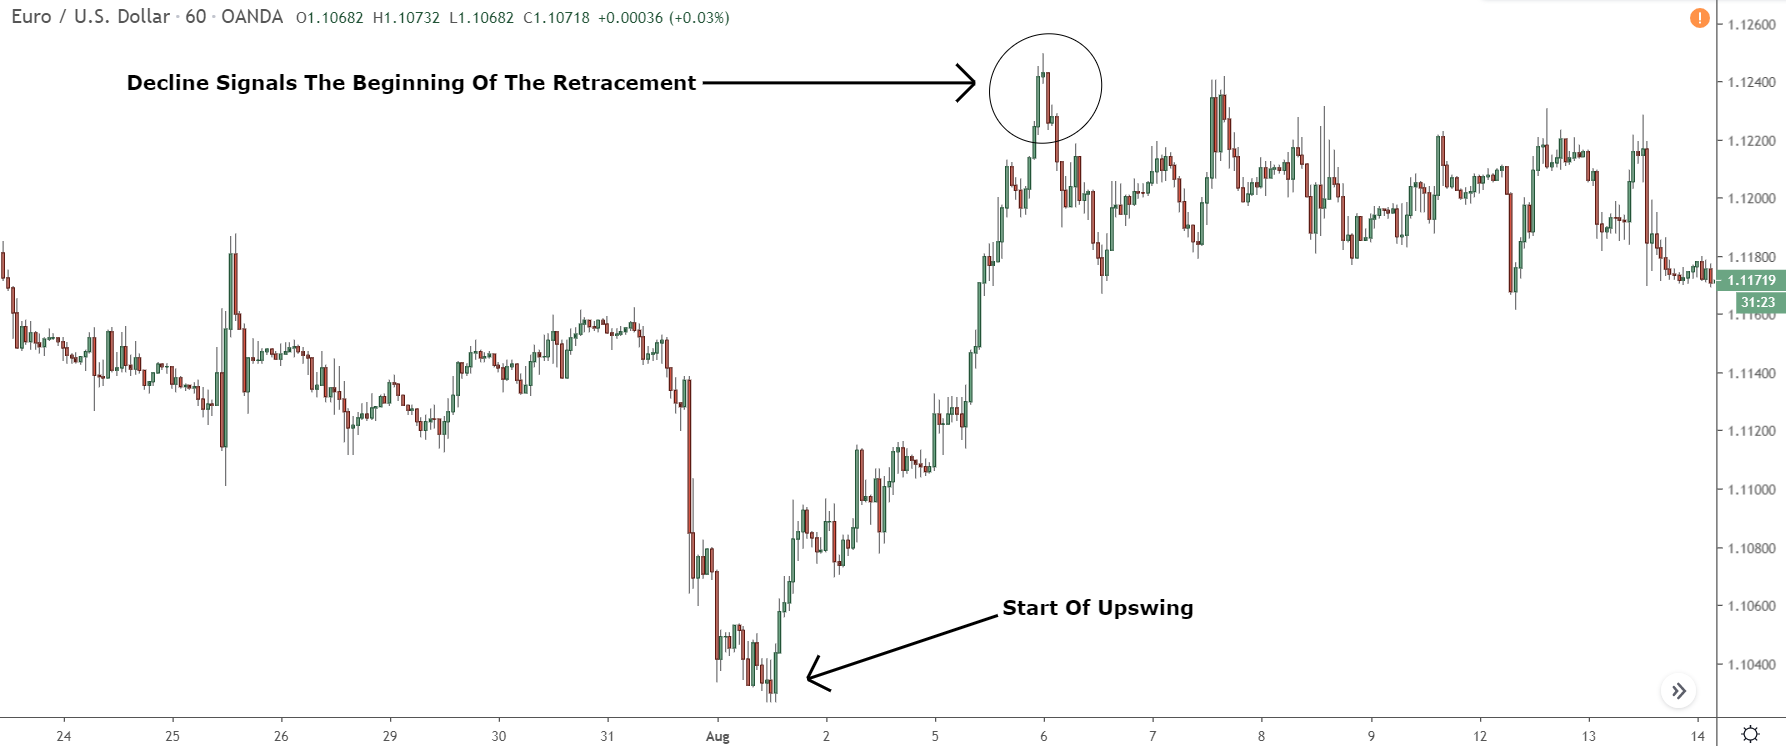
Upswings
First off, find the lowest low created at the beginning of the current upswing.
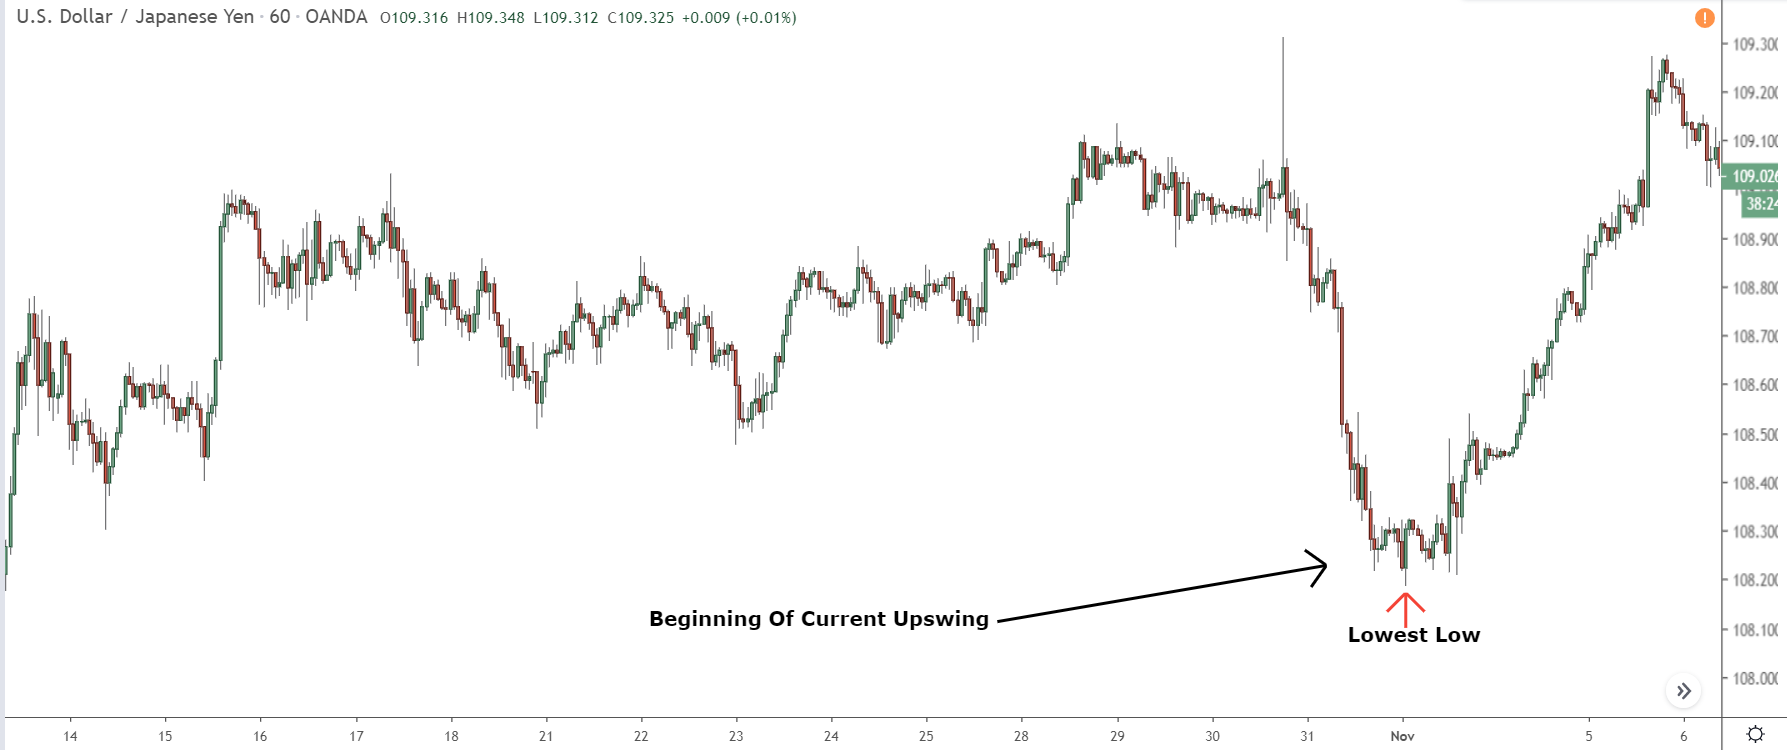
In our case, this is the low marked with an arrow.
Now click and drag the Fib tool up to the highest high created at the end of the upswing. As you drag upwards, you’ll see the retracement levels appear next to the swing.
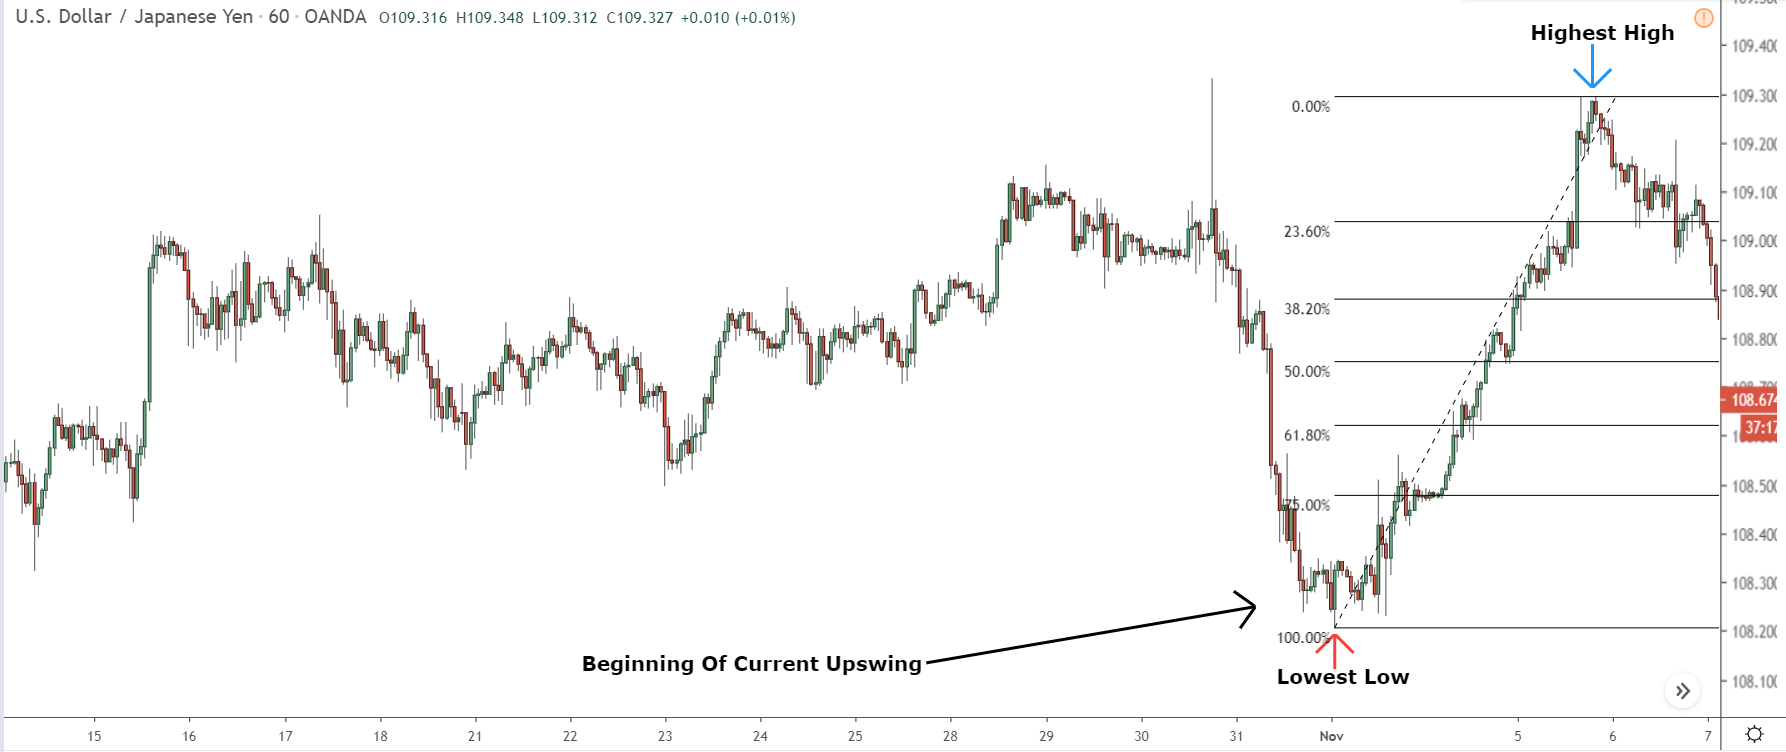
And with that, the tool is placed.
You can now start watching the levels for where the retracement may end.
Let’s take a look at downswings.
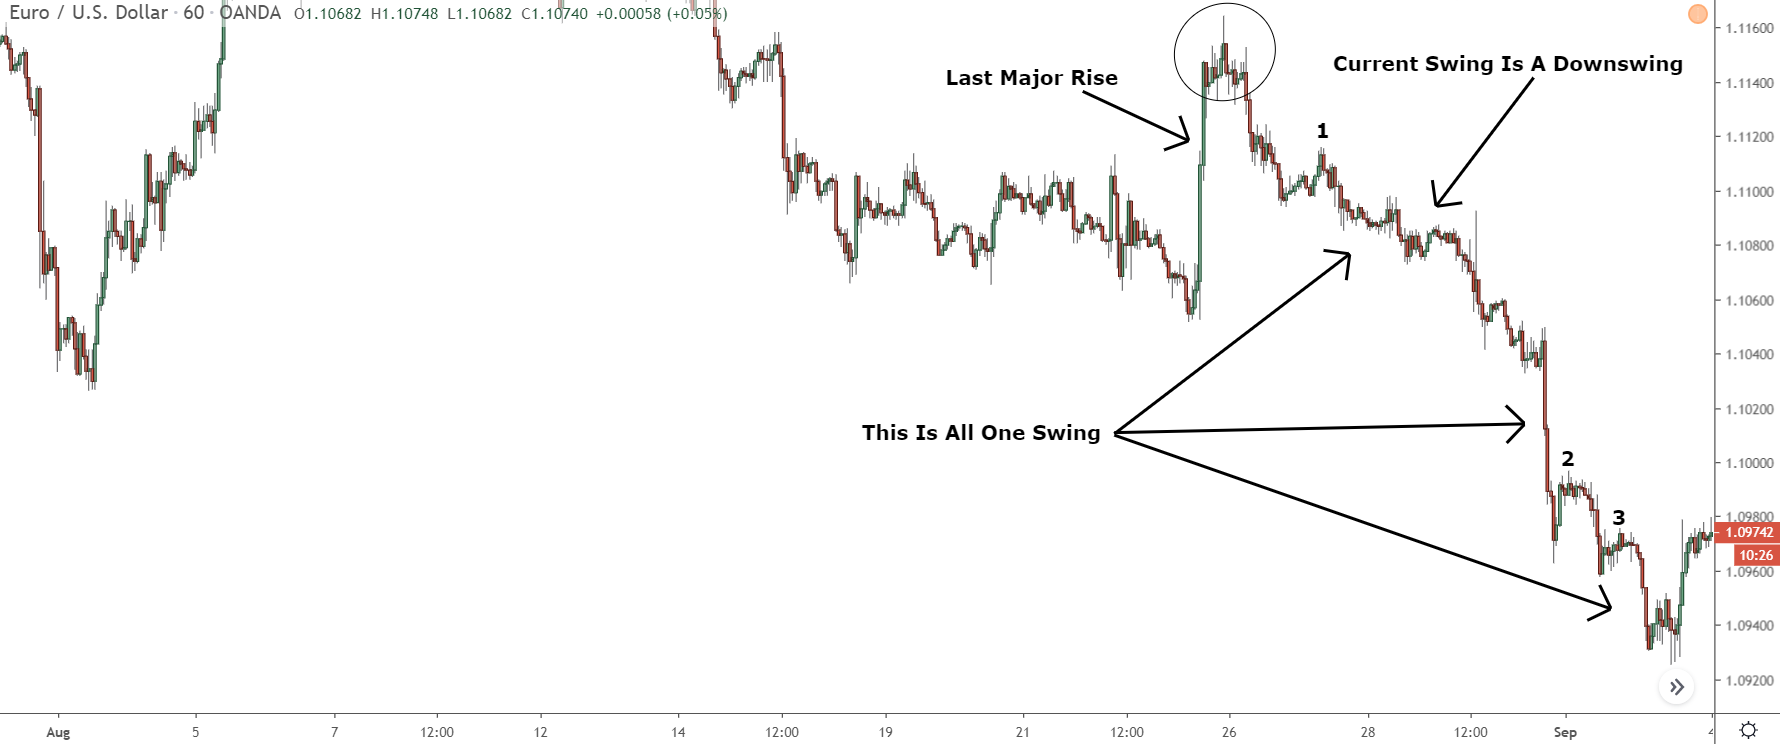
Downswings
So first, find the highest high that formed at the beginning of the downswing.
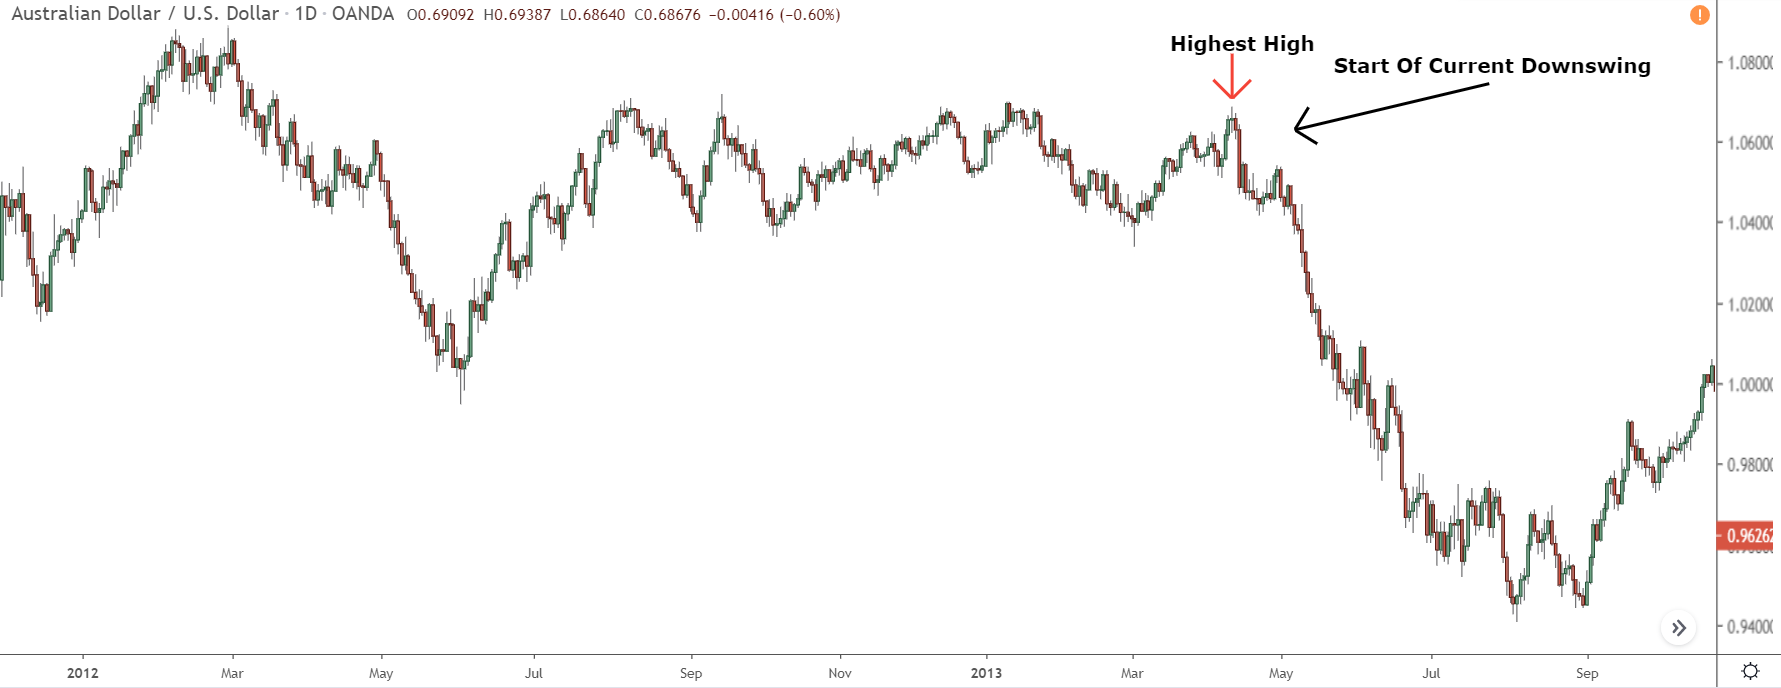
This is the high marked with an arrow in our case.
Next, place the tool on the high and drag down until it sits on the lowest low found at the end of the downswing.
With the tool placed, you can start watching the retracement levels for a reversal.
Pretty easy, huh?
3 Effective Ways To Use Fibonacci Retracements In Your Trading
The Fibonacci retracement tool is great for understanding where a retracement may end and how it’ll develop over time.
But how is that useful in real trading situations?
Well, in a few ways actually…
For one, it makes it much easier to get low a risk entry into a strong trend or movement, which, of course, helps us make more money. On top of that, the tool is great for finding confluence with other technical points, like support and resistance levels and supply and demand zones, so it enhances existing strategies too.
I haven’t got time to detail all the ways you can use the tool today, but here’s 3 I think are most effective.
Use Retracements To Get Into Strong Moves
Getting a low-risk entry into a trend or strong movement is not easy.
Price often moves so violently during these moves that either no entry appears or is over so fast it was impossible to get in. Retracements are one of the only times you can get into moves like these, and this is something the fib tool makes very easy.
Do you know how to trade support and resistance levels?
To trade support and resistance, you mark the levels on the chart, wait for price to return, and then see if an entry trigger, like a candlestick pattern, appears to get into a trade.
Well, get this…
You use the retracement tool to enter trades in the same way.
By waiting for price to return to each level and then seeing if a candlestick pattern or some other entry signal appears, you can get a low-risk high reward entry into a strong trend or movement.
A great example of this is seen below…
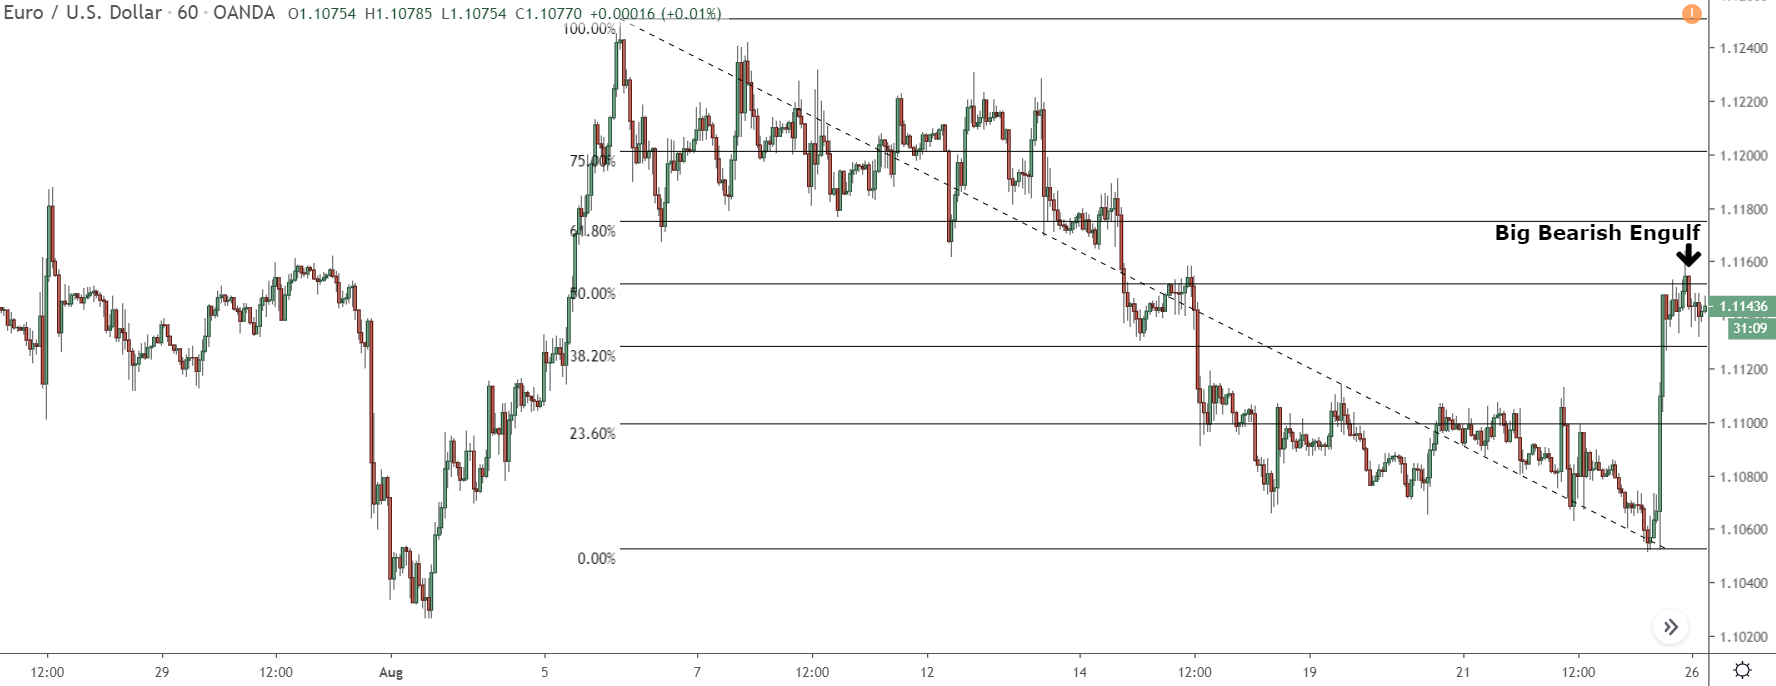
See how a large bearish Engulfing pattern formed at the 50.00% level?
Similar to trading supply and demand or support and resistance, when we spot this Engulfing pattern forming at a retracement level, it hints price might be on the verge of changing direction.
That’s a handy signal to sell, or ‘go short’.
So, what comes next?
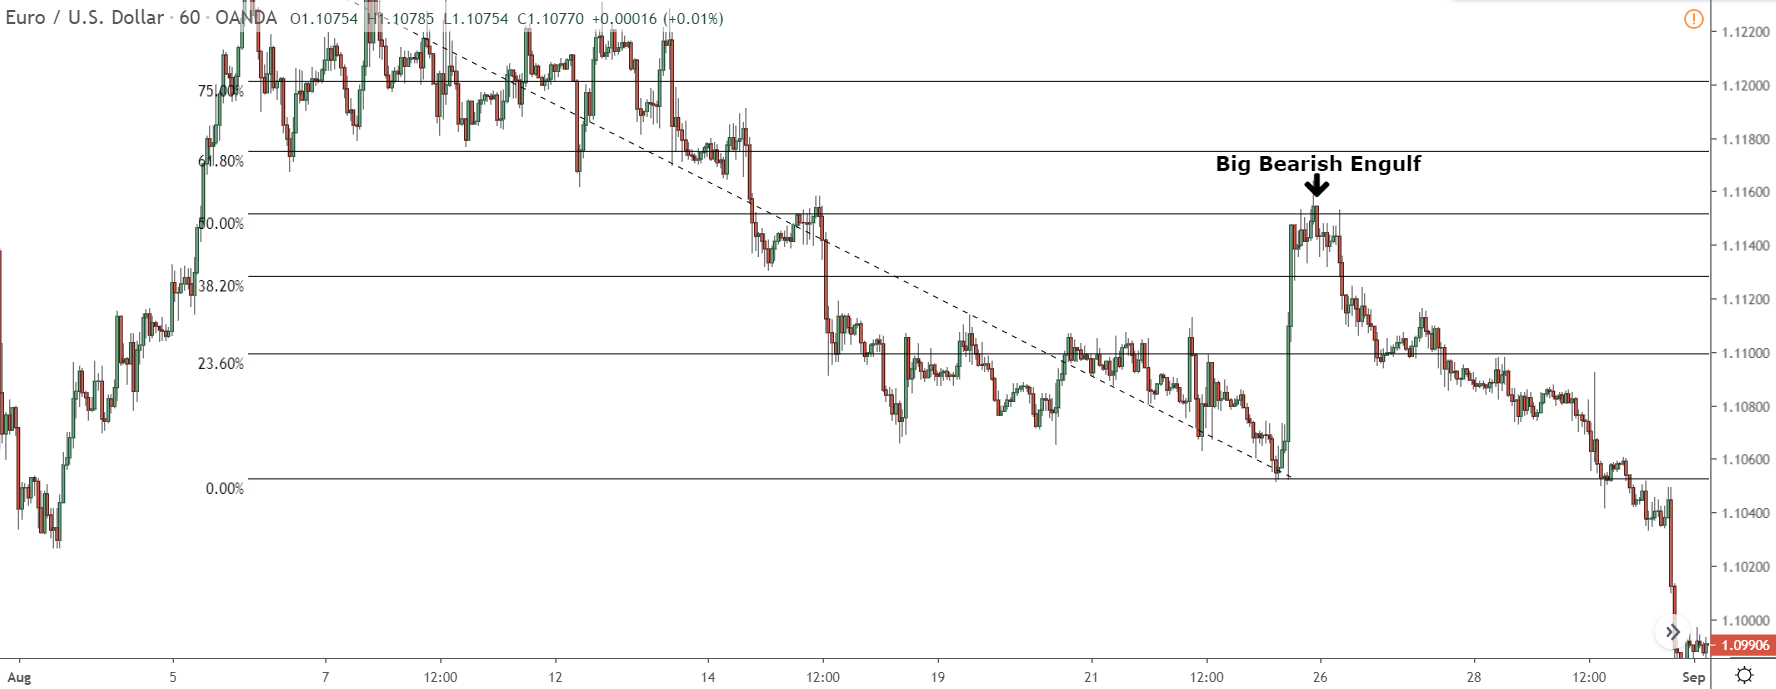
Price reverses, causing the retracement to end and the prior trend to continue.
Candlestick patterns – like pins and engulfs – are great signals to start trading at retracement levels. But, seeing a sudden spike or drop in price also works well. It’s always smart to check if these levels line up with other technical tools.
This can help confirm that the price is likely to flip direction.
Speaking of ‘confluence’…
Use Fib Retracements To Confirm Points Of Interest
Looking for “confluence” is a great way to figure out where the price of something will change direction. The Fibonacci tool (don’t worry about the fancy name, it’s just a helpful tool in trading) is super useful for this.
So, what does “finding confluence” mean?
Let’s break it down:
First, mark the technical levels or points you’re interested in on the chart (these are just the spots you think price has a high probability of reversing at). Then, place the Fibonacci tool on the most recent swing, or the latest big change in the price.
That’s exactly what I did in the image below:
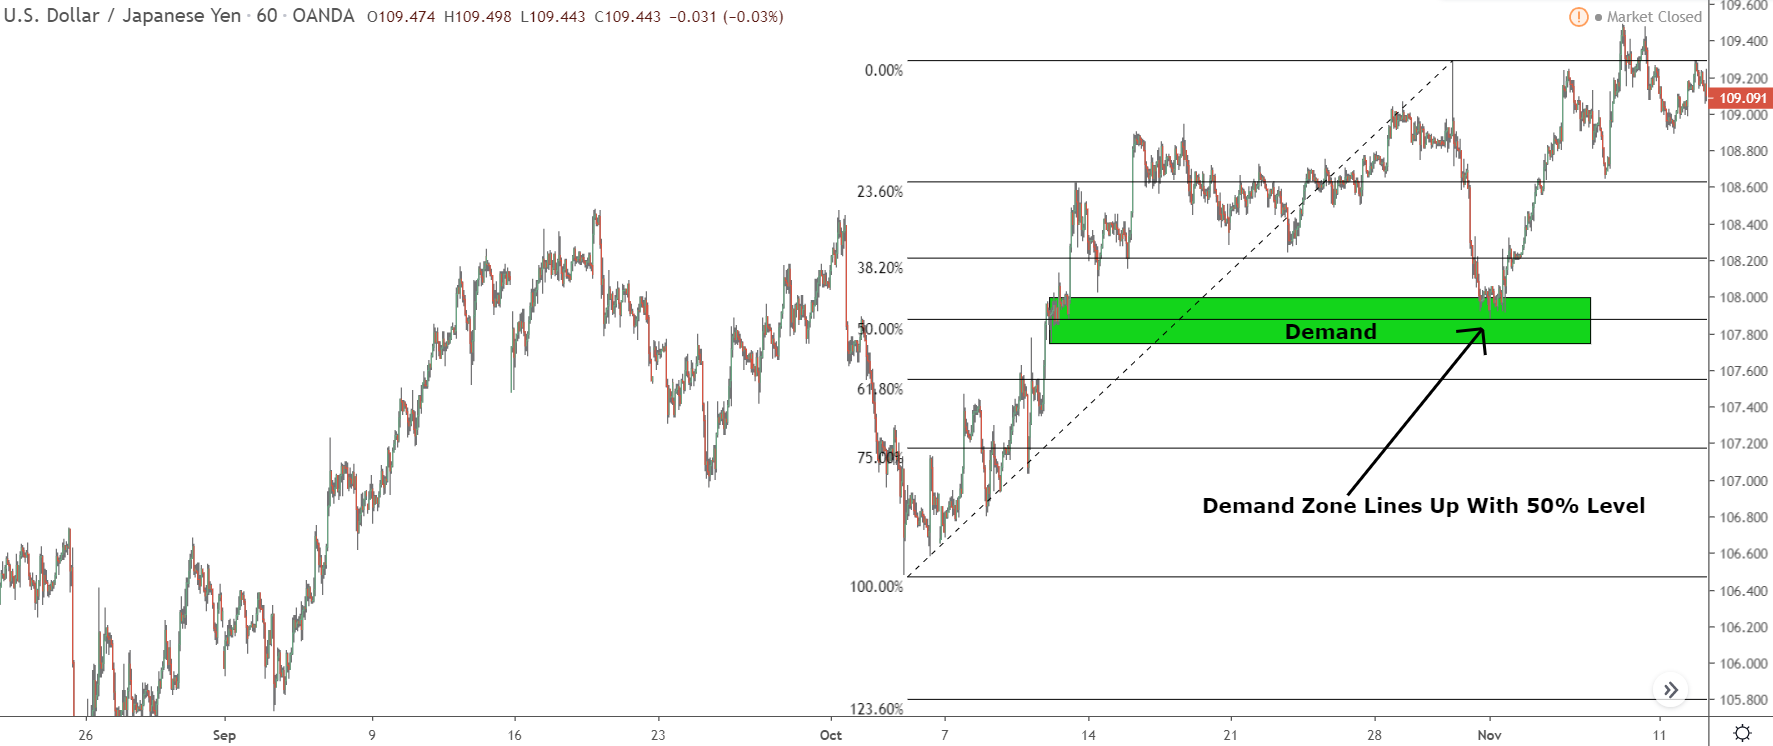
If a level, like the 50% one here, matches up with a specific point – like this demand zone – we say it has ‘confluence’ with it.
That’s just a fancy way of saying they line up together.
When they do, there’s a good chance price might reverse if it reaches this zone.
Here’s another thing: ‘Retracements’, or pullbacks in price, usually stop at a specific technical point. This could be a support or resistance level, or a supply and demand zone. Often, during the previous swing of price movement, a bunch of these levels or zones will have formed.
Using the retracement tool can help you figure out which of these technical points price is most likely to bounce from.
Use Fib Extentions To Predict Where Swings Will End
The main job of the Fibonacci tool is to map and predict where retracements in trends might terminate. That’s why it was made, and that’s how it works best.
But here’s a fun secret – a lot of traders don’t realize this tool can do more than just guess where retracements might end; it can also do the same for typical market swings.
Did you catch the level below the 100% mark in the last picture?
Have another look…
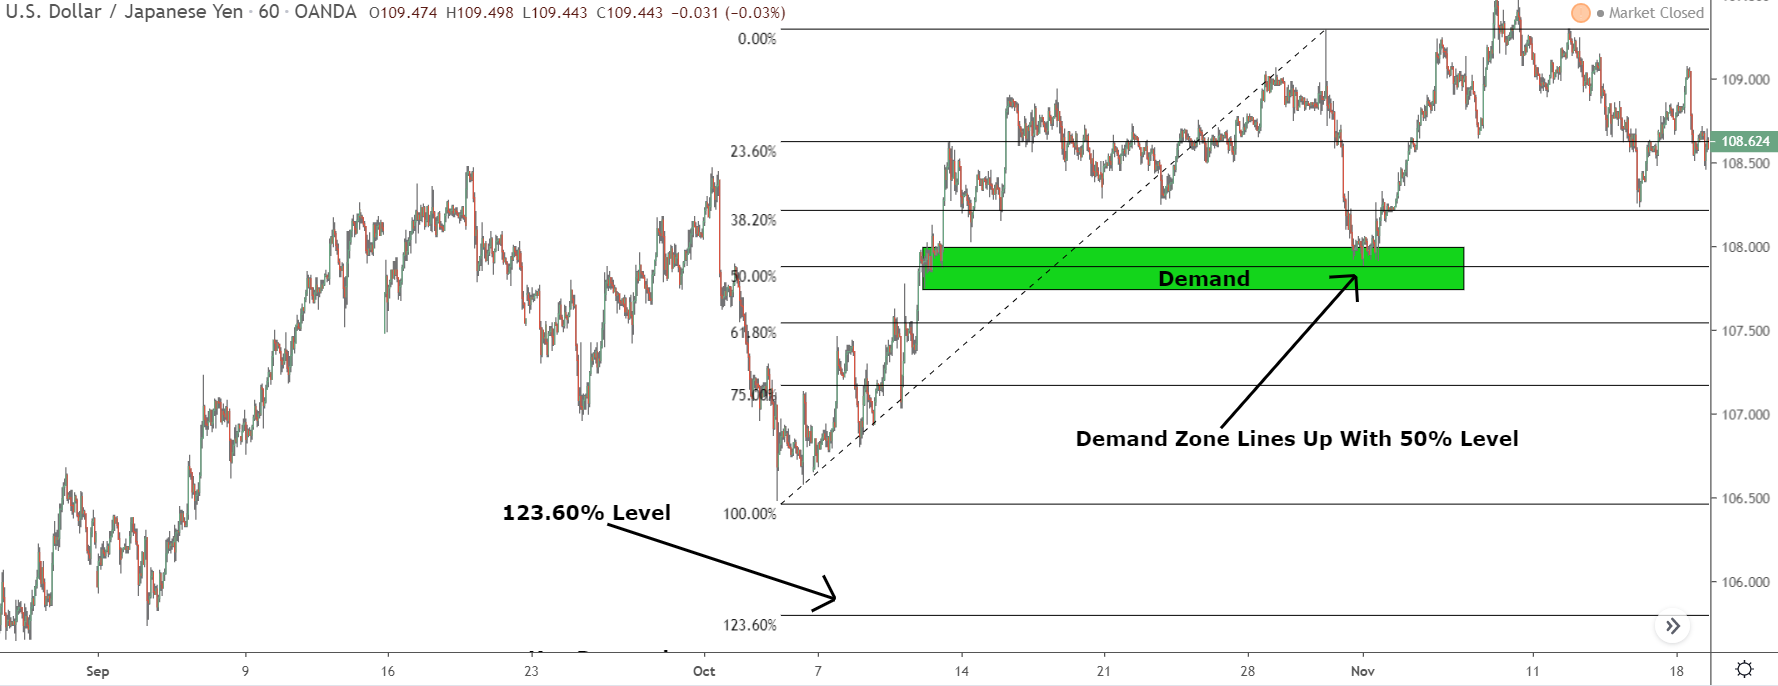
Below the 100% level, there’s the 123.60% level.
This is what’s known as a Fibonacci Extension.
What’s that?
Extensions are like ‘Fib’ levels that reach past the 100% mark.
They work the same way as retracement levels, but instead of showing how far a price can pull back, they’re used to predict how future price swings might roll out.
The extension levels still follow the same number pattern; like 23.60%, 38.20%, 50%, and so on… but they all have a ‘1’ in front of them – so 23.60% becomes 123.60% – because they show up after the full swing or past the 100% mark.
Extensions can be used in lots of cool ways, but they shine when it comes to understanding how future price swings might play out and where they might stop.
For instance, check out the image below…
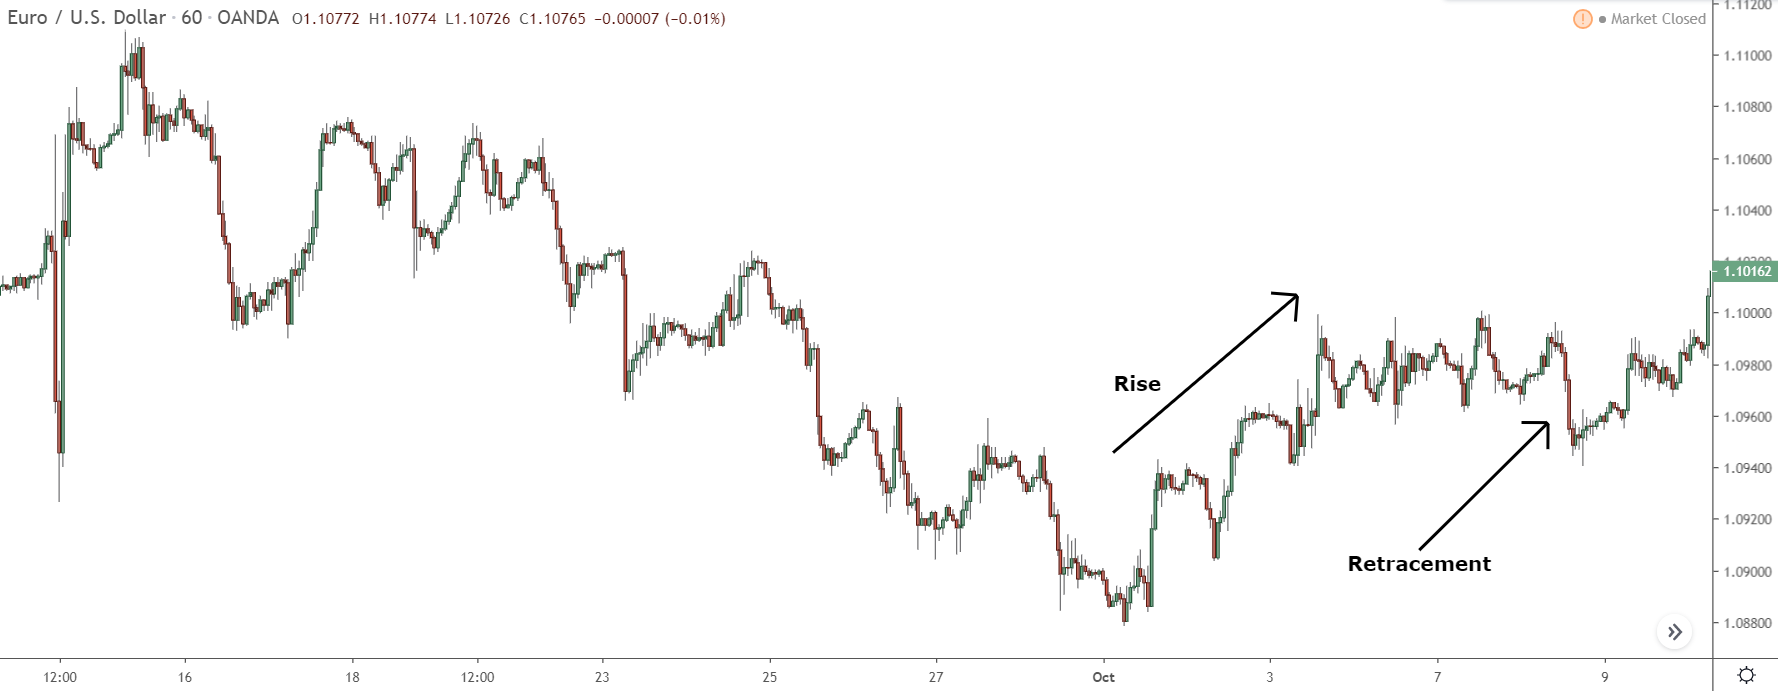
Price is rising again after a minor retracement. By applying the Fibonacci extensions, we can get a sense of how this new upswing might develop and where it may end.
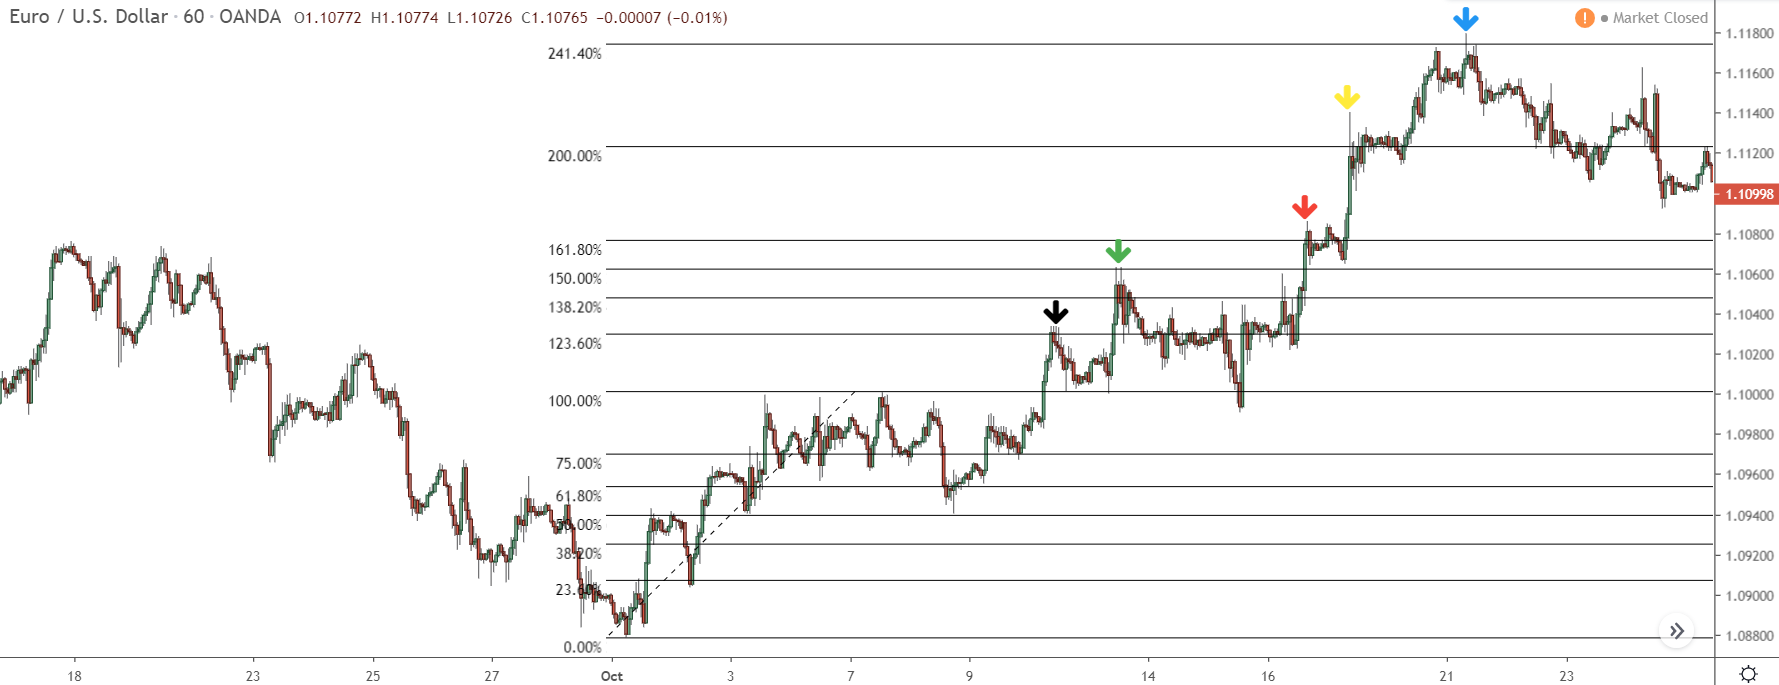
As you can see, the Fib extensions mapped out the new swing nicely.
The upswing that began after the retracement continued until it reached the 123.60% level, at which point a new retracement began (black arrow). Once that was over, price rose to the 150.00% level (green arrow), and another, much deeper retracement started.
Eventually, that also came to an end, and price began rising again.
This rise stalled first at the 161.80% level, then the 200% level before finally ending at the 241.00% level, where price reversed, and the entire upswing came to an end.
I haven’t got time today to fully detail how extensions work – they really need their own in-depth post to be explained correctly.
But I have got a couple of pointers just in case you want to use them…
1. Like retracement levels, extensions are always placed at the beginning and end of a swing, but the opposite way around. So rather than place the 0% level at the end of the swing, as you do with retracements, you instead place it at the beginning, with the 100% level taking its place.
2. By default, the fib tool doesn’t show the extensions. It’s not a well known or well-used technique, so the tool won’t show the levels when you place it on the chart. This means to use the levels, you have to enter their values yourself through the settings menu of the Fibonacci tool.
This isn’t difficult to do, but it does differ depending on your charting platform.
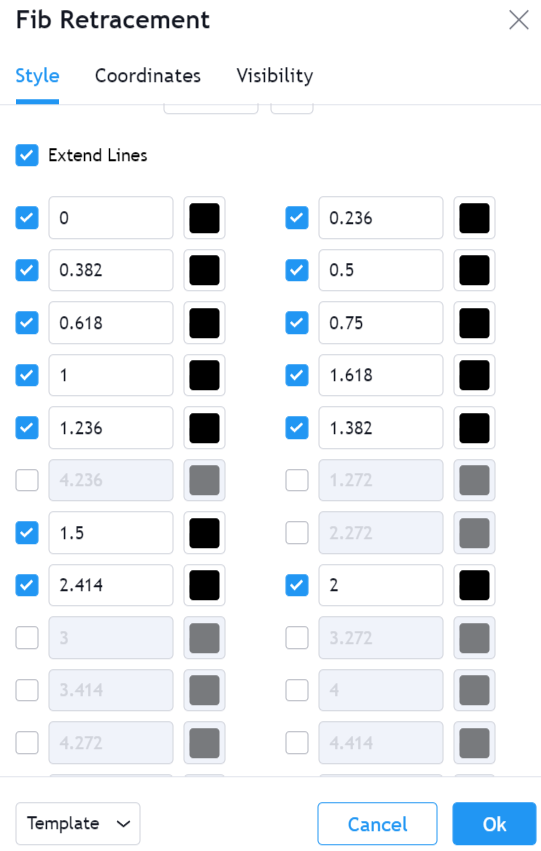
On Tradingview, just enter each number below 1 into a box.
Note: Right click one of the retracement levels and click ‘Settings’ to open up the menu below.
On MT4, open up the settings menu by right-clicking one of the retracement lines and selecting “Fibo Properties”.
When the menu opens, head over to the ‘Fibo Levels’ tab and click the ‘Add’ button.
Now, enter one of the levels in the level tab, and then put it corresponding percentage in the description box.
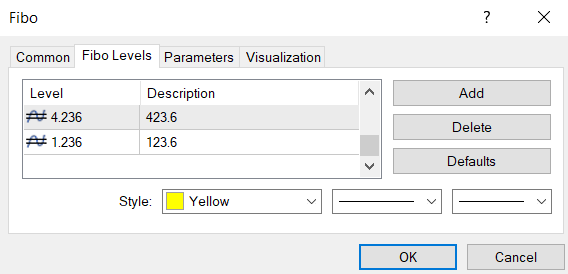
Repeat this until the following levels are entered.
- 1.236 – 123.6
- 1.382 – 138.2
- 1.5 – 150
- 1.618 – 161.8
- 2 – 200
- 2.414 – 241.4
And with that, the tool is ready to go.
Fibonacci FAQ: Your Top Questions Answered!
What is the best time frame to use Fibonacci retracement?
Fibonacci retracement can be used on any time frame or market, there is no ‘best’ timeframe. Day traders will find it most helpful on a 15-minute or hourly chart. Swing traders, on the other hand, will find the levels helpful on the Daily or weekly charts.
It’s all about finding what works best for you.
What is the strongest Fibonacci retracement?
While all Fibonacci levels can be considered strong, the 61.8% level is known to be the most powerful followed by the 50% level. The other levels have varying levels of strength that depend largley on the market conditions at that time which created the upswing.
Is Fibonacci good for day trading?
Absolutely!
Fibonacci retracements can be a real asset in a day trader’s toolkit. Whether you’re identifying potential reversal points or setting stop-loss and take-profit levels, the retracement tool can help you out.
Just remember: always use the levels in combination with other analysis tools.
What is a 50% Fibonacci retracement level?
The 50% Fibonacci retracement level is where price retraces half of its initial move. It’s not technically part of the Fibonacci sequence, but traders have adopted it because price seems to respect the 50% level quite often during retracements.
The Bottom Line
So, that’s the Fibonacci retracement tool for ya. It’s not the easiest tool to understand, at least not at first, but it’s definitely one of the most useful. And one all traders should consider adding to their arsenal of price action tools.
More posts on retracements will be available shortly.

Grab Your FREE E-Book:
5 Pro Rules For Trading Supply And Demand
- Master the core principles of supply & demand.
- Advanced techniques for trading SD zones.
- Exclusive new lessons/books/tools every week!
Sign Up Now To Download Your FREE Guide:
🛡️ Spam-Free Promise: No spam, ever. We'll only send you relevant updates and content. Unsubscribe at any time.