In today’s post, I’m going to show you 4 secrets to trading pin bars.
When traders hear pin bar secrets they usually think of things like making sure the wick sticks out from the surrounding price action, entering on the 50% retrace of the candle, or watching for the pin to form at a specific technical levels.
But while these are all well known secrets, there are others only a few people know about.
I’m going to show you 4 of these today, and how you can use them to find and take higher probability pin bar trades.
Lets get to it.
#1. The Multiple Meanings Behind Pin Bars
Have you ever seen a pin bar with a big wick and small body form at one or more technical levels but then fail to cause price to reverse?
Happens a lot, right?
And it’s funny, because it’s not supposed too…
Pin bars with big wicks that form at one or more technical levels are considered the best pins. They’re the ones that have the best chance of causing price to reverse. Seeing one fail is supposed to be rare, yet it happens almost all the time.
Many traders put these failed pins down to chance. Sometimes pins fail for no reason, which is true.
But there’s another reason why so many of these pins fail:
Because pin bars form for different reasons.
Almost all price action guru’s and books say pin bars form as a result of traders buying and selling. This is correct. But the reasons why traders buy and sell, and the traders behind that buying or selling, aren’t the same for every pin.
For example…
A bunch of bank traders could sell to take profits off a buy trade.
Doing that would cause price to fall and may result in a bearish pin bar forming. That pin, regardless of its wick size or what levels it’s formed at, has a low probability of causing a reversal because the banks still want price to keep rising.
Except for pins created by news events, the banks cause almost all other pin bars to form. And they do so through one of two actions:
Taking profits off trades.
Or, placing trades to make price reverse.
Most pins form from them taking profits, which is why so many, including the supposedly high probability ones, fail to cause reversals. The pins created by them placing trades, on the other hand, don’t form anywhere near as often, because the banks don’t need to get trades placed all the time.
So, how do you determine what’s caused a pin bar to form?
Figuring out why a pin has formed isn’t super difficult, but it does require some understanding of how the banks trade and make decisions.
I haven’t got time to explain how to tell if a pin has formed the banks placing trades – read my book for a full guide – but I can show you how to quickly figure out if it’s formed from them taking profits, so you can avoid most of the bad pins that come up.
Profit-taking pins form from the banks taking profits. So to find them, you need to understand when the banks are likely going to take profits off their trades.
This sounds difficult, but it’s actually really easy.
The banks take profits the same as we do: when their trade goes into a lot of profit. When one of their trades makes a sudden large profit, they take some off to either get more trades placed or to just secure a bit of the money for the future.
So to find if a pin has formed from profit-taking, you just look at the move that precedes it.
If the pin formed shortly after a sharp rise or decline, it’s probably formed from the banks taking profits. The sharp rise/decline would’ve drastically increased the amount of profit on their trades, so they would now want to take some off to secure it.
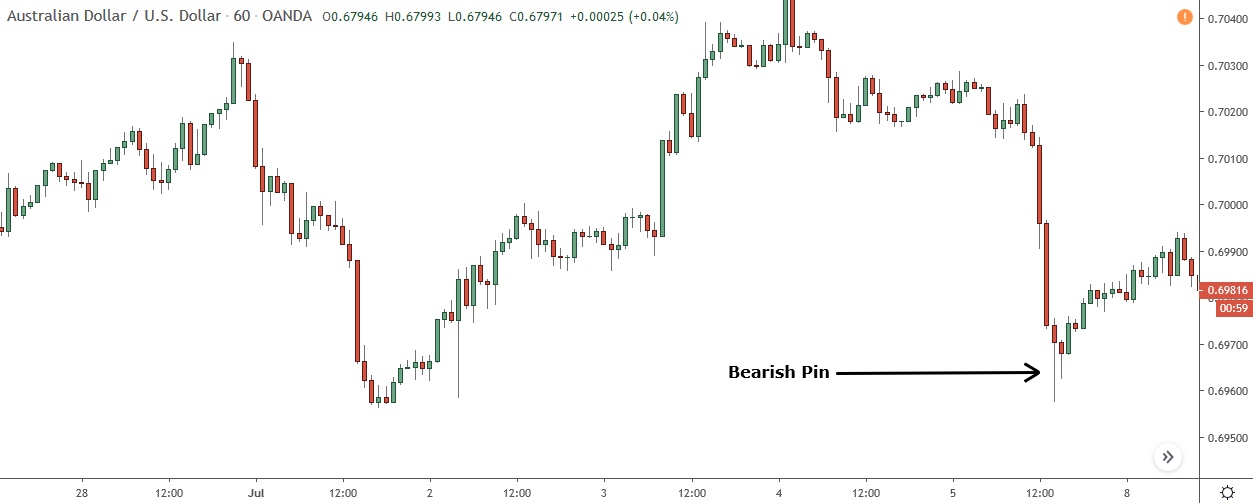
This bullish pin formed from the banks taking profits off sell trades.
How do I know?
Because it formed almost immediately after a sharp decline. The sharp rise pushed the bank’s trades into a lot more profit than they were at previously. Naturally, they decide to take off this newfound profit off. When they take profits, price rises, resulting in a bullish pin bar forming.
What happens later…
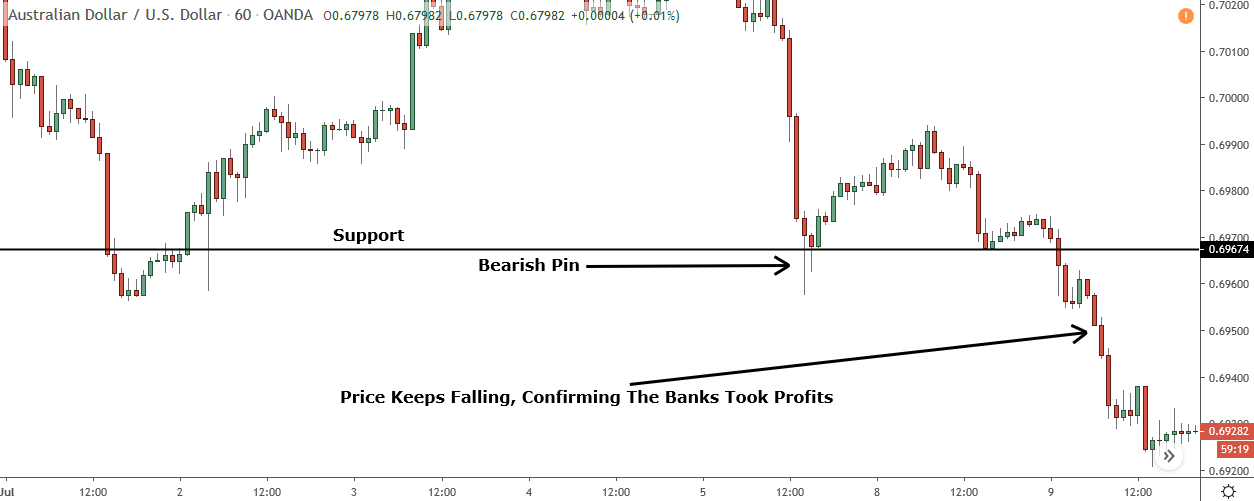
After a small retracement price falls again, confirming the bullish pin formed because the banks took profits off the sell trades they’d placed earlier on in the decline.
And that’s how you tell if a pin has formed from profit taking.
Not all pin bars that appear after sharp rises and declines form from the banks taking profits; some also form from the banks placing trades, though it’s much rarer. However, most of them do, so it’s best to assume by default it’s been created by profit taking rather than the banks placing trades.
#2. Small Pins Have A Low Probability Of Being Successful
Price action gurus always say there are 3 key features that determine if a pin bar has a high probability of causing a reversal: the wick, body and what technical levels it forms at.
For the most part, this is correct.
Pins with big wicks and small bodies that form at one or more technical levels do tend to result in higher probability trades, but only if they form for the right reason like I explained earlier – they don’t show a rejection of price either, which is what a lot of people mistakenly think.
However, I’d argue that another feature to take into account is the overall size of the pin bar… Not just the size of its wick or body, but its overall size from high to low.
The size of the pin is important because of how pin bars cause price to reverse.
Before every pin forms, it looks like this…


A large range candle, or trend candle as some people know it.
On the surface, these candles only show price has moved a large distance.
Behind the scenes, however, they actually show how many traders have bought or sold.
When traders see price quickly fall or rise, they rush into trades in the same direction, which is what creates these candles. Price rapidly falling or rising makes them think they’re about to miss out on a big move, so they jump into trades to not miss out.
So before a pin bar forms, lots of traders have placed trades in the direction of the large range candle, as it’s size made them think price would definitely continue moving in the same direction.
Now, what do you think would happen if price moved against these traders?
They’d close, right?
They’d be put at a loss, and many would close their trades.
And how do you close a trade?
By using the opposing order.
To close a sell trade, you must buy back what you sold.
To close a buy trade, you must sell what you bought.
Now if tons of orders are coming into the market from traders closing losing trades, what do you think that’s going do to the price?
It’s going to make it move in the opposite direction, isn’t it?
This is how every single pin bar in the market forms; from traders closing losing trades. They enter because they think price is certain to keep falling or rising due to the large range candle. The banks then place trades or take profits, pushing price against the traders and making them close.
Them closing causes price to move in the opposite direction, resulting in more traders closing and price moving further in the opposite direction, ultimately creating the pin bar and causing the reversal.
Make sense?
What this means is the overall size of the pin plays a large part in whether or not it’ll cause price to reverse, because think about it…
The larger the pin, the more traders who bought or sold during its formation.
If the pin formed as a result of a large decline, that means lots of traders entered short trades. That, in turn, means more people are going to close once price moves against them, making it more likely for price to continue moving in the same direction after the pin forms.
So, how do you know if a pin is small or not?
I can’t give you precise measurements for this, as every pair is different as is the volatility, but I’ve left an image below that should give you some idea of what I consider a small pin.
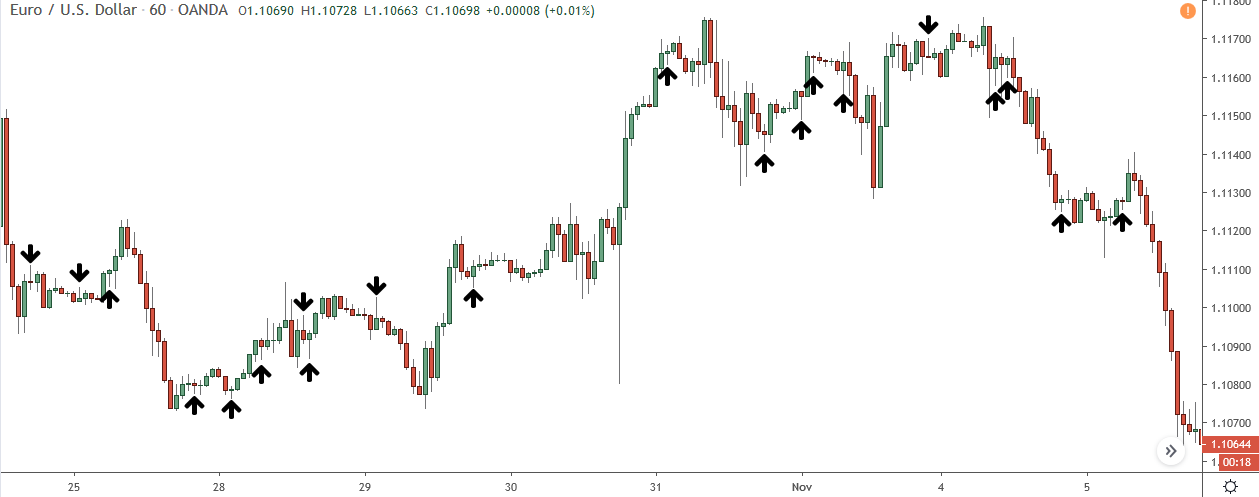
You’ll notice some of these pins have a wick much bigger than the body. Normally this would increase the probability it’s going to cause a reversal. However, since the overall pin is still small, it doesn’t make any difference, so don’t trade them.
3. Confluence Doesn’t Matter That Much
Confluence is a big concept in price action trading, being used as a way to confirm high probability trades and to find points where the price is likely to reverse.
Back in my early days of trading, I was a big proponent of confluence.
I thought it was a great way to increase the probability of trades, and the concept made a lot of sense; if multiple technical levels converge at one point, it makes sense price has a better chance of reversing at that level.
But then one day I stopped…
I stopped not because I wanted too, but because I realized confluence isn’t anywhere near as important people make it out to be.
The problem with confluence isn’t that it doesn’t work. It’s that the key feature that determines whether a pin or engulf will cause a reversal is what caused it to form in the first place.
Take this pin bar for example…
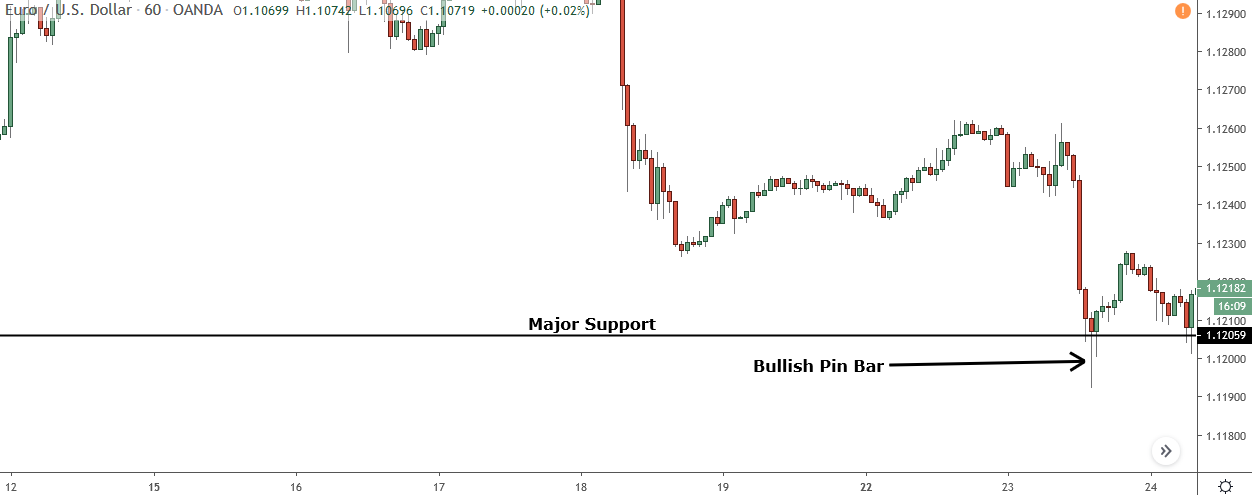
This pin is the typical high probability bullish pin bar. It has a big wick, a small body, and has formed at a major support level.
By anyone’s standards, this pin should cause price to reverse.
But watch what happens…
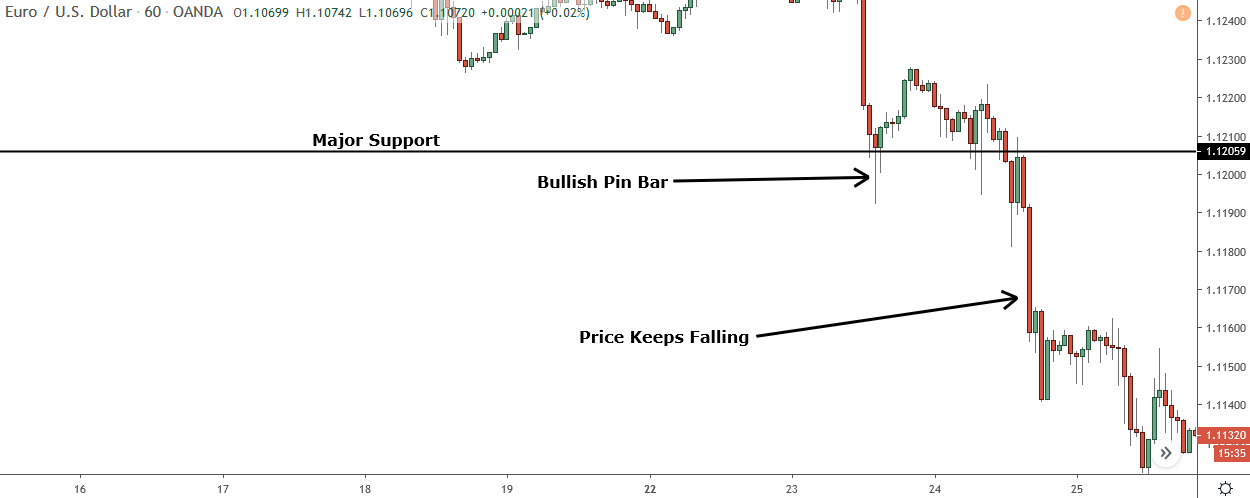
After a tiny retracement, price keeps falling.
Rather than cause a large reversal as it should, given it’s a high probability pin, it only caused a small retracement before price continued to fall.
So why did this pin with all it’s features and confluence fail to cause even a small reversal?
The answer is simple:
Because it’s didn’t form from the banks placing trades, but taking profits.
As I said earlier, pin bars don’t all form for the same reason.
Most, including the one above, form a result of the banks taking profits.
The problem with confluence is that it doesn’t really effect whether a pin bar will cause a reversal as what’s caused the pin to form.
If a pin forms from the banks taking profits, it doesn’t matter how much confluence it has with technical levels or how big it’s wick is. It won’t cause a reversal because the banks still want price to continue in the same direction once they’ve taken their profits off.
Does this mean confluences is useless then?
Not at all…
For finding points where price may reverse in the future, it’s still hugely important.
But for candlesticks patterns, like pin bars and engulfs, it’s not essential. What causes the pin/engulf to form overrules all other probability enhancers, whether that be wick size, overall candlestick size or what confluence the pattern has with other technical levels.
4. Pin Bars With Giant Wicks (Almost) Always Causes Reversals
The wick is one of the key features of a pin bar. Besides making it stand out, it’s the second biggest factor in whether a pin will cause a reversal – the first being what caused it to form, of course.
Most traders already know they should watch for pins with big wicks – it is one of the first things you learn about them after all. I’m not here to repeat that again. However, what I am here to say, is that pins with massive wicks, wicks that really stick out from the surrounding price action, almost always cause price to reverse.
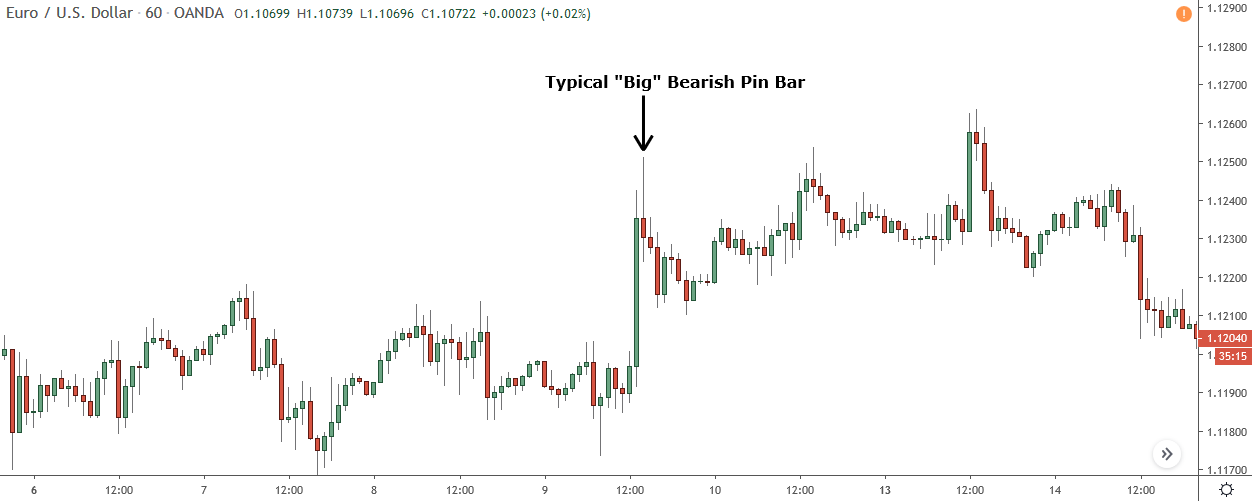
Here’s what your typical big pin bar wick looks like.
The wick on this pin is around 5 times the size of the body, which is beyond what most price action guru’s and books say is the ideal size for a big pin.
Now let’s look at what I mean by a giant wick…
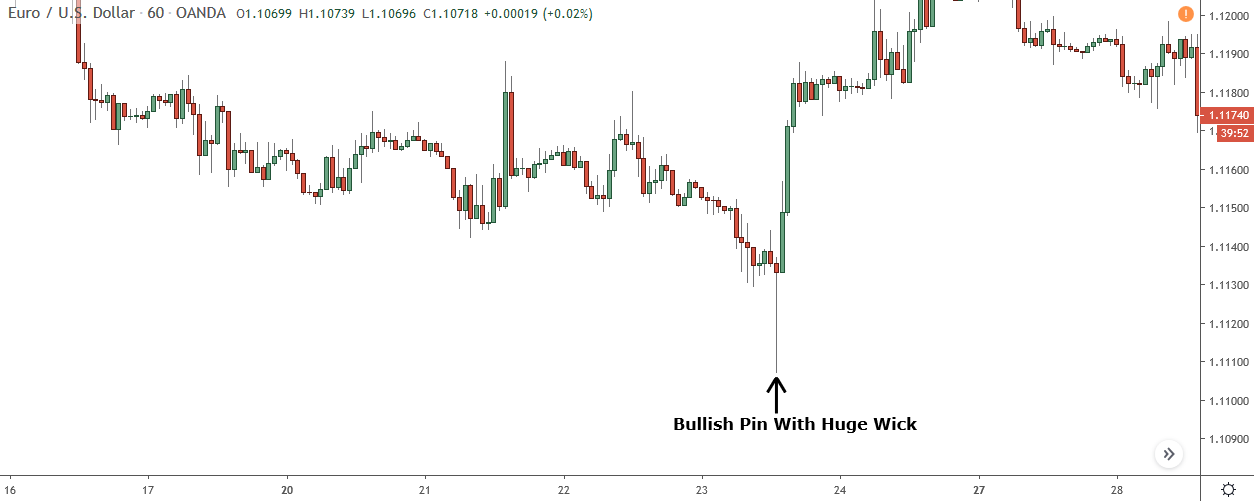
Much bigger, isn’t it?
Pin bars with wicks this big don’t form very often, but when they do appear, they almost always result in price reversing.
The reason why comes back to what I was saying earlier, about how pin bars form and cause price to reverse.
Pin bars cause reversals because the traders who bought or sold when it was forming – when it was a large range candle – close their trades at a loss. Them closing is what causes price to move in the opposite direction, and the banks taking profits or placing trades is what gives it that initial push.
The key take away from this is that it means the bigger the move that created the pin, the more likely it is to cause a reversal – assuming it’s formed from the banks placing trades.
So the reason pins with gigantic wicks like the one above usually always cause reversals is because the move that created it (a sharp decline in this case), was really big.
The big move lead lots of traders to believe price would keep falling, so they all jumped in and sold.
The banks then bought and price rose, causing the traders to close. Because so many people sold – due to the size of the decline – the rise created by them closing is much bigger than it is on smaller sized pins, which means the reversal had a higher probability of continuing.
Simple.
Pin bars with giant wicks don’t form every day, so they’re not going to replace your normal strategy. However, they are an excellent high probability setup, so you can use them alongside your core strategy to get into additional trades and boost profits.
Summary
I hope this post has taught you a few new things about how to trade pin bars.
These secrets might not be the easiest to understand and implement, but if you spend some time practising what I’ve shown, you should pick them up quicker and be able to use them more in your trading.