Today, I’m about to spill the beans on one of my most guarded secrets to trading pin bars.
And, heck no, before you even think it…
It ain’t that “wait for pins with big wicks at technical levels” hogwash every other wannabe price action guru spews – we’ve all been there, done that.
Instead, I’m gonna pull back the curtain on how to decipher why a pin bar has formed.
Yes, you heard it right, why!!
If you’ve skimmed through any of my other pin bar articles, you’ll know why a pin forms is the key factor in whether it’ll trigger a reversal… NOT if it has a large wick or pops up at the right technical level, like most gurus preach .
Those things still matter, but not as much.
You’ve got to get to the bottom of the why, and that’s what I’ll explain today.
I’ve whipped up a straightforward method of dissecting the build of a pin on a lower timeframe to gauge whether it’s sprouted for the right reasons, reasons that hint a reversal is on the cards.
With my method, you’ll be able to swiftly suss out why a pin bar has formed and make the call whether it’s worth trading or not. This will let you trade MORE pins with a high chance of triggering a reversal and DODGE those iffy pins that never work out.
So, strapped in and ready to get the lowdown on this method?
Here we go…
Why Do Good Pin Bars Fail To Cause Reversals?
When it’s time to dissect a pin bar, figuring out whether it’s got high odds of triggering a reversal, what’s the first thing you zero in on?
A whopping big wick, right?
You check if a pin is packing a big wick and whether it’s fallen into step with any technical cues.
But riddle me this…
How many times have you watched a pin form with a large wick at a support or resistance level or some other technical cue, only to see it bomb, despite having all the stars aligned in its favor?
… I reckon I can guess the answer.
You might brush it off as random…
Pins tank all the time; that’s the name of the trading game, isn’t it?
BUT, it’s not – these pins actually tank for a straightforward reason… and it’s got zilch to do with the wick or the technical points the pin was formed at.
Here’s the real deal:
“Good” pin bars crash and burn because they form FOR THE WRONG REASON.
Allow me to break it down…
Pin bars form due to the banks buying and selling.
In most cases, it’s down to them placing trades or banking profits, but some also form when they close trades… but these are few and far between. The banks place trades or pocket profits, and voila, price jogs in the opposite direction, birthing a pin bar.
Make sense?
Now, occasionally, these pins give rise to big reversals…
Case in point:
Pin bars that form due to the banks placing trades naturally kickstart hefty reversals, as you’d expect – if the banks enter massive buy trades, they obviously want price to climb so they can rake in a profit; why else would they buy?
These pins aren’t the troublemakers… they’re the ones we’re on the hunt for and want to trade.
The REAL gremlins are profit-taking pins – pins created when banks take profits.
These are the most common type of pin bar – I’d wager they make up at least 80% of the pins you see. They’re born, as you can guess, when banks bank profits from their trades… and this, my friend, is a MASSIVE issue.
Why, you ask?
Well, if you’re taking profits, what do you expect price to do afterward; flip or keep moving in the same direction?
You’re rooting for the price to KEEP MOVING IN THE SAME DIRECTION.
Because then, you can bank even more profit from your trade – and who doesn’t want to pocket more profit?
So, if a pin bar forms when banks due to the banks taking profits, does it have high odds of triggering a reversal?
NO, it doesn’t!!
And since profit-taking pins are the most common type, do you reckon most traders are dealing with good pin bars or bad pin bars? They’re dealing with BAD PINS. If your pin bar trading hasn’t been a roaring success up to this point, it’s probably not because you were messing up…
It’s because you were dealing with profit-taking pin bars: pins that NEVER had a fighting chance of success in the first place.
If you’re really serious about upping your pin bar trading game, you MUST learn how to determine why they formed, from the banks:
- Taking profits,
- Placing trades,
- Closing trades.
The million-dollar question now, of course, is how do you go about that?
And here’s the golden ticket…
Why The Construction Of The Pin Matters
Flipped through my book: Pin Bars Revealed?
In the book, I dig into the nuts and bolts of deciphering why a pin bar has formed.
By studying where a pin forms and pondering what sort of bank action sparked its creation, you can usually pinpoint, with a high degree of accuracy, the rationale behind its formation, and decide if it’s a trade worth taking.
Hold your horses though – this technique is no piece of cake to pull off.
It demands a deep-seated understanding how the banks operate – not something you’ll master in a jiffy, even with my plethora of books and lessons at your disposal.
But fear not!
I’ve cooked up a much simpler way to unravel why a pin has formed…
The primo way to swiftly determine why a pin bar has formed… Scrutinize how the pin is pieced together ON A LOWER TIMEFRAME.
Remember: What do lower timeframes reveal?
A more intricate snapshot of price information, right?
We’re served more time intervals, giving us the chance to delve deeper into how price moves and candlesticks are constructed on a higher timeframe.
In the context of pin bars, this means can witness firsthand how they form… how the pin evolved.
Did the pin take form owing to a sharp move, or was it a cluster of tiny candles?
This insight allows us to gauge the momentum (force) that swept into the market, making it a cinch to tell whether the pin sprouted from the banks placing trades, closing trades, or pocketing profits.
Case in point…
If a pin sprung from the banks placing trades, we should spot robust momentum on the lower timeframes.
So, if a bullish pin on the 1-hour timeframe sprouts from massive candles on the 15-minute, this pattern likely sprang from the banks placing buy trades – their hefty positions would kick-start a steep climb, which would show as giant candles on the 15-minute timeframe.
Conversely…
If a pin formed due to profit-taking or the banks wrapping up trades – both of which signal low odds that price will flip – we should spot low momentum (small candlesticks) on the 15-minute timeframe.
Let’s take a real-world example for a spin…
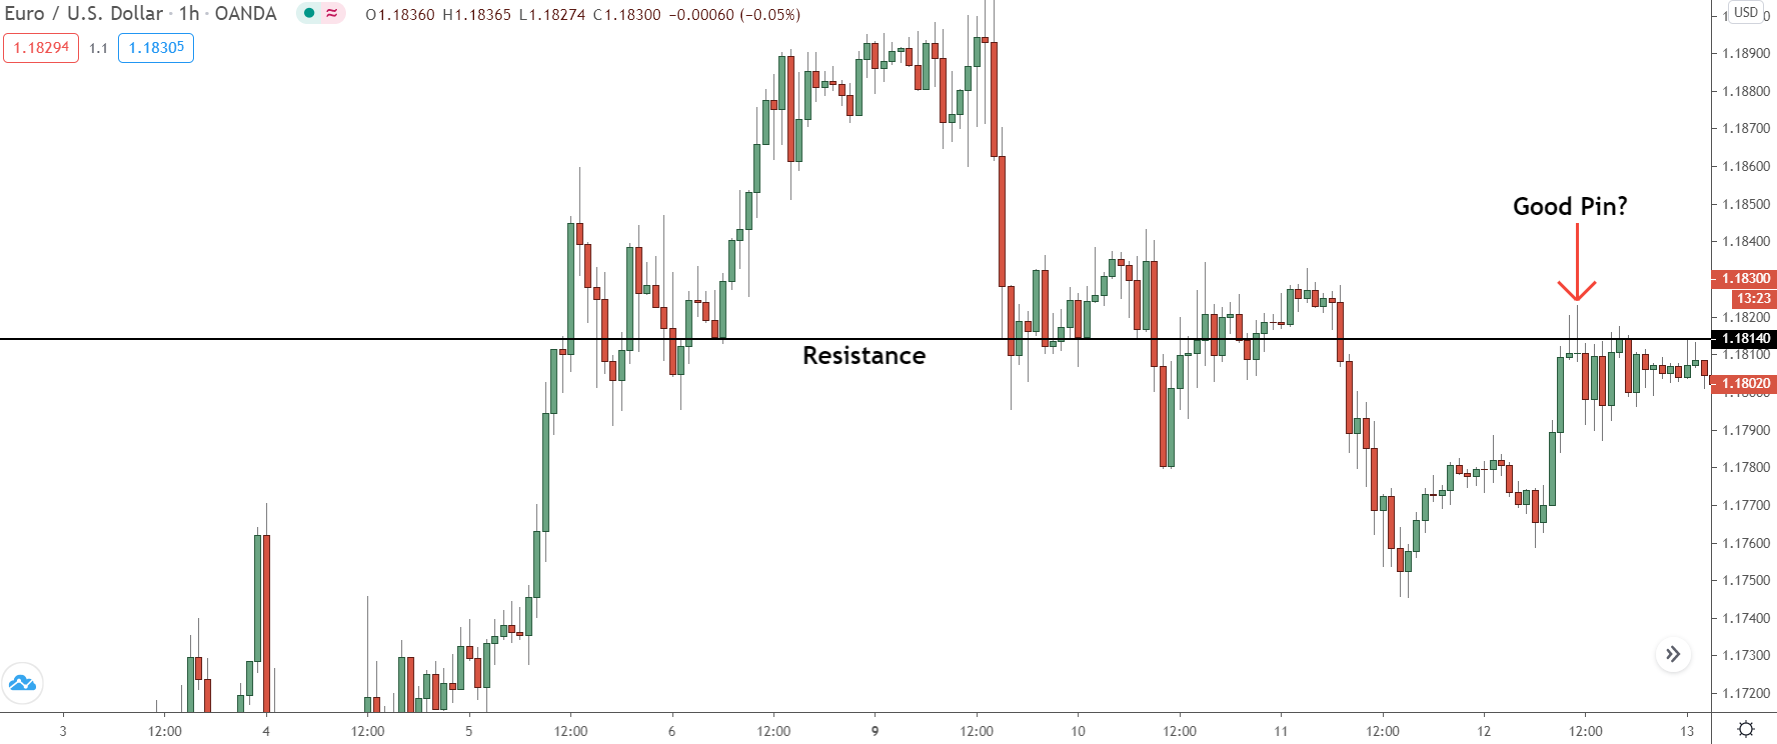
Here’s a bearish pin/doji that popped up on Eur/Usd a while ago – FYI, I treat dojis as pins.
From the get-go, this pattern looks like the ideal pin – a mammoth wick, tiny body, formed at a sturdy support level – it even gets a nod from a fib level.
This bearish pin checks all the right boxes of being a stellar trade, but how does it fare on the lower timeframes?
YIKES – not quite as peachy now, is it?
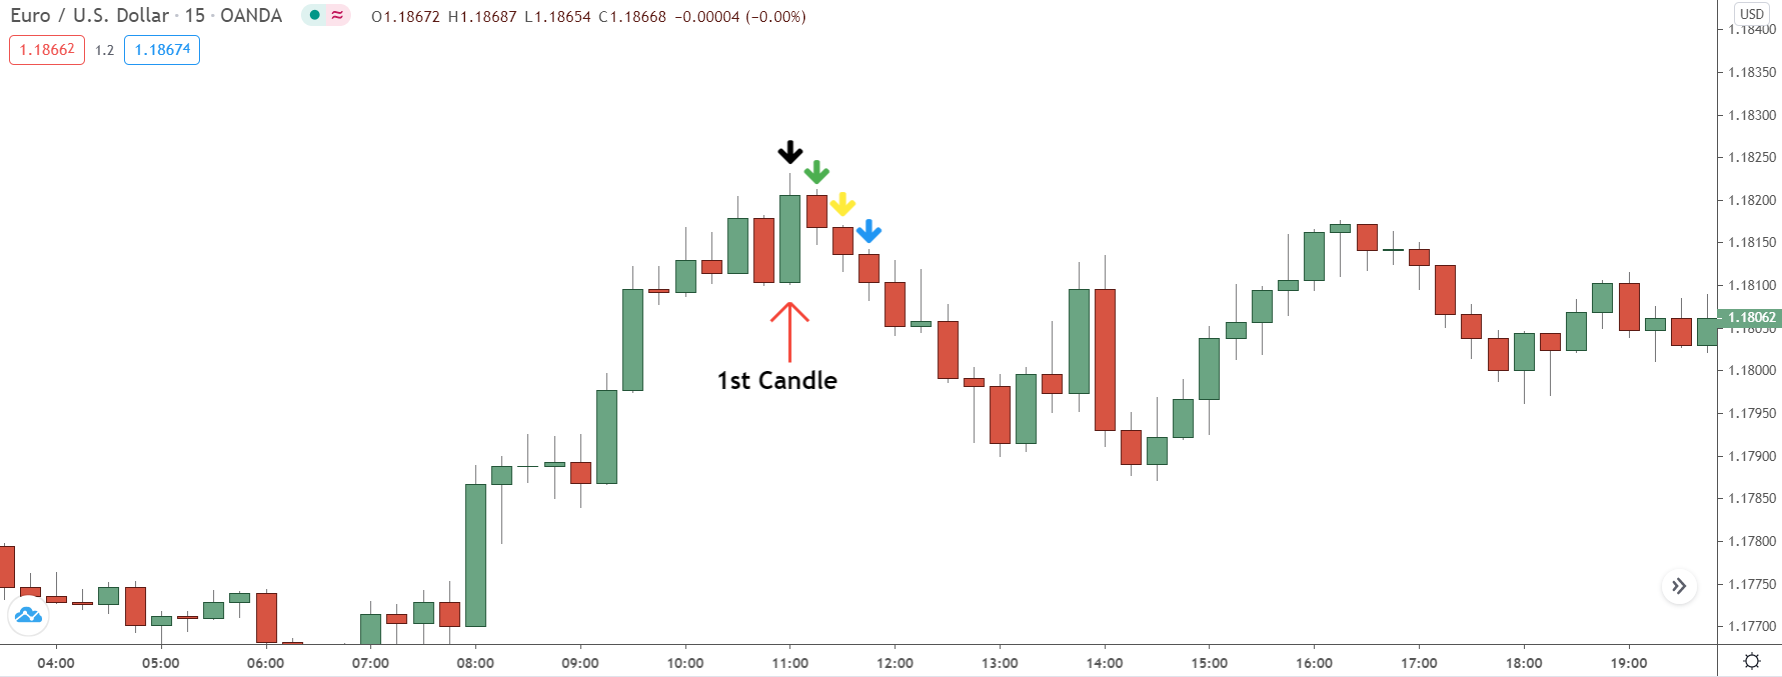
On the 15-minute, we see this pin is the offspring of 4 small candles.
The first is a bull candle, and in this case, a hefty one.
The wick was born from price slicing into this – creating the illusion that the pin was a solid signal. Candle 2 is the first bear candle, but it’s dwarfed by the bull candle – not a promising sign.
Remember: small candles scream low momentum.
If the banks place trades to flip price, that’ll flash as high momentum, i.e., giant candles, akin to engulfs and outside bars.
Candle 3 is also on the small side, though slightly beefier than candle 2.
More evidence of low momentum.
Sure, price is taking a nosedive, but it’s doing so with small candles that whisper low momentum – a sign the pin didn’t form from the banks placing trades, but rather from taking profits or closing trades.
The last kid on the block – candle 4 – is another modest bear candle that nudges the price to the open of the initial bull candle. This makes the pin close equally – a feature that ironically makes it appear even more tempting.
Can you see the point I’m driving at?
Why this pin had a slim chance of hitting the mark, even though it looked like a champ on the 1-hour?
At first, this pin looked like a knockout!
The pattern ticked all the right boxes – a substantial wick, small body; it touched multiple technical levels with harmony… a top-notch pin in anyone’s book!
But, when we scratched beneath the surface…
We discovered it was far from a stellar pin.
While it boasted a large wick on the 1-hour, the 15-minute revealed the wick was born out of small bear candlesticks – a telltale sign of scant momentum behind the move.
No momentum = no game.
So, this clues us in the pin probably formed from the banks pocketing profits or wrapping up trades… NOT placing trades to flip the price, which is what we’re on the hunt for.
What Good Pin Bars Look Like
Alright, so now you’re clued in on how low probability pins form – courtesy of pint-sized candlesticks that scream low momentum – let me serve up a few samples of high probability pins…
Then you can go on a treasure hunt yourself.
When it comes to high probability pins, the golden rule etched in your mind should be:
One humongous candle has to form in the direction of the reversal.
- For bullish pins, watch for at least one large bear candle on the lower timeframe.
- For bearish pins, watch for a significant bull candle on the lower timeframe.
A giant candle, especially an engulfing one, signals high momentum (read: force) backing the move. That’s our cue that the banks likely crafted the pin by placing trades. And why on earth would they do that? Because they want price to reverse and zip in the opposite direction!
So, if we spot a mammoth candle, we know the pin stands a high chance of sparking a sizable reversal.
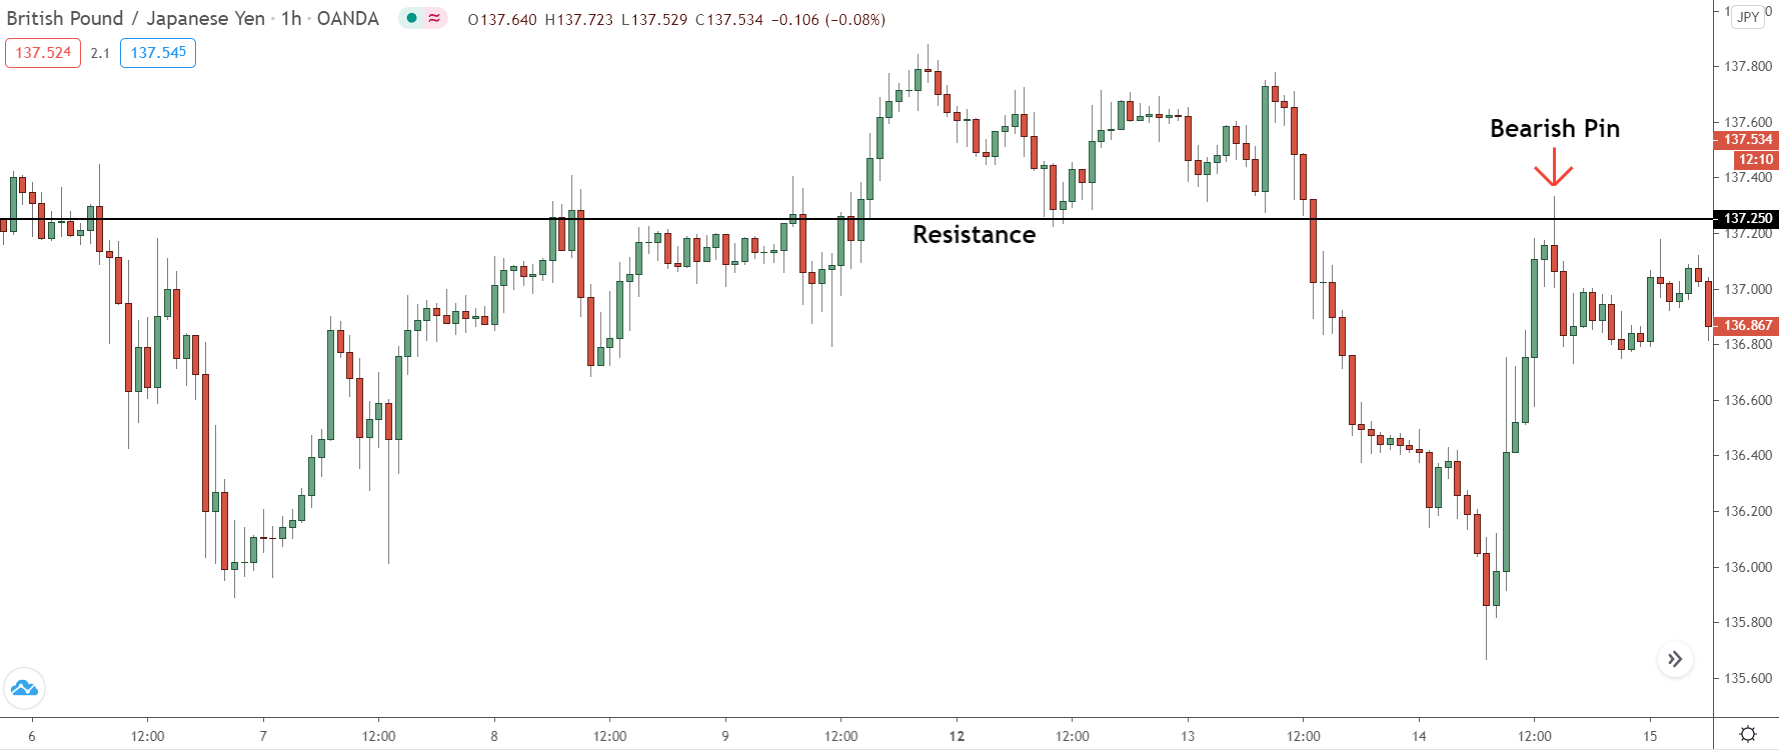
Check out this sweet-looking bearish pin bar that popped up on the 1-hour timeframe.
Let’s shimmy down to the 15-minute timeframe – don’t sweat, I’ll dish out a list of the different timeframes to use in a sec – and examine the architecture of this pin, see if it holds a promising chance of triggering a reversal or not.
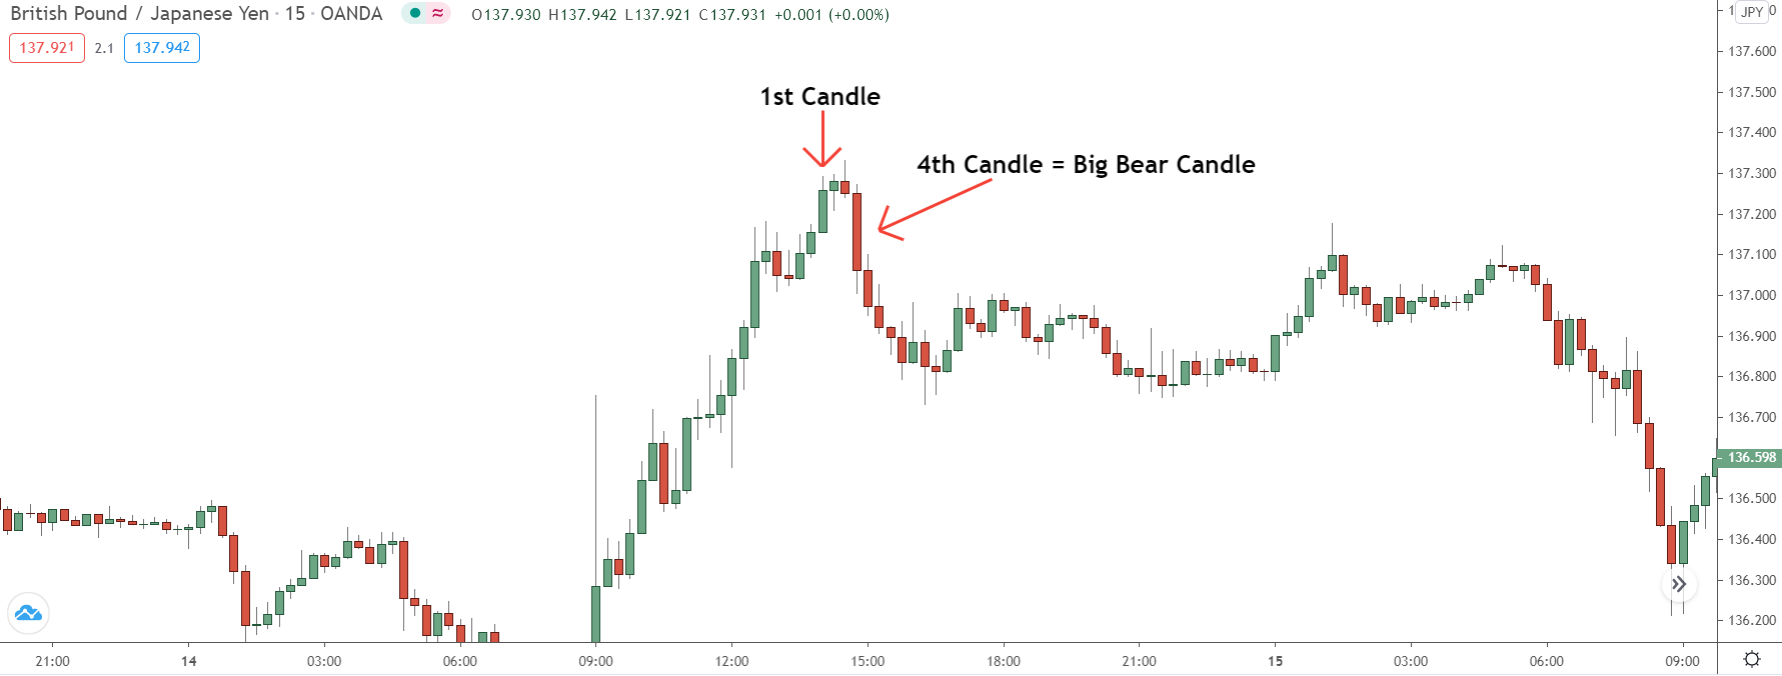
Right off the bat, what meets the eye… a colossal bear candlestick!
The pattern was stitched together when the price climbed (candle 1 – the inaugural candle always marks the start of the hour), ascended on candle 2 before commencing its descent (candle 3).
We then saw a giant bear candlestick form (candle 4) before price reversed.
With candle 4 bulking up so much, we know the banks likely sculpted this pin by placing sell trades… the hulking candle is a telltale sign that a hefty momentum was fuelling the move – a hallmark signal the banks executed sizable sell trades.
So we can hop on the trade, armed with the assurance of it being a high probability pin.
BTW – you can also deploy this method to scrutinize pins on other timeframes…
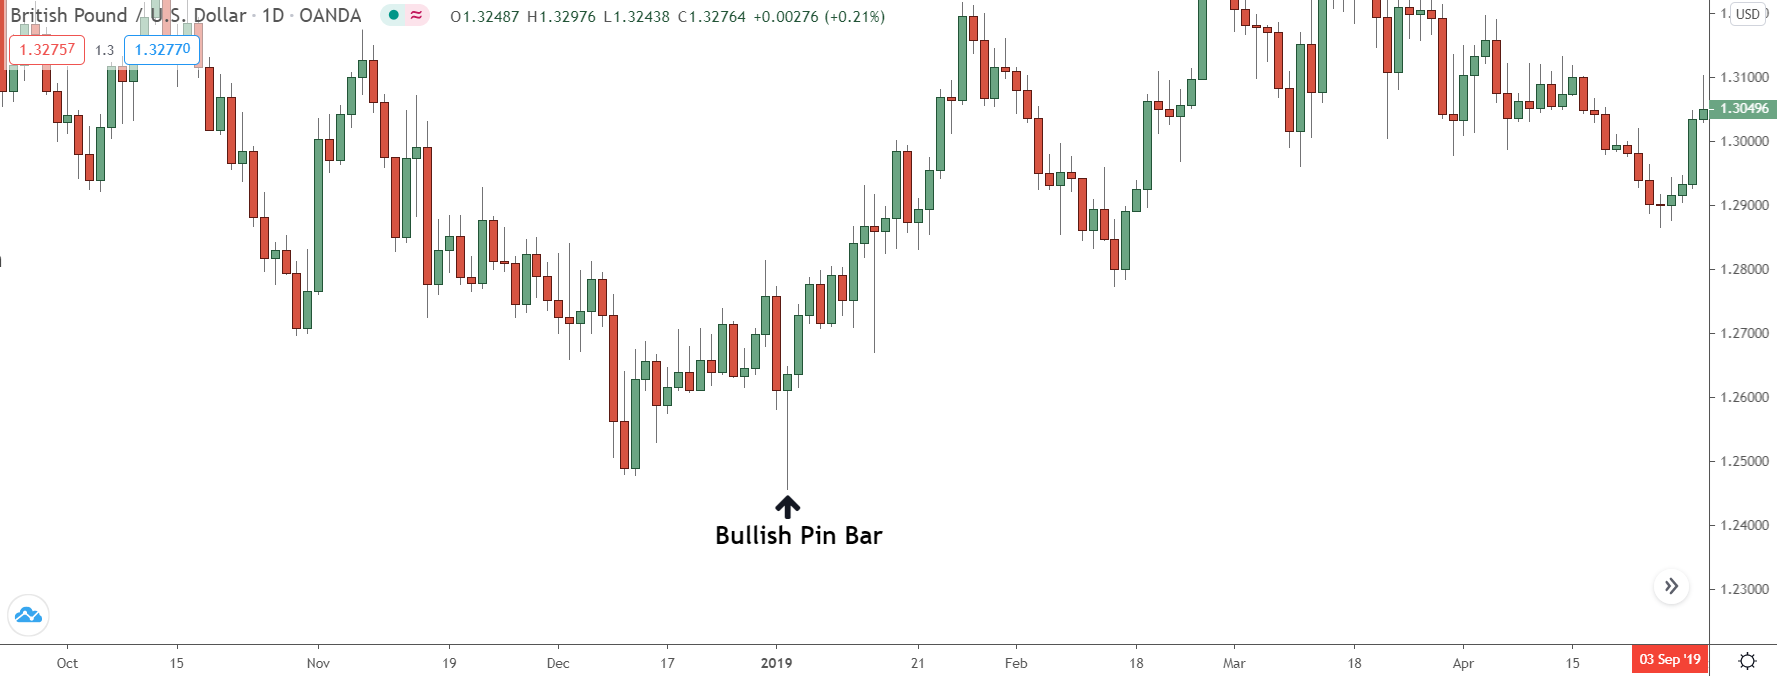
Here’s another pin, this time on the daily chart of GBP/USD.
As you can see, this pin bar checks all the boxes of being a top-notch pin.
The million-dollar question is: how is it constructed on the lower timeframes?
Let’s unravel this mystery by shifting our gaze to the 4-hour timeframe.
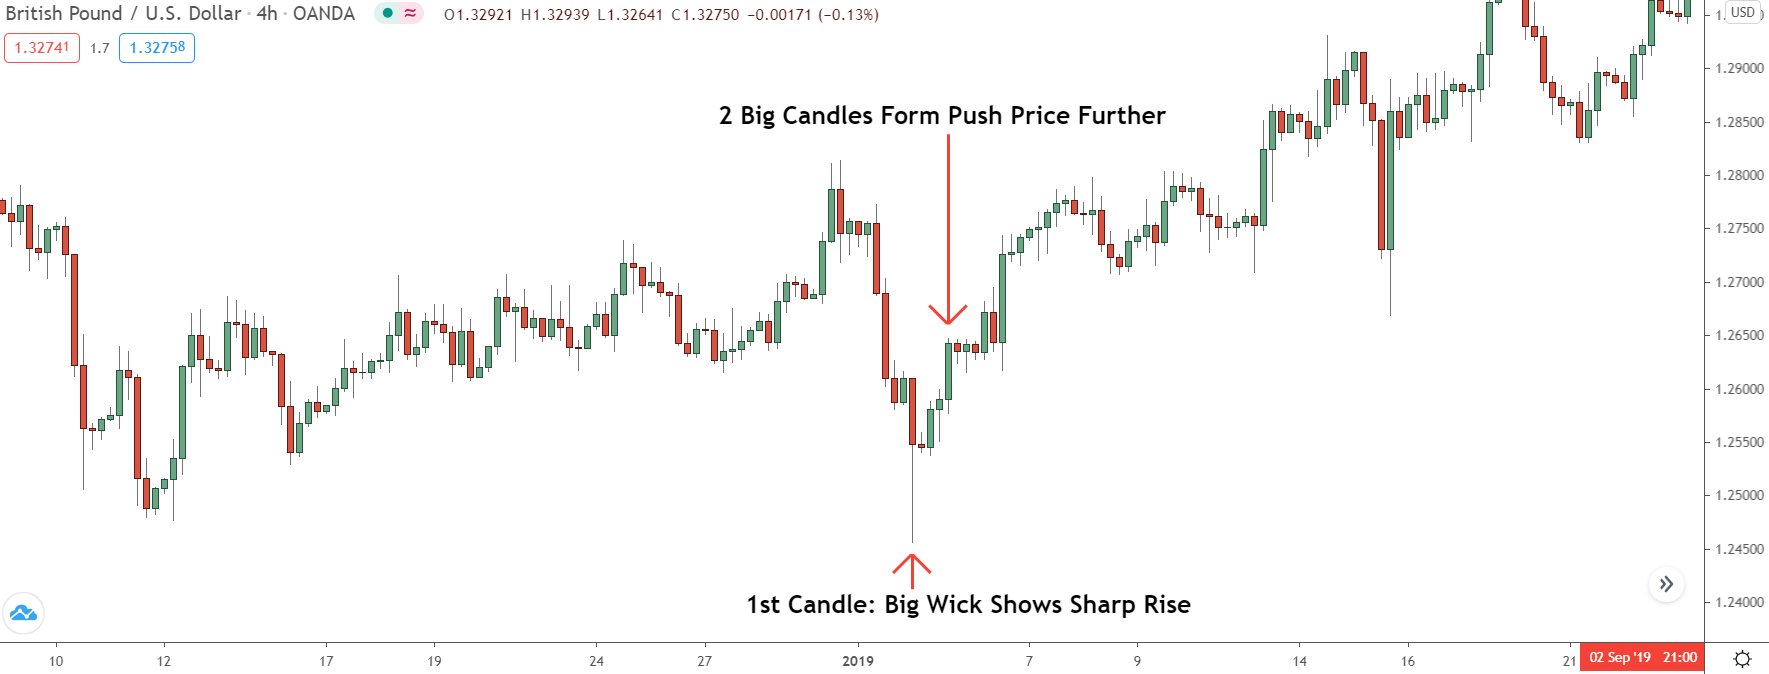
Here, we can spot the pin taking shape from a sudden sharp surge – what’s the takeaway?
The sharp rise tells us hefty momentum was propelling the move, meaning: the pin likely formed from the banks placing buy trades, making a reversal a likely scenario.
And, as we can see…
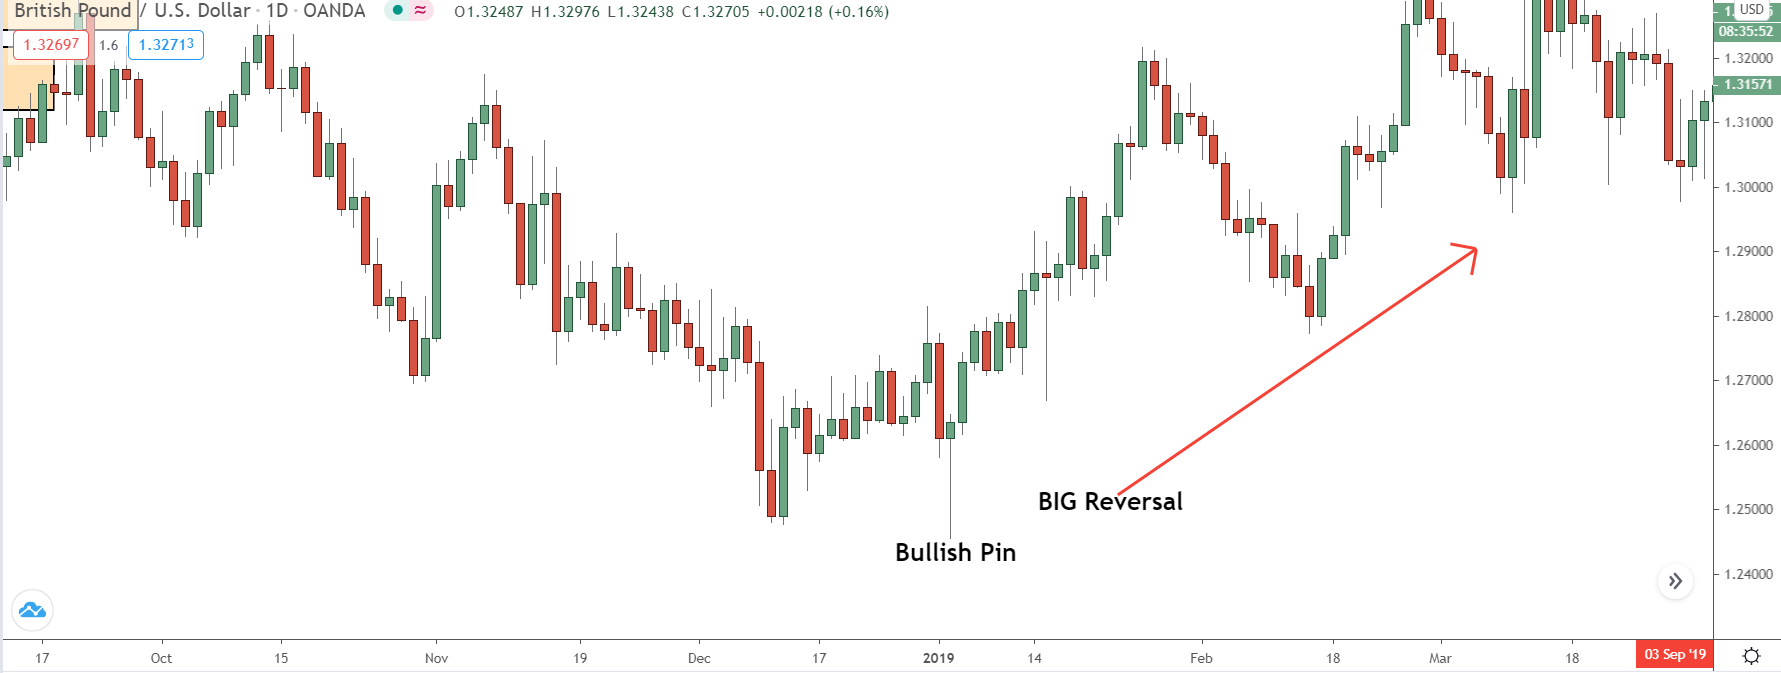
Shortly after the pin formed, price surged higher and reversed – proof the bearish pin took shape from the banks dumping sizable buy trades into the market.
Pretty neat, right?
If you’re gonna give this method of analyzing pins a whirl, remember to check the following timeframes:
Lower Timeframes:
- 5 Minute Pin Bar – Check 1 Minute Timeframe
- 15 Minute Pin Bar – Check 5 Minute Timeframe –
- 30 Minute Pin Bar – Check 5 Minute Timeframe – could be multiple big candles here.
Higher Timeframes:
- 1 Hour Pin Bar – Check 15 Minute Timeframe
- 4 Hour Pin Bar – Check 1 Hour Timeframe
- Daily Pin Bar – Check 4 Hour Timeframe
- Weekly Pin Bar – Check Daily Timeframe
Also, don’t forget to take a gander at the formation of the pin from the start of the period – say, that hour for 1-hour pins – to the dawn of the next candle.
For example:
If you’re dissecting a 1-hour pin… analyze the four 15-minute candles that make up its composition, kicking off with the candle at the birth of the hour right through to the candle before the next hour commences. That’s your golden ticket to understanding why the pin formed.
Key Points To Remember!
Before you scuttle off and start dabbling with this method yourself, here’s a few key tidbits to remember…
1) Perfect Pins Can Still Fail (And Will)
I get it, it’s a no-brainer for most, but the method I’ve laid out today isn’t a magic wand: Even if a pin ticks all the right boxes and is crafted to perfection, sometimes it will still trip up.
Regrettably, that’s just the way the cookie crumbles in trading.
We can’t nail it right every single time; it’s a pipe dream!
All we can do is give it our best shot to amp up the odds of our signals – pin bars, in this case – hitting pay dirt. No hocus-pocus tricks or techniques will magically enable you to spot the crème de la crème of pins and never bite the dust again.
Today’s method will lend a hand, but continue to scout for pins from technical points – S & D, S & R, fib retracements, and so on.
The more aces a pin bar has up its sleeve, the higher the chances of it resulting in a winning reversal.
Spotting a pin with a tidy formation from a hefty candle on a lower time is a great signal in its own right, but it doesn’t quite cut the mustard for a trade entry. Other elements must combine with the pin to turn it into a valid opportunity.
Here’s a quick roll call of some of the top confluence factors I keep my eyes peeled for…
- Support and resistance levels.
- Supply and demand zones.
- Big round numbers – prices ending in 00,000, or 0000.
- Fibonacci retracements.
2) Forget Pin Bar Analysis at S&D Zones: It’s Not Necessary!
Analysing the architecture of a pin should be the norm FOR ALL PINS, whether they form at support and resistance levels, fib retracements, or any other technical point worth its salt. However, there’s one exception to this…
Supply & Demand Zones
Why give these pins a pass, you ask?
Well, supply and demand zones stem from the banks buying or selling at a distinct point – the zone.
So… why break a sweat analysing the pin?
It’s a wild goose chase!
We’re already clued in that whatever pattern takes shape inside the zone is the handiwork of the banks buying or selling to pocket profits or place trades – or close trades in rare instances.
There’s no need to scrutinise the formation of a pin – it’s not the main event! The zone itself reveals what the banks are planning based on why it formed – for instance, RBR/DBD zones form due to profit-taking, so any pin bar that pops up inside more than likely sprouted from profit-taking… no need to double-check.
Supply and demand zones are the lone exceptions to this, however…
For every other level or technical point: Do give a once-over to how the pin developed on a lower timeframe before trading.
Summary
Unlocking why a pin bar has popped up is hands down the most crucial part of trading ’em. And now, with my trusty method, you’ve got a clear-cut strategy to swiftly and easily figure out what’s behind their grand entrance.
Give this a whirl on some old pins, get a grip on how the method ticks.
Don’t forget this nugget: Keep your eyes peeled for large candlestick.
Big candles translate to potent momentum, and that screams ‘banks placing trades.’ If a pin has formed from a big candle on a lower timeframe, odds are, it’s ’cause the banks are setting their trades. Double-check that with a couple more points of confluence – S & R, for instance – and you’re likely looking at a stellar trade in the making.
Thanks a lot Liam, good job !
Thank you 🙂
Merci beaucoup pour cette méthode mon ami.🤩👍
Hi Liam,
Your method makes sense and is very good, however you would gain more credit if you were able to demonstrate
this with Live charts rather than prepared setups. A forum which I have suggested earlier would allow you the
opportunity to achieve this and put you more on a par with Sam Seiden.
Best wishes,
John Bratchie
Great! Thanks for alpha