Think all engulfing patterns are the same?
Think again.
There’s one type of engulfing candle that consistently outperforms the rest, offering a much higher probability of success for trade entries.
Today, I’m going to reveal how to spot this pattern and add it to your trading arsenal.
Ready to discover high-probability engulfing candles?
Let’s begin…
The Psychology Behind Engulfing Patterns
If there’s one mistake I see price action traders, both new and old, make time and time again it’s focusing on the what rather than the why.
Most traders concentrate on the way something looks i.e the what.
For example:
When a pin bar forms the first thing people ask is “does it have a long wick?”. Or if a support level appears they think “Is it in the right place?”.
These traders are asking the wrong questions.
Knowing why something has formed is far more important than simply observing that is has formed i.e the what.
A great example of this is with engulfing patterns.
Tell me…
Have you ever thought about how an engulf forms?
I mean, I know they form because of people buying and selling (I’m not that stupid) but have you ever thought of HOW people must buy and sell to cause them to appear?
Because if you did you’d realize something amazing…
Most price action books, websites, and videos say an engulfing pattern forms as a result of the buyers (or sellers, in the case of bearish engulfs) overwhelming the other side.
This is true, I’ve got no problem with it.
But the one important fact all these books, gurus and videos miss is what happens when the price starts to overwhelm the previous candle.
Think about this for a minute…
If you place a sell trade because you’re certain the price is going to fall, what would do if it suddenly started to rise?
Close the trade, right?
But how do you close a sell a trade?
By buying back what you sold i.e by using a buy order.
Now what do think happens when the price moves against tens of thousands of traders who have bought (or sold, in this case?).
They all close their trades.
Which means…
Thousands of orders enter the market and cause the price to move in the opposite direction to which they placed their trades.
What I’ve explained above is the EXACT process that causes the price to reverse after a bullish or bearish engulfing pattern forms.
It happens like this…

The price falls, causing the first candle in the pattern to form.
The decline makes a large number of traders believe the price is going to continue falling. So they sell in an attempt to profit from the drop.
The banks and other big players see this and decide to use the orders entering the market to get some of their own trades/investments placed.
When they enter their positions the price rises, putting the traders who sold under pressure and causing a large number of them to close their trades. That then makes the price rise further and causes even more traders to close their trades, ultimately resulting in the reversal we see.
So that’s how an engulf cause a reversal.
But why have I told you all this? And what does this have to with finding high probability Engulfing candles?
Let me explain…
Most price action gurus and books say all engulfing patterns are the same.
They say that while patterns always look different the probability they have of causing a reversal is always the same unless a pattern forms at a technical point, in which case the chance is higher/lower.
To some people this makes sense, and I too used to believe it.
However, it’s not the case…
Some engulfing patterns do have a better chance of causing a reversal than others, regardless of whether or not they form as a technical point.
How do I know? Because of the way they form.
Like I explained, the reason an engulf causes the price to reverse is because the engulfing candle makes the traders who sold (or bought, for bullish engulfs) on the previous candle to close their positions, which, in turn, puts orders into the market that causes the price to rise or fall.
But here’s the “amazing” thing…
The more traders that close their trades, the more orders that are going to enter the market.
Which means…
An engulfing pattern where lots of traders have bought (or sold) on the candle that gets engulfed has a better chance of causing a reversal than pattern where only a handful have bought or sold on the candle the price engulfs.
I guess the questions now is:
“How do I know if lots of people have bought/sold on the candle the price engulfs?”
And the answer is by looking at how big the candle is…
Large Engulfing Candles Outperform Small Candles
One of the most important facts you need to know about price action facts is this…
The bigger the body of a candlestick is, the higher the number of people who are buying or selling upon its completion.
People relate size to certainty.
They think that when a candlestick with a big body forms it means the price is going to keep moving in the same direction; the bigger the candle, the more they believe it’ll continue, and the more people who’ll buy or sell to try to profit from the assumed continuation.
Now, to find out whether or not an engulf is likely to cause a reversal, we need to determine if a large number of people have bought or sold on the candlestick the price engulfs.
So to do this, we have to look at the size of the candle.
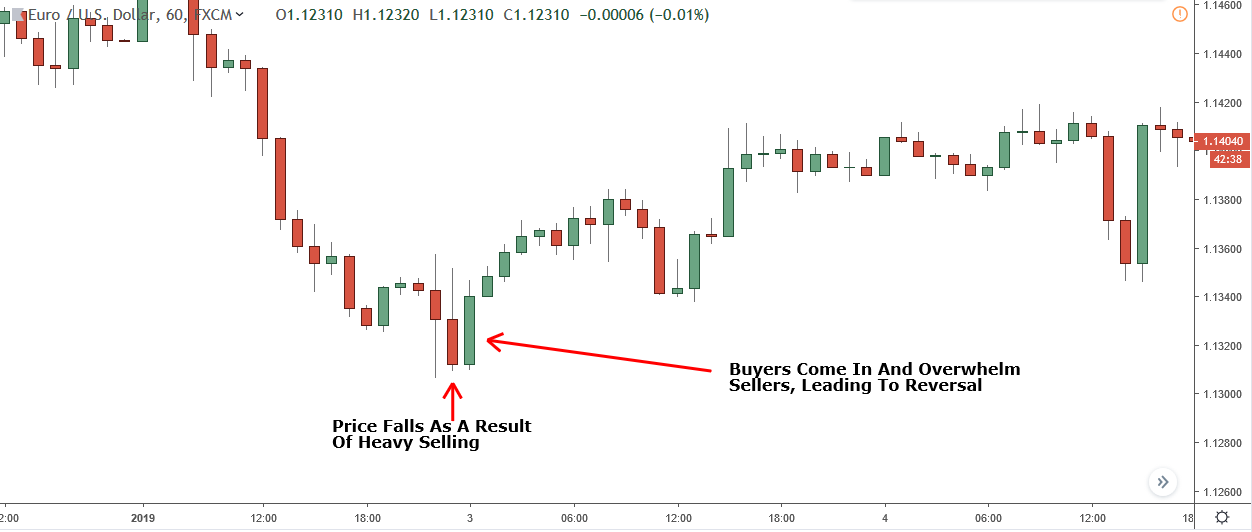
Take a look at the first candle in the engulfing pattern marked above.
It’s a big candle, isn’t it?
This candle is the kind of size you want to look for to find high probability engulfing patterns.
Being this big tells us that lots of people sold when the candle was forming. That, in turn, tells us that when the price engulfs the candle many traders will close (via buying), which gives the price a high probability of reversing and moving higher.
Here’s another one…

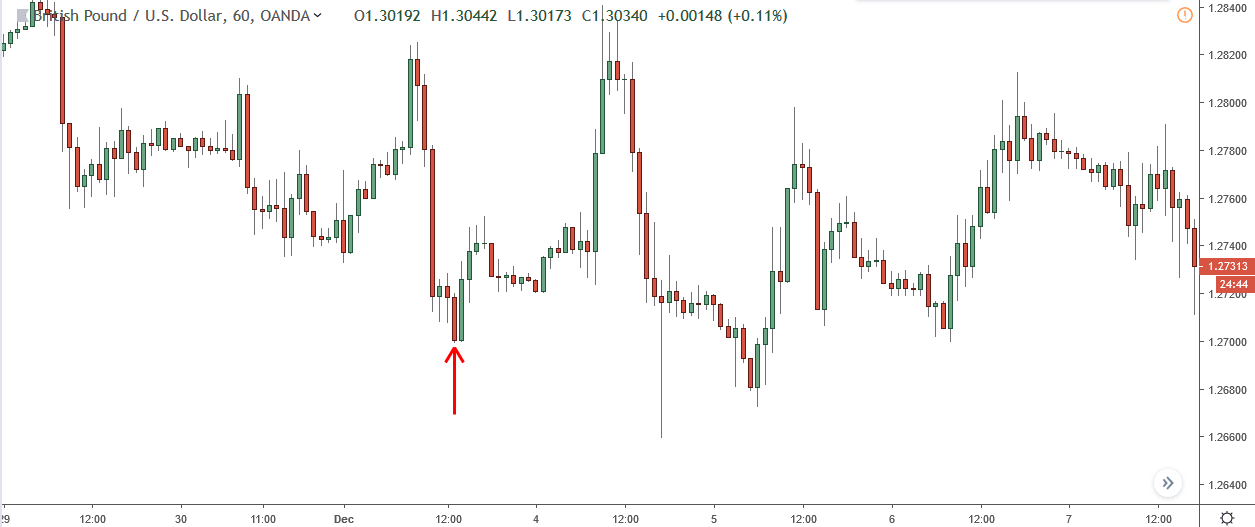
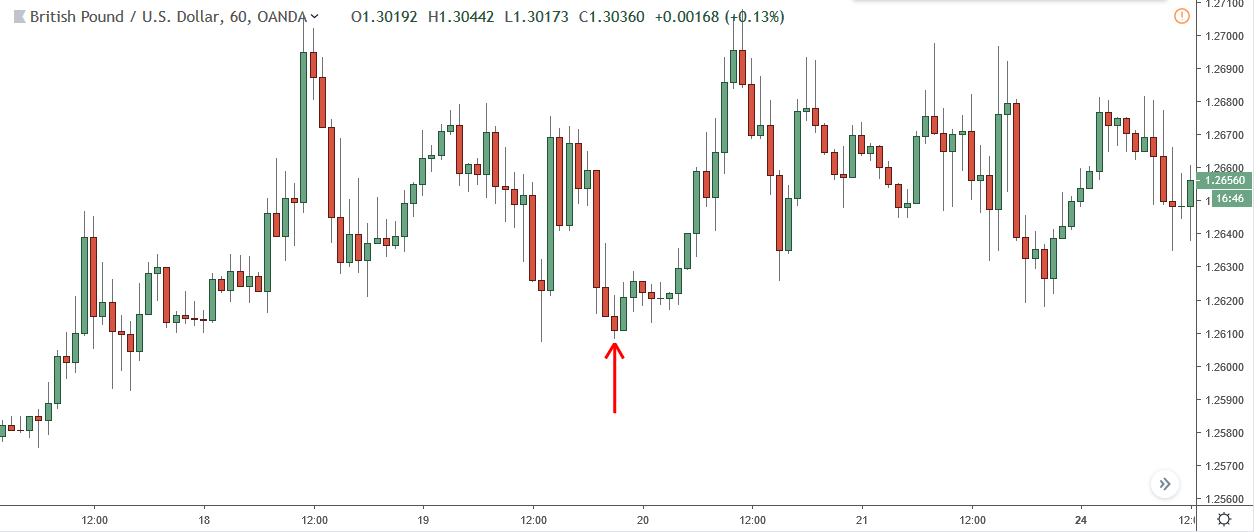
Again, take note of how big the candle that gets engulfed is.
If you look at the two other engulfing patterns and then at the one I’ve marked in red, it gives you a better idea of how big the candle needs to be for it to be a high probability pattern.
This is the type of pattern you want to avoid.
A small candle shows that not many people sold, which means there will only be a small number closing when the price engulfs it, giving the pattern a low chance of being successful.
You can see the candle that gets engulfed here is very small, which means not many people were selling when it was forming, giving it a low probability of causing a reversal.
Note: These patterns do work from time to time (especially when at technical points) but on their own have a low probability of being successful.
Summary
While It’s impossible for me to tell you exactly how big a candle should be for an engulf to have a high probability of being successful, hopefully these examples have given you a good idea. More info on engulfing patterns will be available soon. For now, I’ll leave any relevant links below.