
If it wasn’t already obvious, I’m a BIG fan of Tradingview – it kicks ass.
It takes the best features of other charting sites and programs and mashes them together into one single site.
The result is the most cohesive and feature-packed charting platform around that puts even the likes of MT4 and Ninjatrader to shame – and that’s just the FREE version.
Tradingview has a lot to offer, and you can learn all about it in my guide.
Today, however, I want to show you some of the cool secrets and tricks to using it I’ve picked up over the years so you can improve your analysis and take better trades.
Ready to learn what they are?
Let’s take a look…
Save Your Layout With Custom Templates
I’m not a big indicator guy – can you tell?
But if you use indicators and hate reapplying each one with the correct settings every time you close a chart, you’re going to LOVE what you can do on Tradingview.
I’m talking about Custom Templates.
On most charting sites, all your studies – indicators, lines, etc – vanish once you close the chart or switch to a new pair – ever seen this? Forcing you to place them all over again and change their settings back.
Naturally, this gets old… FAST.
However, with Custom Templates, you can avoid this…
They allow you to save your indicators and tools – you can’t save lines and zones, unfortunately – as a template for future use.
So rather than individually add each indicator and tool back whenever you close a chart, instead you can just add the template… all the tools and indicators will appear as you left them with the correct settings intact, removing the need for you to add them all again and change the settings yourself.
And this even works on different assents too – like stocks, commodities, crypto, etc.
As long as the tools and indicators are supported, you can add the template and see all your tools and indicators.
Here’s a quick guide on how to set it up:
First, add all the indicators and tools you want to save to the chart and change them to the correct settings. On a basic (free) account, you can only have 3 indicators/tools open at once, so you’ll need to upgrade to save more.
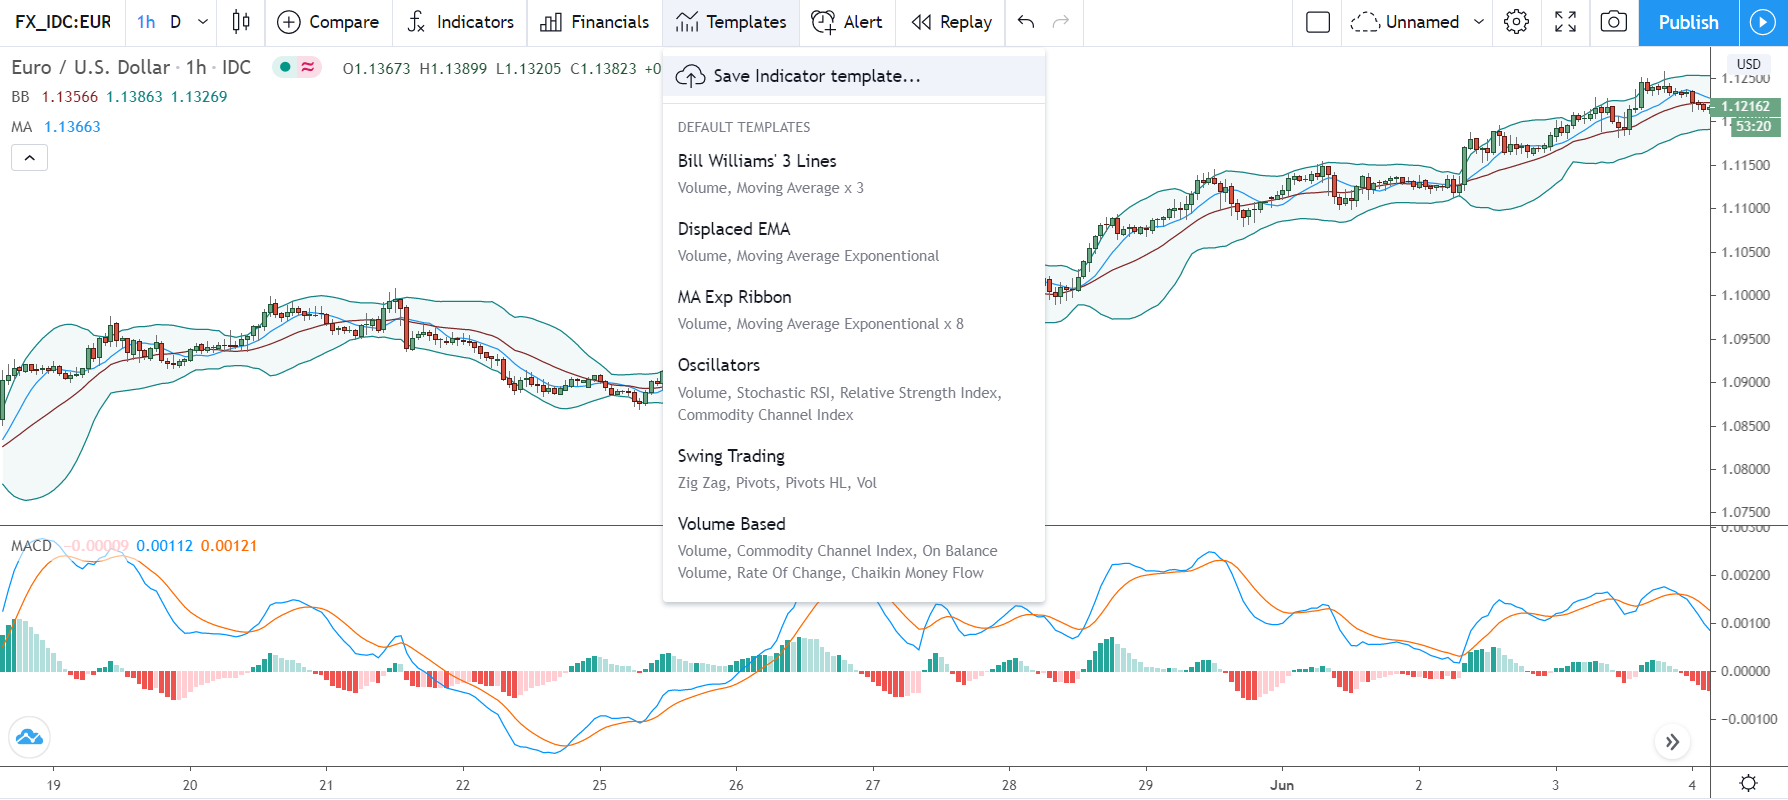
Next, head up to the Templates button at the top and click.
The template menu containing 6 default templates should open up. Simply hit “Save Indicator Template” at the top to enter a name and save your current chart as a template.
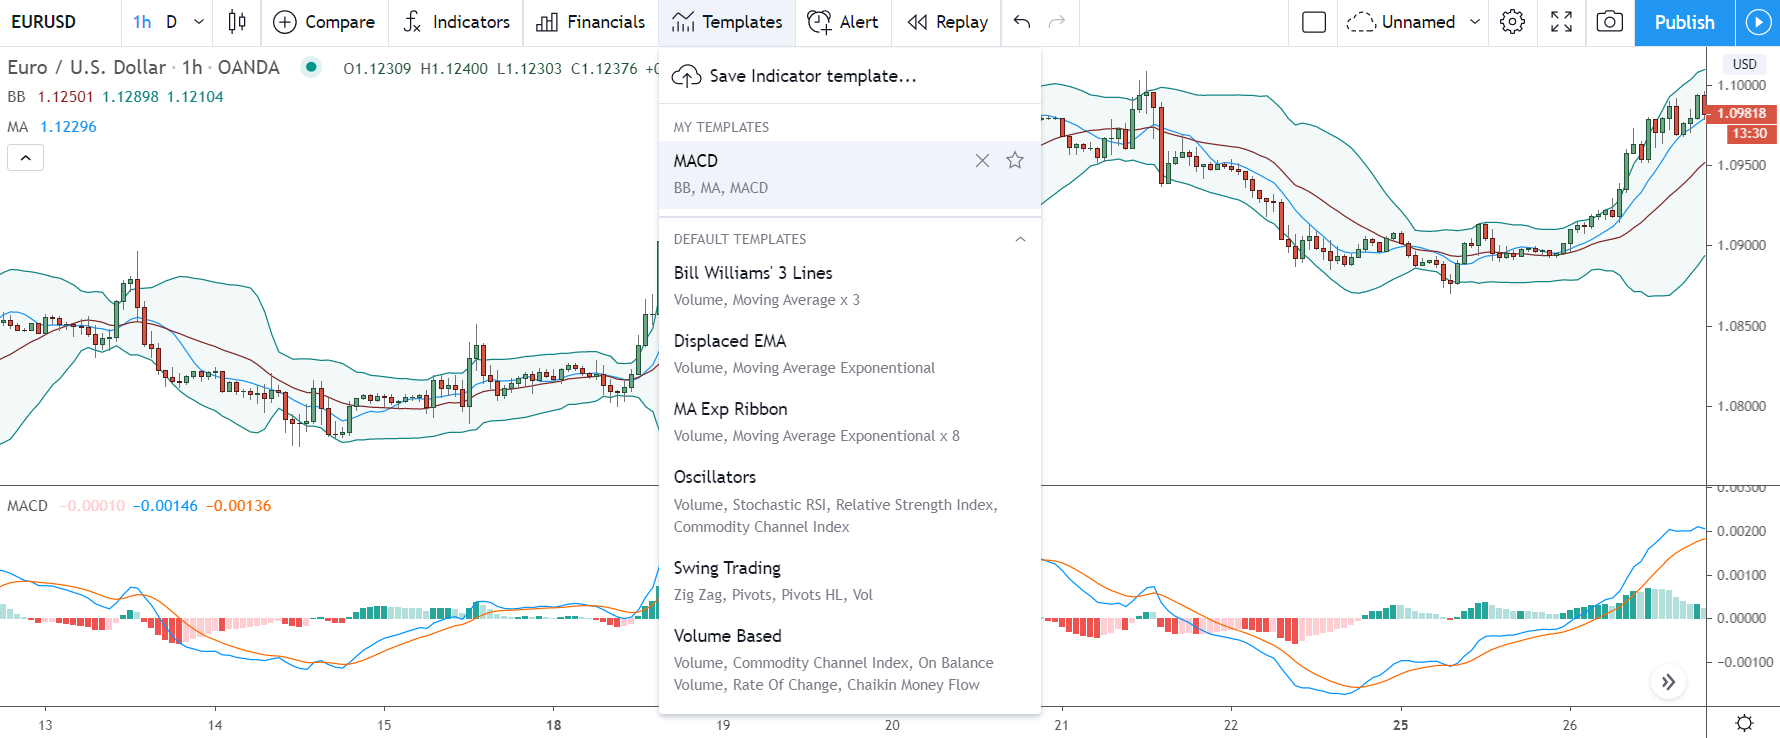
Your new template – which I’ve labelled MACD in the image – will now appear just below the 3 default templates.
Important Note: You can only save 1 template with a free Tradingview account. You need to get the pro or pro+ version to make multiple templates for different indicators.
Easily See Big Round Number Levels With The Line Tool
If you read my analysis, you’ll know I’m a big fan of big round numbers – prices that end in 00,000, or 0000.
These numbers – especially the prices ending in 000,0000 – create some of the strongest support and resistance levels in the market. With the banks and big traders often using them as points to get large trades placed – why we see so many market-changing reversals begin at or near big round number prices.
Big round numbers levels are easy to find…
Just look for the prices ending in the above.
However, Tradingview has a cool little feature that not only identifies the levels but marks them automatically for you on the chart.
Here’s how to access it…
Open up the chart menu by right-clicking somewhere on the screen and hitting the “Settings” button.
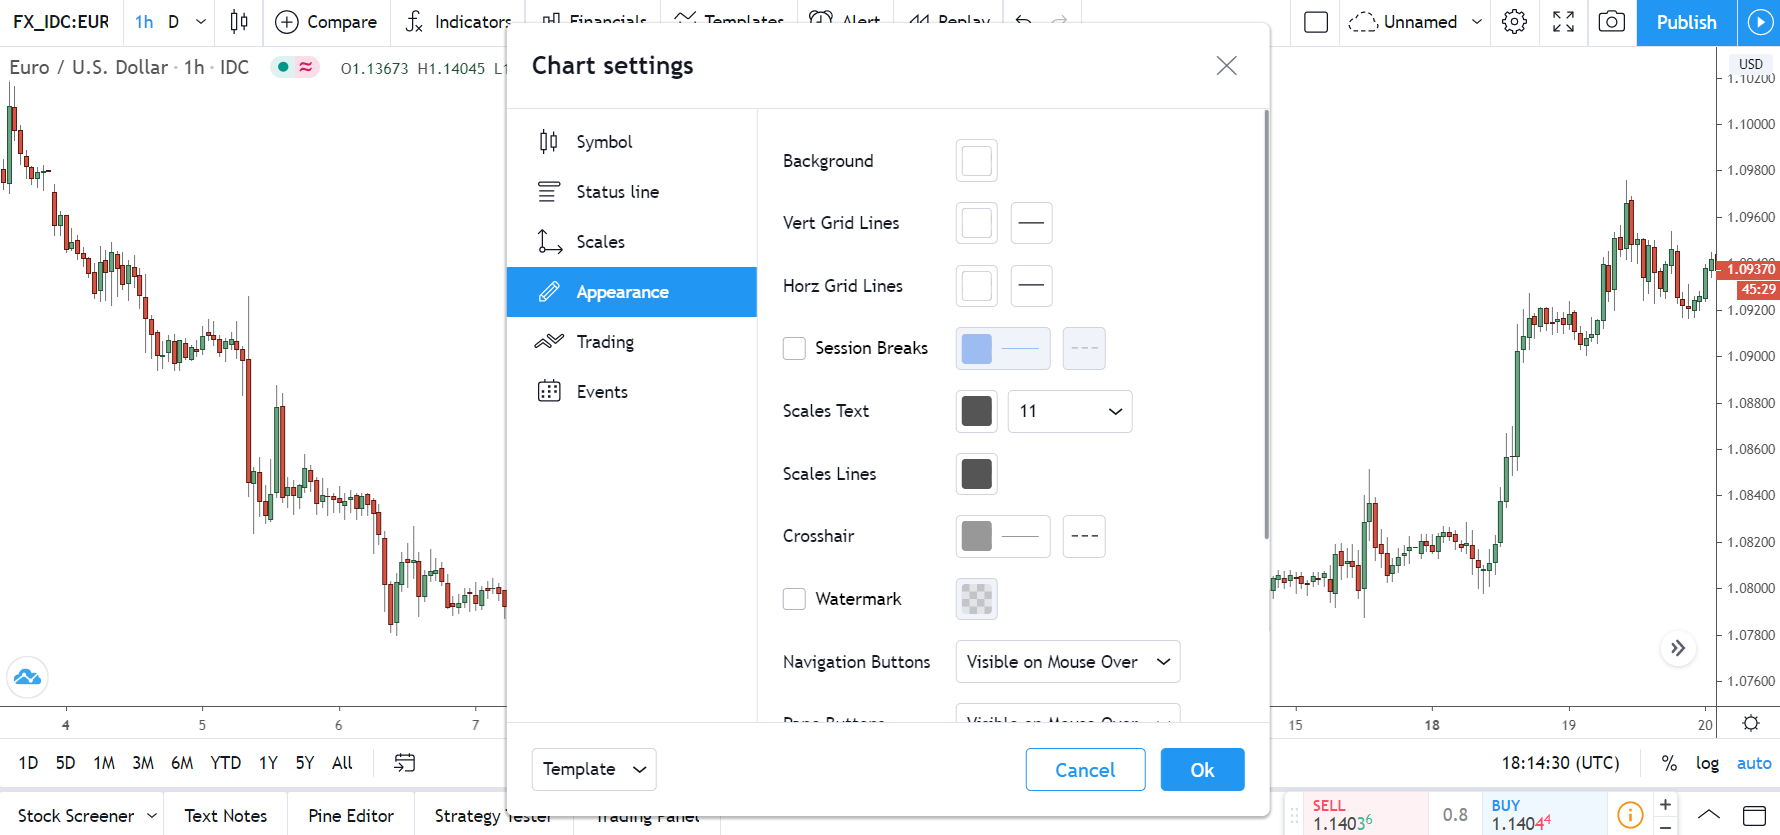
Inside the menu, head down to the appearance tab. A few options here, but the one you want to click is the “Horz Grid Lines” button found at the top.
Change the colour of this to black or whatever you want the levels to be, and close the menu.
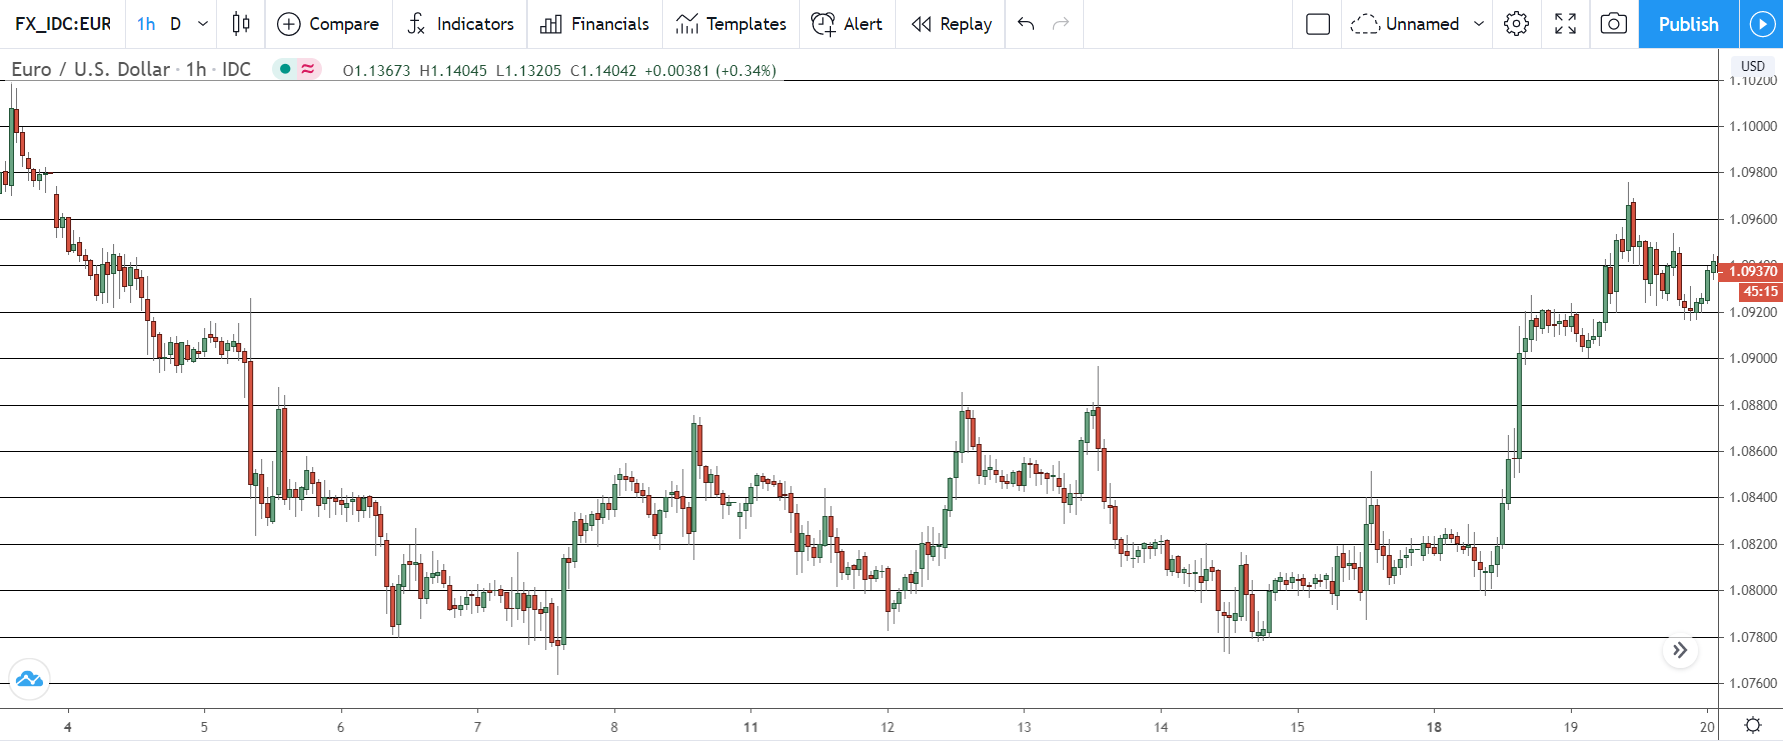
And just like that… all the levels ending in 500 and 000 will show up on the chart, making them easy to see for your analysis.
Not bad for a simple little tool, aye?
Use Market Replay To Get Valuable Experience
One of the best ways to improve your trading is going back over old trades.
I’ve rigorously deconstructed my past trades for years now. I get my Journal – another necessity – and go over each trade one by one, looking at why I lost, what I did right and wrong, and what lessons to take from it. It’s a fun process, and even today, I still learn new ways to improve that help my trading in meaningful ways.
But you know what would be even better than going over old trades in a journal, what would really help your trading and give you some key insights?
Re-living the same trades all over again in REAL-TIME.
And on Tradingview, this is something you can actually do…
With Market Replay.
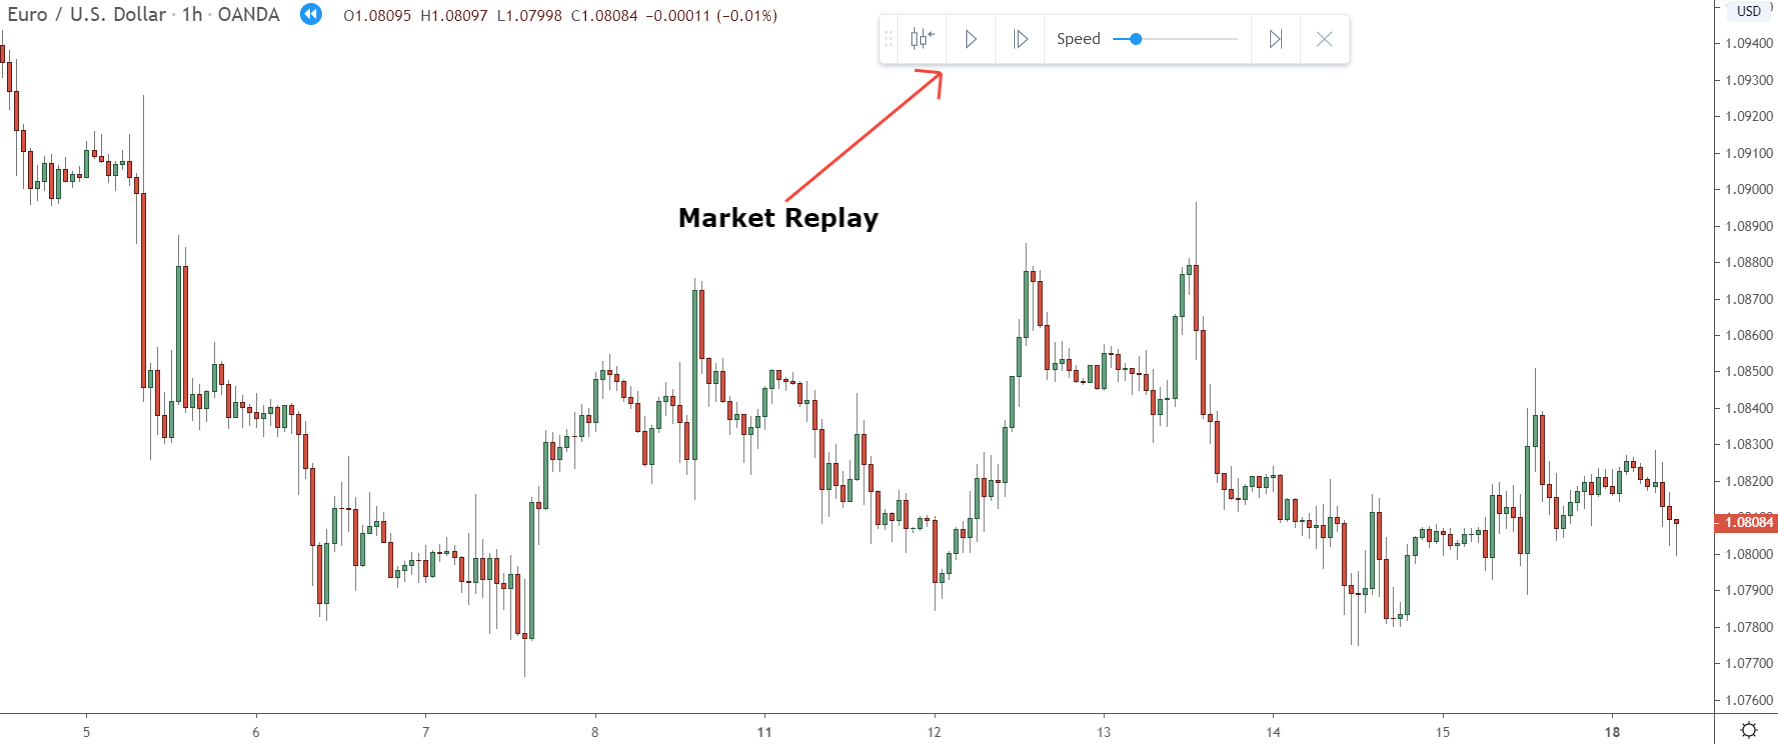
Now, if you’ve ever used Ninjatrader or FXCM, you’ll be right at home with the market replay tool.
Basically, it lets you rewind the market and then play it back… just like a video.
It’s real-time, so you can see exactly how all the candles formed one by one, and what effect news and other key events had on the price, making it easy to see what went right and wrong with your trade and what you can do to improve.
So, how does the tool work then?
Well, quite simple really…
You set a price in the market where you want to “play” the action from – so just before you entered a trade in this case. Then you hit the play button.
Price will start to move as if the action was live again.
If price moves too slow or too fast for your liking, you can change the speed using the selector in the menu. I always keep mine in the towards the centre, as it’s a good middle ground – not too fast, nor too slow – but you might want to set it higher or lower depending on your preferences.
Keep in mind, market replay is a paid tool – I know, right.
However, you can check it out for free:
Tradingview has a 30-day free trial that’ll give you full access to the tool along with all the other paid features. Just head over to the site (link below) and create a free account. Once you’ve signed up, a free trial should appear above your account name.
Hit it and follow the institutions to start your free trial.
Easy.
Important Note: When the 30 days are over, Tradingview will automatically put you on a paid account and start charging you. So make sure to opt-out before the 30 days is up, otherwise, you’ll be charged.
Easily Calculate Important Trade Info With The Risk-Reward Tool
Quickly calculating important trade info – like expected profit, maximum loss, stop price, risk-reward ratio, etc – is a right pain in the ass, especially in the heat of the moment when price is moving, and levels are lining up.
If only there was a tool that gave us all this info automatically, so we didn’t have to work it out ourselves.
Oh, wait, there is…
Hidden inside the prediction and measurement tool in the sidebar is the Long/Short Position Tool.
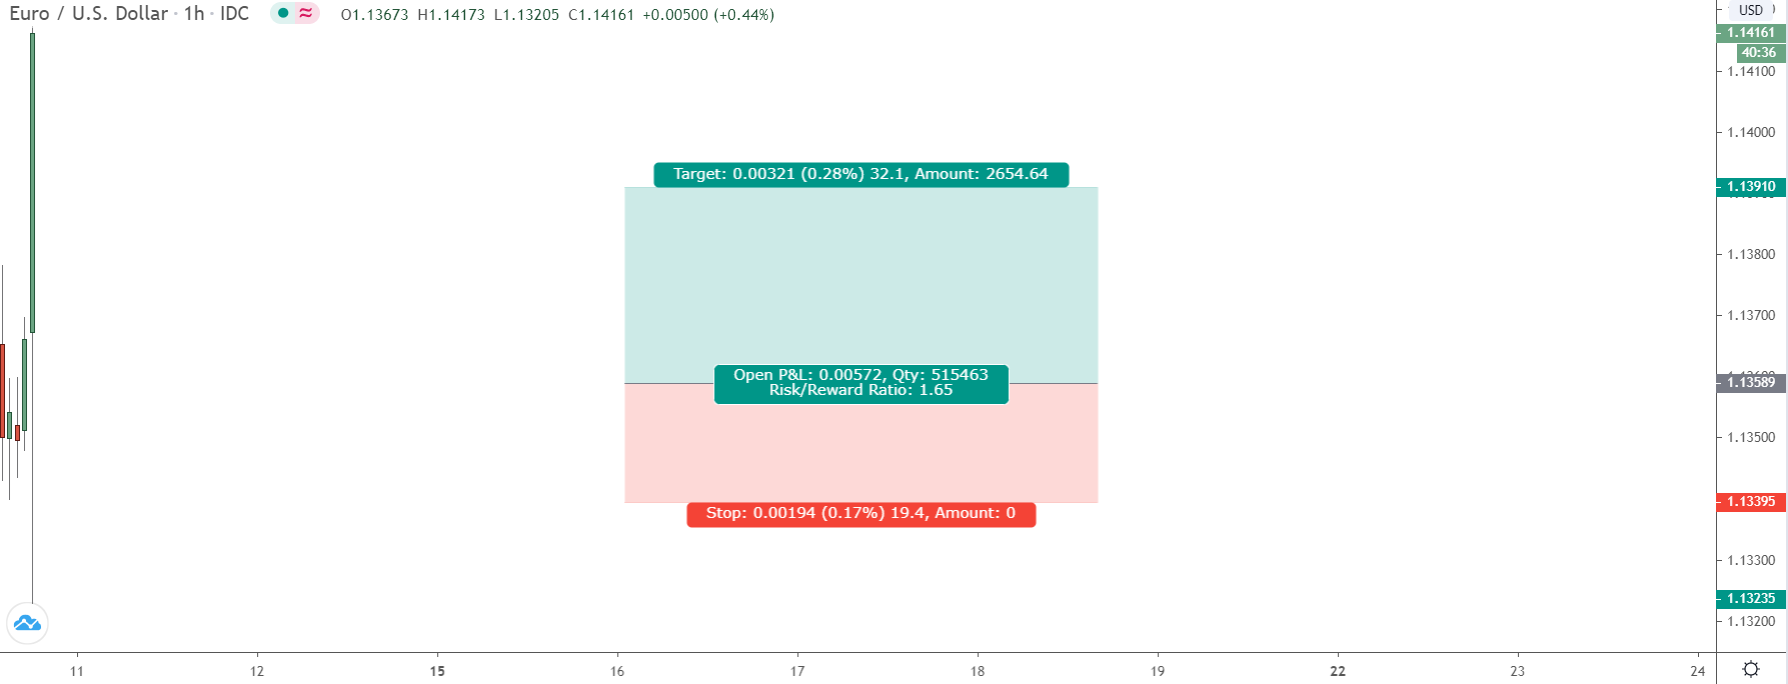
This inconspicuous little tool, which not many traders even know exists, is one of the best on Tradingview. It allows you to visually see all the important information about your trade automatically via lines on the chart.
Everything from risk to reward ratio, expected profit and loss, stop price, entry price, and take profit is visually shown by the tool. You don’t have to work anything out yourself. Simply enter your trade size into the settings menu and then move the lines up and down to easily see all the info on the chart.
Pretty cool, huh?
How To Use This Tool
You’ll find the long/short position tool inside the Prediction and Measurement tools tab, just above the little black arrow icon down the left sidebar (see below).
Hit the tab, and you’ll see the tool open up in the menu.
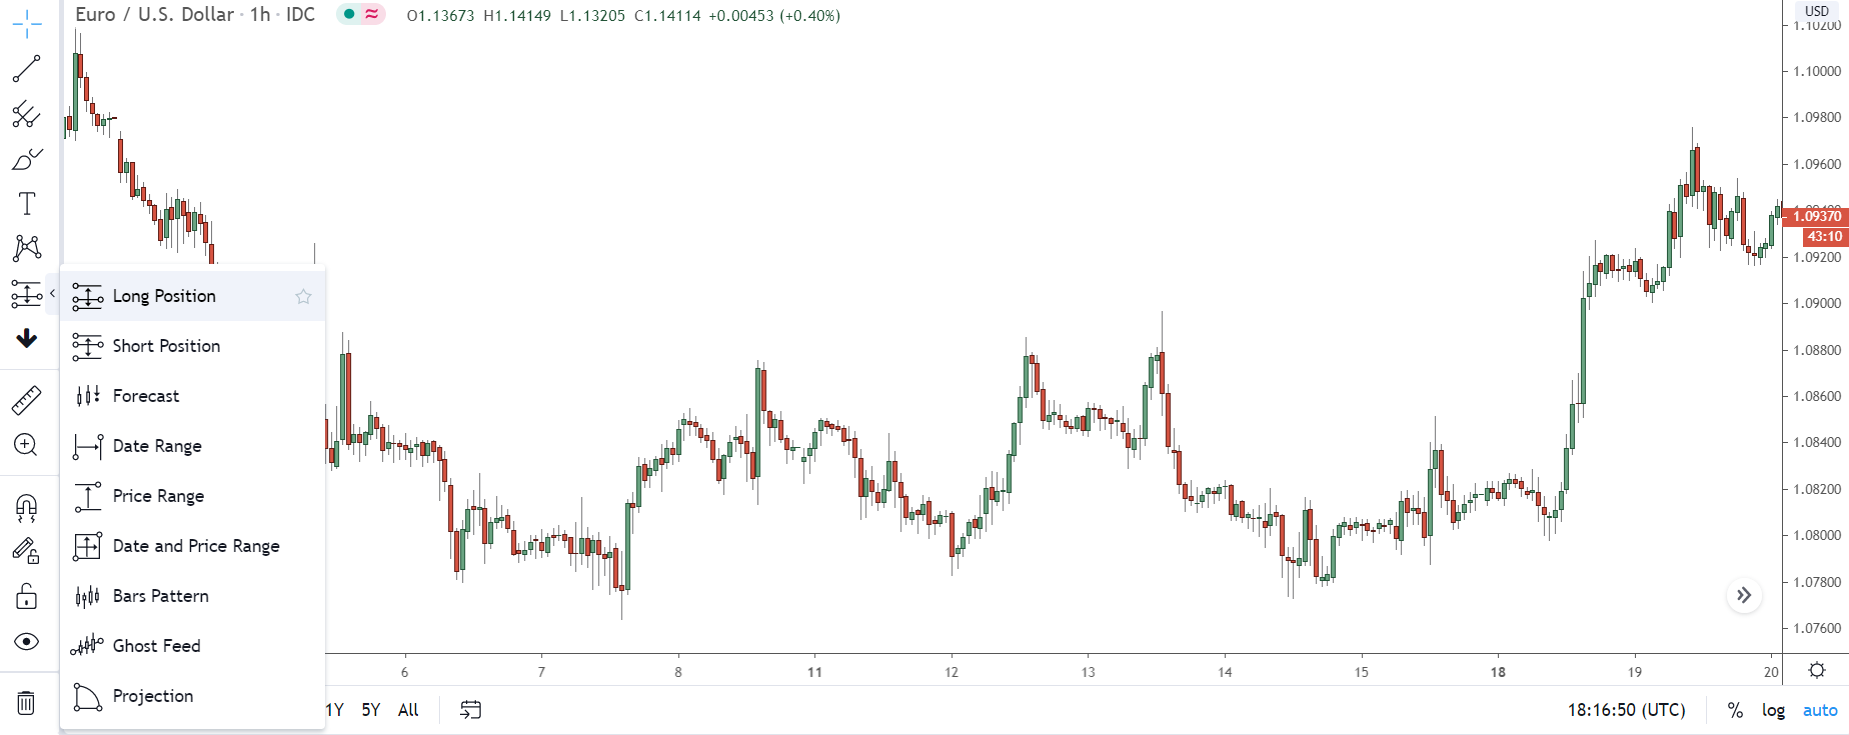
As you can see, it comes in two variations for both long trades and short trades:
Long position.
Short position.
Select which tool you want to use – make sure you select the right one, otherwise, the information won’t display correctly – and then click somewhere on the chart to add it.
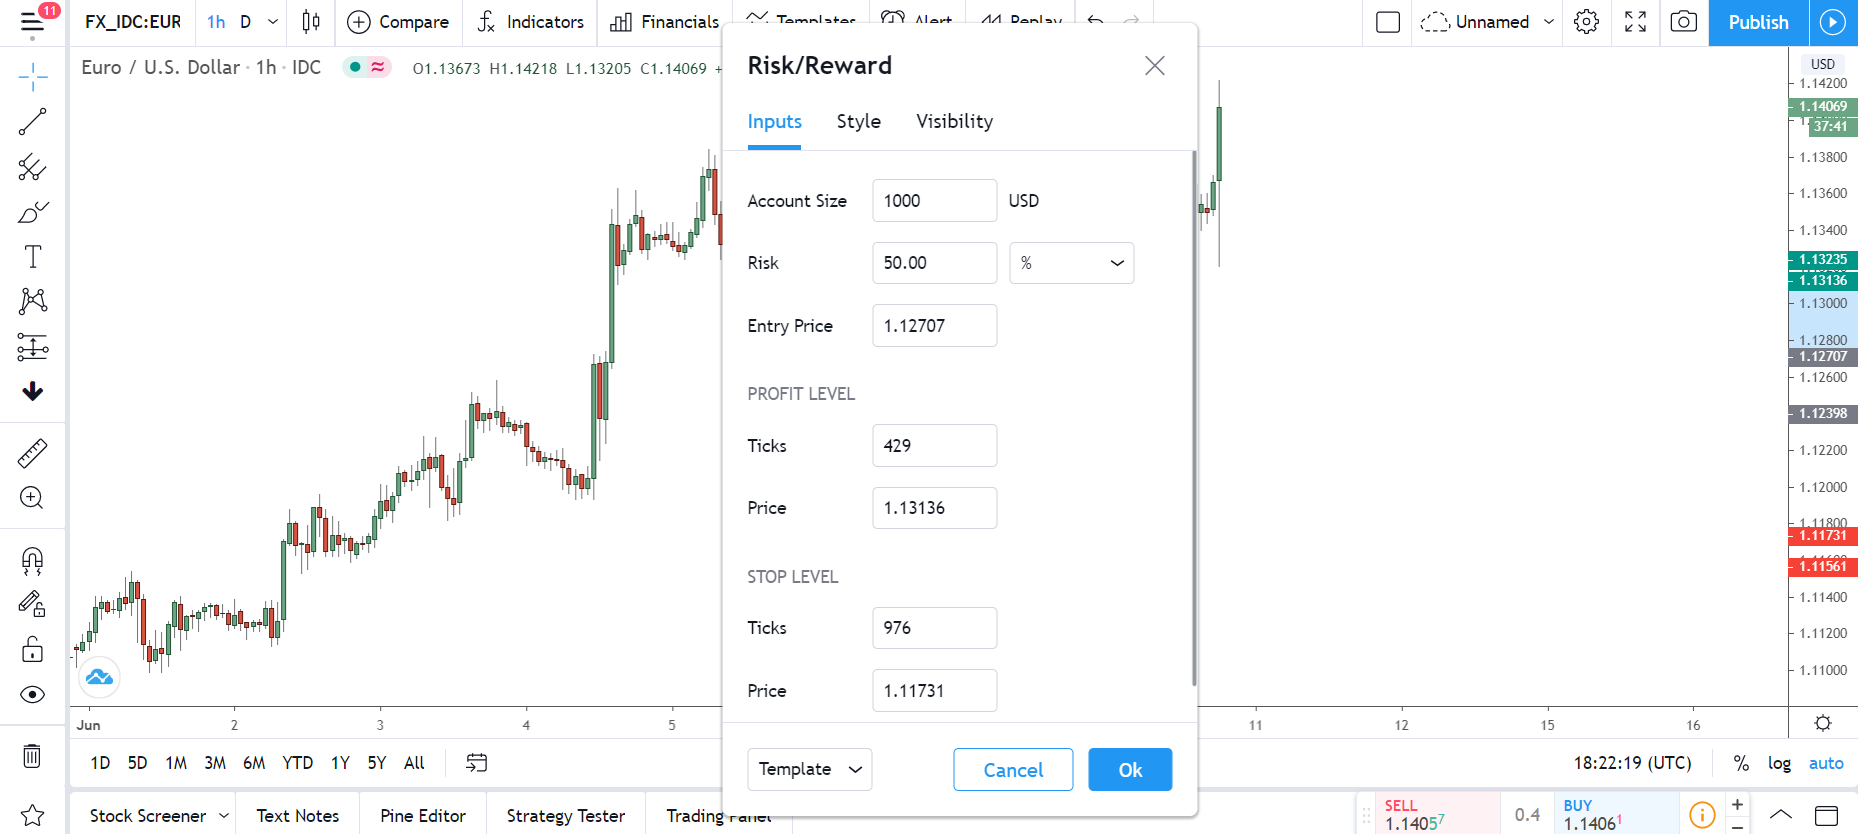
Once you place the tool, right-click one of the lines and open up the settings menu.
By default, the tool doesn’t show the right info about your trade, so you need to enter your risk and account balance for it to show the information and work correctly. To do this, click the inputs box in the menu and then enter your info into the boxes – you can also put in your entry and stop price here, to save doing it manually.
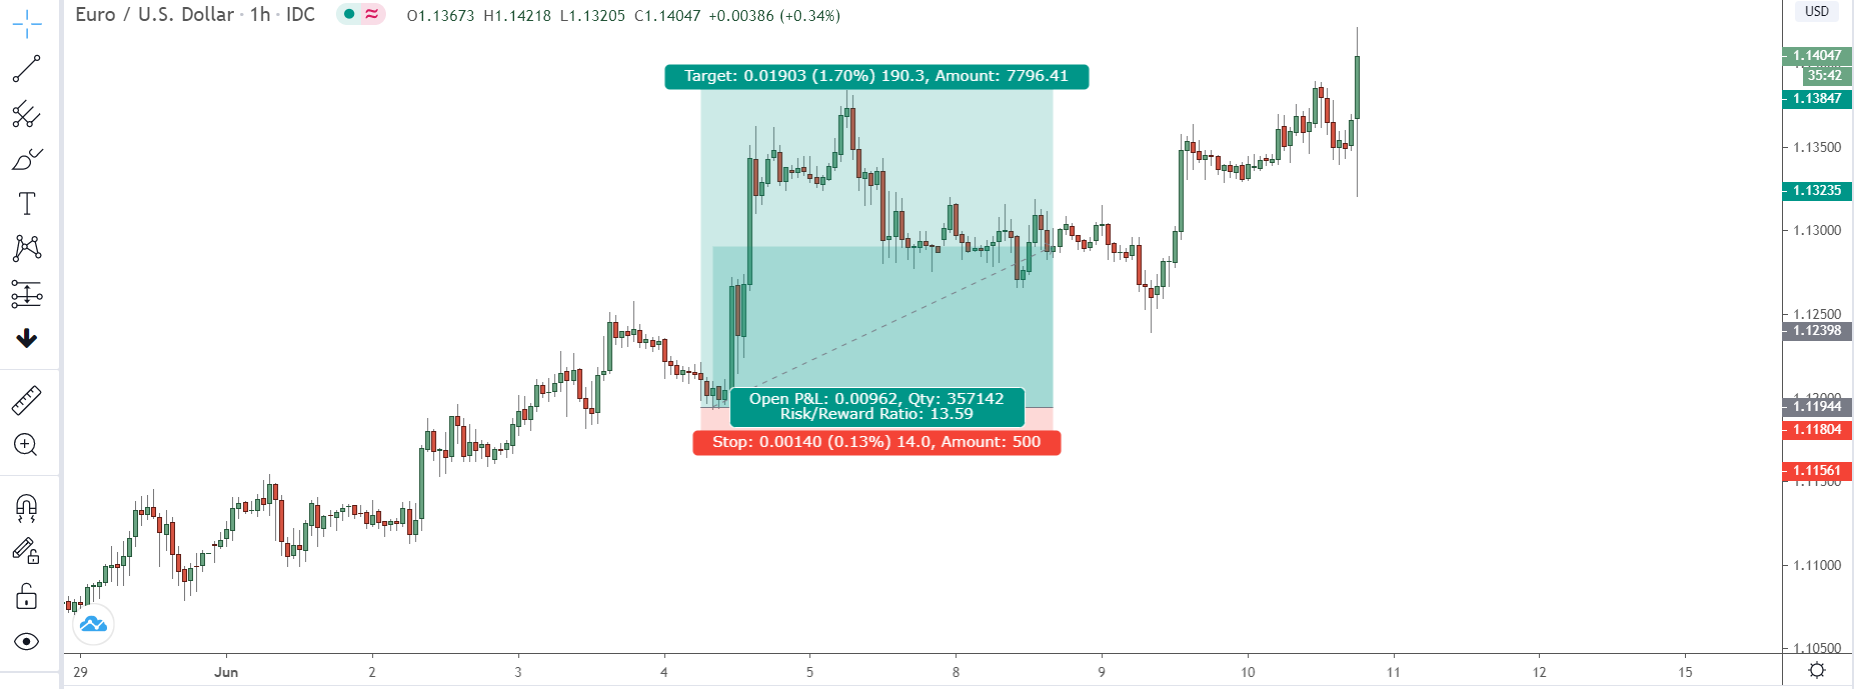
Now, move each line to its respective position on the chart – middle line to entry price, bottom line to stop price, top line to take profit – and the information about your trade will show up above the line.
Easy, right?
To see your open P & L change, click the right side of the tool – red arrow – and move it along each time a new candle forms.
And with that, you’re ready to go.
Never Miss A Trade With The Alerts Button
It doesn’t get much worse than missing a profitable trade or prime exit because you were away making a cuppa or out getting groceries.
Wouldn’t you agree?
I’ve lost count of how many times this has happened to me over the years… probably in the hundreds by now.
But, you know, Tradingview has a great feature that makes this go away…
It’s the Alerts button.
Alerts are nothing new in trading – MT4 has them, as do many other charting platforms and brokers. However, while these alerts work well for what they are, they ain’t got nothing on what Tradingview provides…
In a word, they’re AMAZING.
They give you a crazy amount of features and customization options, some of which I’ve never seen before. Want your alerts to trigger when a moving averages crossover?
You can do that.
Want the alert to send a message to your phone when it gets triggered?
Set it up in the menu.
Almost every option you can think of is supported, making it almost impossible to miss out.
How To Set Up Alerts On Tradingview
There are two ways to set up alerts on Tradingview:
You can either manually right-click the line, level, or indicator you want to set the alert on and hit the Alerts option. Or you can head over to the alerts menu at the top and then enter the information yourself. Both ways contain exactly the same options, so you can’t really go wrong with either, it’s just personal preference.
Here’s how to do it through the menu:
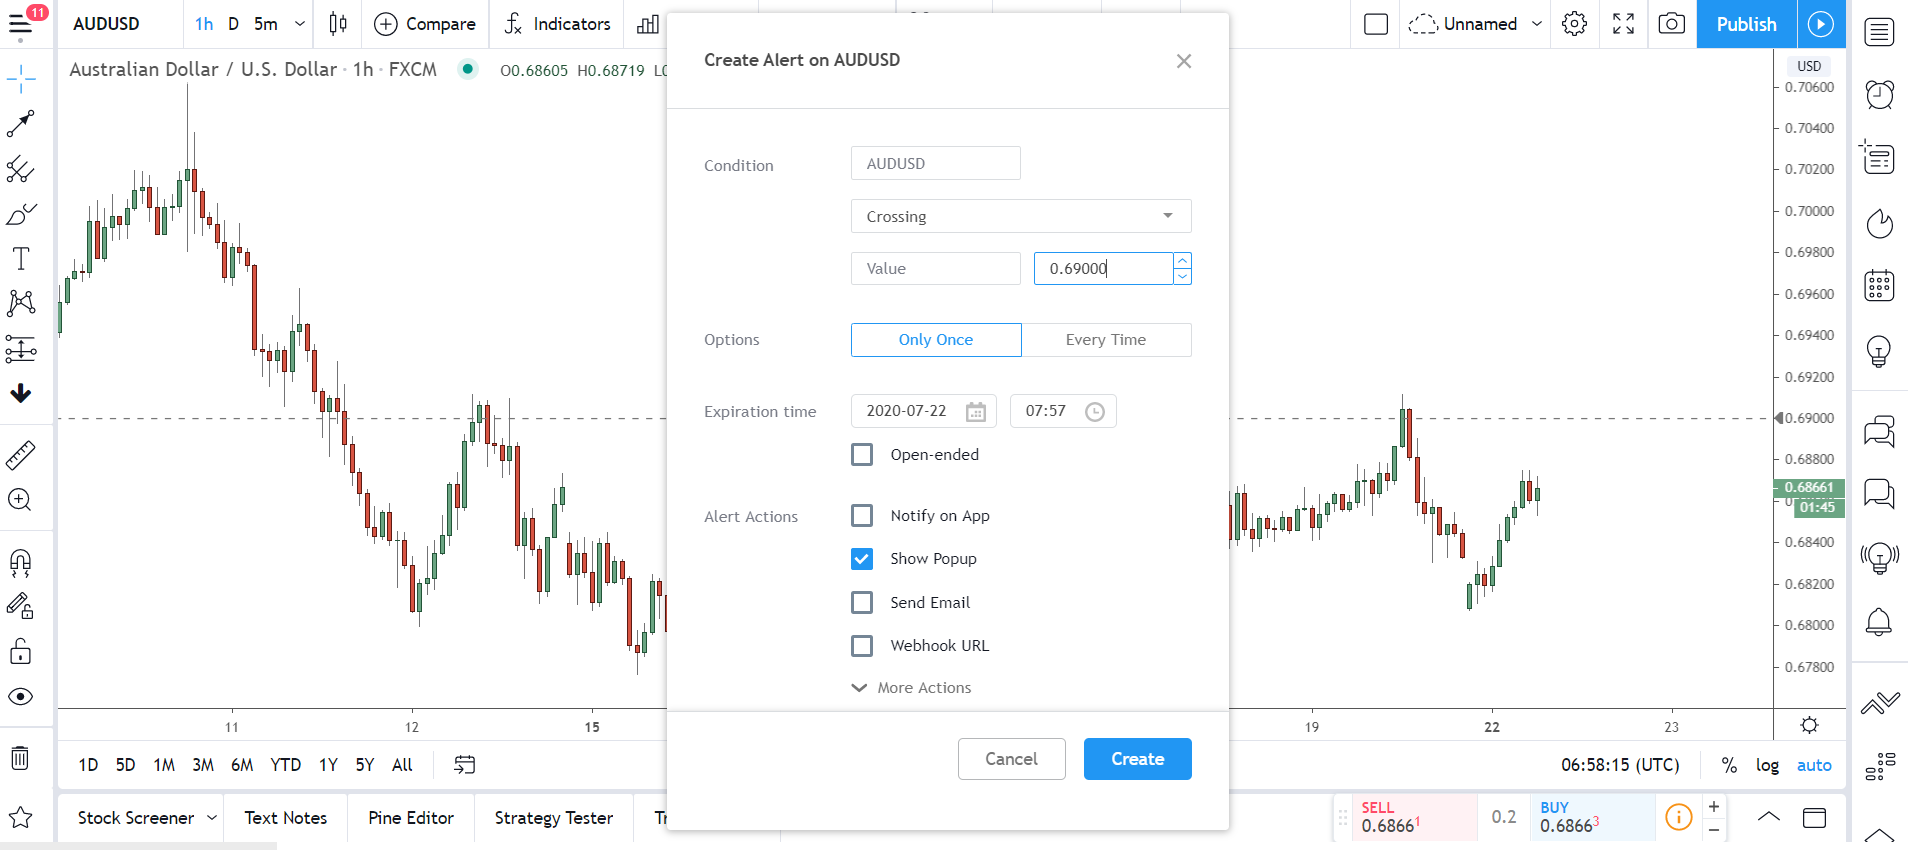
When you open the Alerts menu, you’ll see the screen above showing all the options for customizing your alerts – again, these are all available when you right-click a line, level, indicator, and hit the alerts button too.
To set an alert, first, choose how you want it triggered by selecting the condition.
Lots of options are supported here, so knock yourself out and choose one that best suits you.
Next, select whether you want the alert to execute only once or every time the condition is met. After that, set the time and date you want the alert to expire at. On a free account, the maximum time is 2 months, so you’ll need to upgrade if you want the alert to stay open longer.
Onto the delivery method now…
Tradingview has 4 different ways of sending alerts: SMS, Email, sound alerts – a sound plays on your PC when the alert is reached – and app notifications – you need the Tradingview phone app (which is free) for this to work.
All are free to use, but you do need a paid account for Sms alerts.
Once you’ve made your choice, hit the okay button…
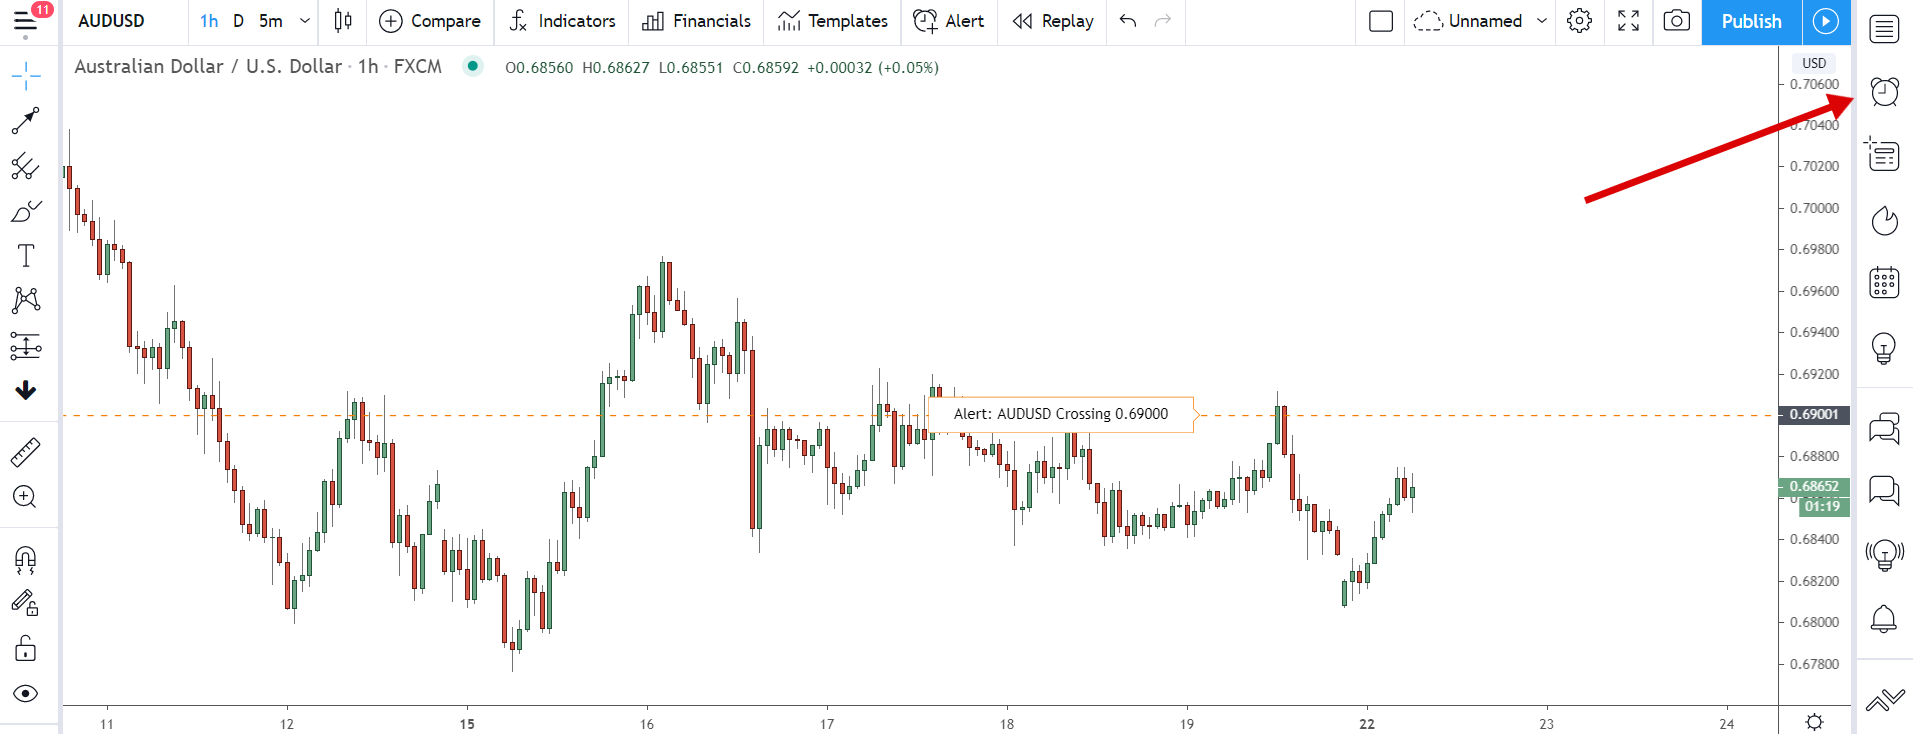
Your alert will show as a dotted horizontal line on the chart.
If you ever need to edit or remove your alert, simply right click the line.
Alternatively, you can open up the alerts tab using the right sidebar (red arrow). All your alerts show here along with a backlog of your previous alerts, which makes them easy to edit and remove, especially if you have more than one open.
The Bottom Line
Learning the ins and outs of your charting platform is the key to using it successfully.
With these 5 secrets, hopefully you now have a better idea of some of the cool things Tradingview allows you to do, and can start using them to help you out and improve your trading.