
If you trade supply and demand, no doubt, you’ve heard of Sam Seiden.
One of the top S & D guru’s, Sam Seiden created the supply and demand strategy in 2010. Since then, he has gone on to create his own trading site – OTA Academy – that teaches traders all over the world how to trade supply and demand using his methods.
We must thank Sam, as without him, supply and demand as we now know it (and probably this site too) would not exist.
However, hold the applause… please…
While Sam does get props for coming up with supply and demand trading, the way he teaches people to trade the strategy contains THREE MAJOR FLAWS:
- Old zones have the potential to cause reversals (they don’t).
- Banks place pending orders at zones to make price reverse. (hint… they don’t)
- Zones with a strong move away are more likely to work than zones with a weak move away. (duh, what do you think?)
I’m sure you’ve heard of these before?
On the surface, these 3 facts make sense – I mean, old zones cause reversals all the time, right?
However, when you take a step back, and think;
- How does the market work?
- And why does Sam believe these facts?
You begin to realize they don’t make any sense at all!
I know, from my own experience, trading S & D under these facts (beliefs) is a sure-fire way to suffer many, many losses.
To help you avoid this, today, I’m going to explain:
Why Sam gets these 3 facts wrong and, what you should use instead?
Sound interesting?
Let’s take a look at fact #1…
Saying Price Reverses Because The Banks Have Left Over Orders
For those familiar with Sam Seiden, you’re probably aware he came up with the concept of supply and demand trading while serving as an order runner at the Chicago stock exchange.
In his role as a runner, Sam placed trades on behalf of banks and institutions… somewhat like a market maker, albeit on a more personal level. It was during this time he reportedly observed banks often placed their orders at specific levels.
What we now refer to as Supply And Demand zones.
According to Sam, banks would initiate their trades, thus triggering a price reversal and creating the ‘zone.’ Subsequently, they’d engineer price to revisit the same point to complete the remaining trades because there were insufficient orders to execute all of their trades in one sweep.
If you’ve read my books, this may sound familiar.
A fair amount of Sam’s theory is on point…
Banks do indeed place their trades at specific levels, establishing supply and demand zones. And it’s a fact that due to market dynamics, they can’t place all their trades all at once.
They must make price return at a later stage.
However, Sam’s description of how banks place their leftover trades doesn’t quite hit the mark. He suggests banks utilize pending orders for this purpose, which can lead to a misinterpretation of supply and demand trading.
Sam argues that banks, when placing left over trades, employ pending orders – an order to buy or sell at a designated price.
These orders are set at the zone, aligning with where their initial round of trades was executed.
When price returns, the pending order is executed, causing a reversal.
At first glance, this seems logical.
But here’s the kicker:
Banks don’t typically use pending orders for trade entries… It’s too high-risk!
If a bank were to place a pending order at a zone, how could they determine whether sufficient opposing orders would arrive by the time it returns to fully execute and place their remaining trades?
It’s impossible to predict!
The same situation could reoccur over and over again.
If price returns and there are not enough incoming orders, the bank’s trades could only partially execute. This means they would have to engineer another return, wasting valuable time and resources, to place the remaining trades.
So, if banks aren’t using pending orders, what are they using?
Here’s the answer: Market Orders.
Market orders offer the flexibility to enter immediately at the current price – a function you probably use all the time. With market orders, banks can adjust their trades to align EXACTLY with the available orders coming into the market.
This mitigates the risk of having to return repeatedly to a specific price to execute all their trades.
Using market orders, banks gain superior control over their positions and their influence on the market. They can customize their trades based on the incoming orders, avoiding the many risks associated with pending orders, such as slippage.
Moreover, using market orders means banks don’t reveal their positions to other traders.
Other market participants, like hedge funds, professional traders, governments, etc., can leverage pending orders to predict future price movements.
Consider this:
If a hedge fund identifies a large pending order to buy at 1.24000 on EUR/USD, they may deduce a price rise is anticipated, hence the significant order.
This information could be utilized to their advantage, either by trading in the same direction or by mobilizing opposing players to trigger the order and then take the market in the opposite direction, causing the bank to lose money.
You might be thinking, “Is this really that important for S & D trading?”
The answer: YES, it is…
The idea banks use pending orders to trigger price reversals away from supply and demand zones forms the backbone of the entire strategy.
The majority of the rules and guidelines for trading the zones, particularly those proposed by Sam, are based on the belief banks have pending orders at the zone, ready to cause a reversal. The reality that this isn’t accurate means these rules are fundamentally flawed…
They simply don’t hold water and so, should not be adhered to.
And the ideal example of this misconception: The idea old zones cause reversals…
The Idea Old Zones Cause Reversals
Take a peek at your charts, and you’ll notice old supply and demand zones appear to cause reversals frequently.
Days, weeks, or even zones years old… they all seem to initiate reversals.
But, let’s pause here:
Are these zones genuinely behind the reversals or is something else at play?
In Sams mind, it’s all about the zone…
He proposes old supply and demand zones are just as likely to trigger a reversal as new zones.
The basis for his argument is this: as a runner, he regularly observed banks placing their orders around old zones. Therefore, he says old zones must also cause reversals – why else would banks position their orders there?
Many of Sam’s arguments about supply and demand, on face value, appear logical.
If you inspect your charts, old zones indeed seem to be behind reversals consistently.
But, let’s dig deeper: in reality, this is somewhat of an illusion…
While it may appear price reversals originate from old supply and demand zones, it’s not really the zone igniting the reversal. Instead, it’s some other technical factor, unrelated to supply and demand, which occurs at the same spot.
If you think about it for a moment, you’ll see why it doesn’t quite add up:
Why would banks hold out for months or even years for price to return to a zone? Just to get a handful of leftover trades executed?
Banks, if they have leftover trades, want them executed pronto!
They certainly wouldn’t wait around.
The whole market could shift and nullify their rationale for entering.
Consider this…
Suppose you enter a trade because you predict a large rise, but you haven’t been able to execute all your buy trades.
You’d want price to return to the same spot ASAP to get the remaining trades executed, right? If you wait weeks or months on end, your initial reason for anticipating a price rise may alter, rendering it pointless to execute the remaining trades.
So, that’s why old zones don’t trigger reversals.
They may seem to – and for a long time, I too was under this impression – but the reversal is really incited by something else.
What that ‘something else’ could be hinges on where price stands.
It could be a support or resistance level, a significant round number, a cluster of stop orders, a news release, or even the discovery of a new planet named Elon…
If you’re uncertain whether a zone is old or not, take a look at the list below:
1 min/5 min/15 min charts – 1 day,
30 min/1 hour/4 hour charts – 20 days,
Daily chart– 3 months.
These are the times (roughly) of when a zone becomes old and should not be traded.
They’re not exact times – be sure to give a little leeway for each – but they should keep you trading the right zones.
Saying The Best Zones Are Those With A Strong Move Away
Back in the day, I used to take quite a bit of heat for suggesting zones with a strong move away aren’t necessarily powerful. Surprising, right? Yet, it rings absolutely true and remains one of the key reasons people still lose money with supply and demand.
For the uninitiated, let’s unpack this:
Sam consistently says the strongest zones are those resulting from a strong move away.
Picture zones like this, for instance…
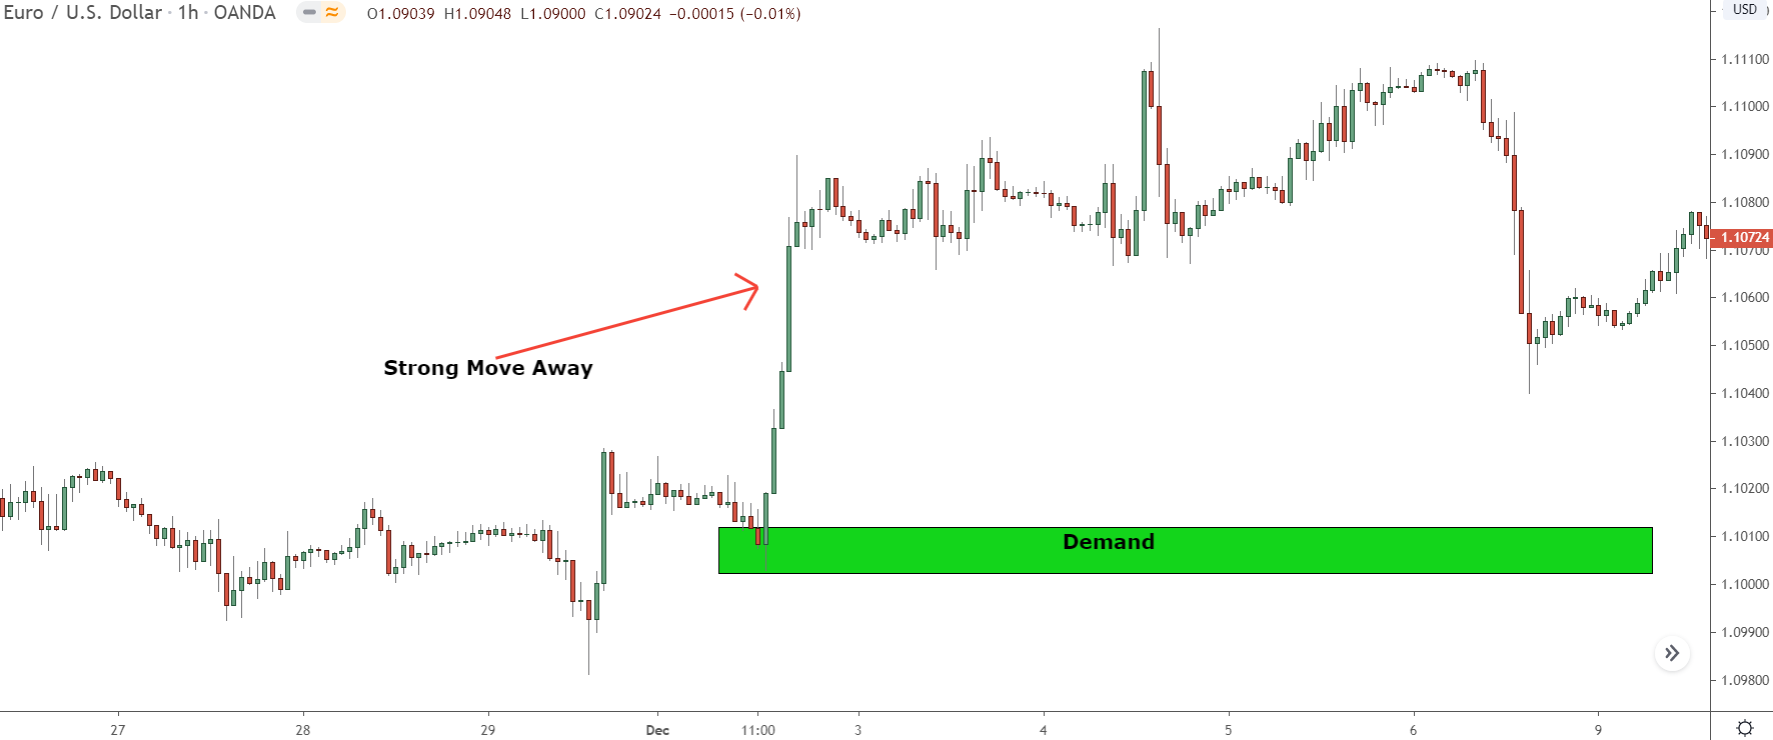
Ever tried trading these?
According to Sam, these zones have a higher-than-average probability of triggering a reversal.
His theory is they indicate the banks have a sizeable number of leftover orders (or trades) at the zone, due to the abrupt move away preventing them from placing all their orders.
On a technical level, Sam is on point.
Here’s why:
When the price skyrockets or plummets, it signifies the entry of a massive order – hence, the significant price shift. Consequently, it’s highly improbable the banks managed to place all of their trades and indeed had some leftovers still to place.
However, the chink in his armor lies in what I’ve explained earlier:
Banks don’t use pending orders to execute trades…
Instead, they use market orders.
If banks were to lay pending orders at the zone, to be executed when the price revisits, they would be in the dark about the availability of enough opposing orders to place their own. This uncertainty could lead to a scenario where insufficient orders are coming in.
This, in turn, could result in their trades not getting executed, thereby leading to a repeat of the same situation.
The key takeaway:
The notion zones with a steep move away are strong, owing to the fact they indicate a surplus of leftover bank orders at the zone… yeh, it doesn’t hold water.
I understand why Sam thinks this way and how it seems to be that way from a chart perspective, but that’s not actually the case.
It just can’t be, given banks don’t use pending orders to initiate trades.
With this in mind, the next logical question that arises is:
“If zones with a sharp move away aren’t actually strong, then which zones are?”
Providing an exhaustive explanation of this within the time we have today would be challenging, given the amount of detail and jargon involved. Nonetheless, here’s a brief overview to give you an inkling of what to look for:
To pinpoint the strongest zones, focus on zones preceded by a protracted rise or decline.
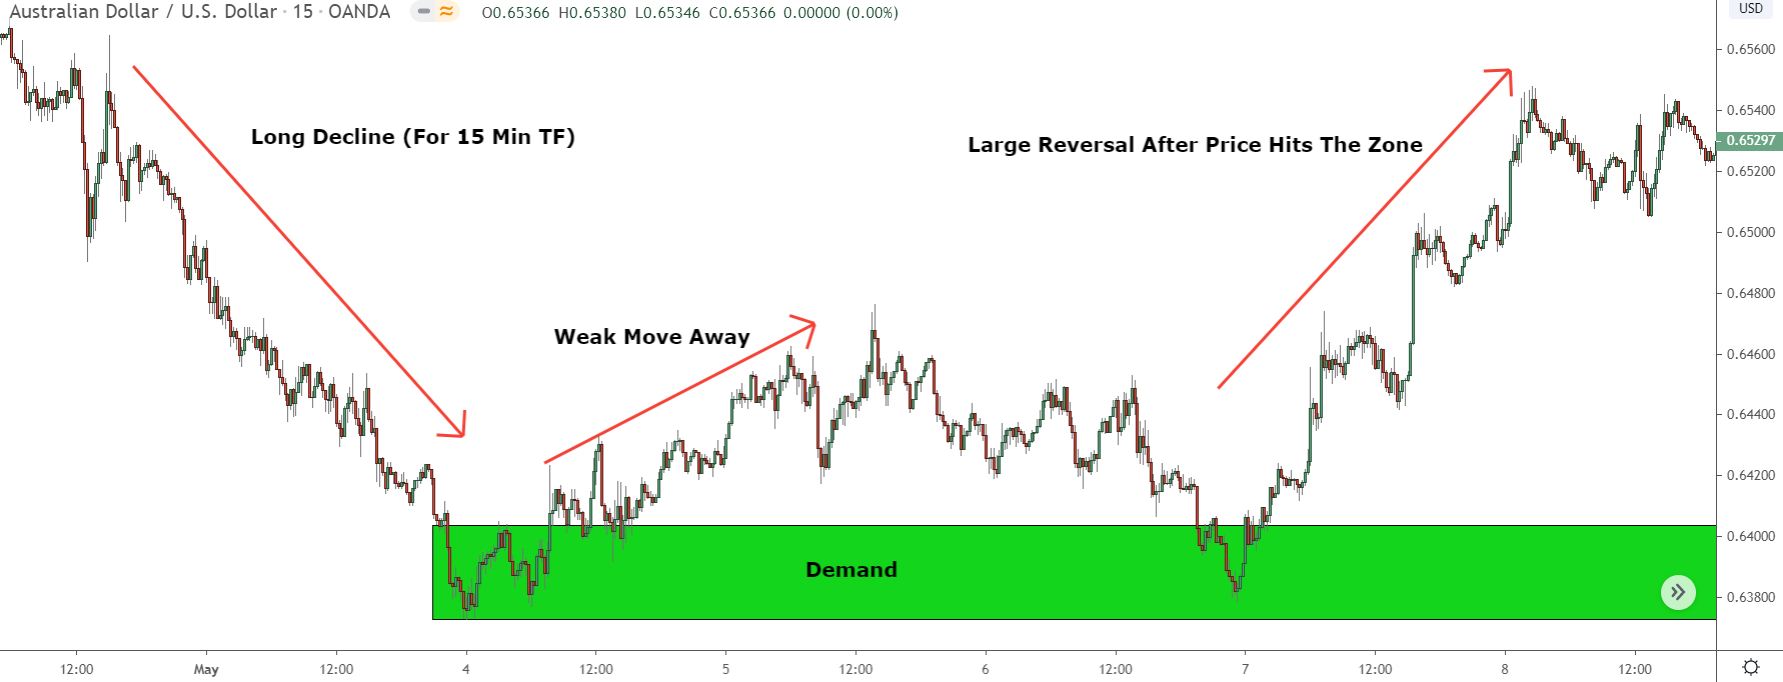
Without diving too deep (we don’t want to spend all day on this, do we?), when price rises or falls over a sustained period, more traders will place trades in the same direction.
Why, you ask?
It all boils down to the concept of ‘trend’.
Simply put: The longer price maintains a consistent overall direction, the higher the likelihood it’ll continue rather than reverse.
I’m sure you’ve come across this concept before.
Key Point: When I mention ‘trend’, I’m referring to any prolonged movement from one point to another – think of it like a ‘swing’. Even if a swing may not qualify as a trend on one timeframe, it’s still technically a trend on lower timeframes due to the duration of price moving in the same direction.
For the banks, this ‘trend’ is a big deal. Why?
Because it dictates the size of the trades they can place.
Remember, their trades are absolutley colossal, requiring masses of opposing orders (traders entering in the opposite direction) for successful execution. The bigger the banks trades, the more opposing traders/orders they require to execute themm.
So prolonged movements (or ‘trends’) afford banks the opportunity to place much larger trades, given the higher availability of opposing orders.
During a long downtrend, most traders are selling…
Hence, the banks can enter much bigger buy trades than during a small downmovement.
So, what does this mean for supply and demand zones?
It indicates zones which form after a substantial movement in the opposite direction (for instance, a demand zone after a lengthy decline) are generally stronger than those following a minor movement or movement in the same direction – like RBR/DBD zones, for instance.
After a prolonged movement, banks have a massive amount of orders available due to all the traders placing trades in the direction of the trend.
This allows them to place larger trades, creating stronger zones.
What about the ‘move away’?
Doesn’t have an impact on this, I’m afraid.
All it demonstrates is the sell orders (assuming the banks bought) got consumed rapidly, catapulting price higher. It doesn’t imply the banks executed a large trade, or they have a surplus of orders at the zone. Therefore, it doesn’t bear any weight on the probability of price reversing upon its return.
The Bottom Line
Sam Seiden provides a wealth of valuable insights into supply and demand trading… that’s indisputable.
However, the three facts we’ve dissected today miss the mark; it’s as simple as that. While they seem convincing and logical on the surface, they don’t align with the mechanics of the market or the modus operandi of the banks.

Grab Your FREE E-Book:
5 Pro Rules For Trading Supply And Demand
- Master the core principles of supply & demand.
- Advanced techniques for trading SD zones.
- Exclusive new lessons/books/tools every week!
Sign Up Now To Download Your FREE Guide:
🛡️ Spam-Free Promise: No spam, ever. We'll only send you relevant updates and content. Unsubscribe at any time.
Hi,
I find your explanation on the S&D very interesting and it was different from what i have learned. May i know are you still using this S&D to trade currently? Btw, is all course content updated and applicable to current trading environment? What other courses you are teaching other than current courses found on this website?
Regards,
Ben