
Question:
Hello.
I have had to try and email you direct as I was getting an error message from you website contact page.
Just want to say thank you so much for the information you are giving out – very interesting and informative.
Anyway. I signed up with you and am working my way through the information that you are providing, in a bit of a random order I must admit, and I am very intrigued. Have heard about the concept of Supply and Demand previously but never studied it in depth – I think I have missed a trick! Still – there is always time to catch up.
I have a few initial questions if you have the time.
Forgive me if the answer to these questions appear in articles that I have yet to read – just point me in their direction if so!
Your charts have Sell and Buy Zones showing – are they just the same as S&D zones but just with a ‘simplified’ name and do they respond to the same rules that you have laid out for S&D zones?
Have noticed that you have stretched them out over a much longer time period than that stipulated in your articles so wondered if they react somewhat differently to price.
Also have noticed that these zones are wider than what I would expect if following your rules – AU H1 timeframe Sell zones, for example, don’t seem to be marked from open of last bullish candle.
When dealing with the price action entry signals, Engulfing and Pinbars, should we only consider them if they close outside of the zone level, in the correct direction obviously?
Should we ignore any signals that are completed within the zones?
Should we take note of higher TF zones on lower TF’s or just trade each TF individually and just be aware of the higher TF zones?
I tend to trade on 4H TF as it suits my availability.
With regards to time period for re-test of a 4H TF zone, would you say that a week would be the maximum?
Do you have or are you intending to make any Youtube videos for your methods? I am more of a visual person and find my understanding improves when watching something being demonstrated.
I’ll finish there for now and hope you don’t mind me asking some questions later when I have read a few more of your articles.
I really appreciate your time and efforts.
Response:
Q1.
Let’s talk a little bit about “buy zones” and “sell zones.”
They’re essentially supply and demand zones with more than one touch. I used to note to myself, “Okay, this supply has been touched twice,” but then I realized it would be easier to just give them a different name.
This way, people could easily distinguish between the two.
Keep in mind: Not all supply and demand zones which have been touched multiple times are categorized as buy zones or sell zones.
Only zones where I predict banks are likely to be taking profits multiple times or placing multiple trades for market reversal are identified as buy or sell zones.
Q2.
When it comes to using price action signals for entering a trade at a supply or demand zone, they should ideally be located inside the zone or at its edge.
Generally, the signals which form inside the zone are more effective.
That’s because… when a pin bar or engulfing pattern forms after the market hits the edge of a zone, it can often be due to the banks taking profits from their trades. It’s not usually because they were placing trades to trigger a reversal from the zone.
Q3.
For time-frames, always remember to trade in-line with the trend on the timeframe you trade off.
Since you’re trading the 4-hour, it’s best to align your trades with the direction of the most recent higher high or lower low on the daily.
Also…
Don’t trade against higher timeframe zones.
When the market enters a daily supply or demand zone, don’t place any trades against that zone on the 4-hour.
The only exception is if you see a reversal structure forming inside the zone:
A reversal structure is when the market forms multiple swing lows (or highs if it had entered a daily supply zone) at similar prices. If you see something like this happening, it’s a sign the market may soon reverse, and you can trade the 4-hour zones which form against the daily zone the market is in.
As for how long it might take the market to return to a 4-hour supply or demand zone… it’s hard to say.
I’ve worked out the duration for zones on the 1-hour chart and daily chart, as those are the two time-frames I use most.
If I had to estimate, the maximum time price should revisit a 4-hour zone is around two weeks.
If the market returns to the zone slightly beyond this period—say, two weeks and a few days—that still counts within the time rules.
(Sorry, I can’t be more concrete).
Question
r/Madam
Let me thank you for taking time to prepare this levels.much appreciated.
Just recently bought your ebook( pin bars and how banks trade),I intend to learn more from you.
Quick question: Have you heard of Alfonso Moreno, he is the guy trading using Supply and demand levels.
He is not a former student of Sam Seiden’s OTA. He is available on forexfactory thread, http://www.forexfactory.com/showthread.php?t=428204 and he has a community of demand and supply traders called set & forget, http://www.set-and-forget.com/
I wish you could look at how he trades supply and demand levels( another perspective). He is into position and swing trading, but I try to use his methods for day trading, unfortunately I have mixed results.
Hope to hear from you soon.
Kind Regards
Response:
I’m well-versed in Alfonso’s supply and demand methodology and his thread on Forex Factory…
Here’s the problem with his approach: He uses pending orders to enter trades.
Pending orders can work for zone entry, but only when the zone has a strong chance of being successful…
Alfonso’s strategy for assessing a zone’s success probability, however, mirrors the principles taught by Sam Seiden. Namely: the stronger the move away from the zone, the higher the likelihood of a zone reversal.
Unfortunately, this isn’t the case, and along with a few other principals is one of the main factors which contribute significantly to the losses suffered by many supply and demand zone traders.
My suggestion to you is : STOP pending orders for zone entry.
Instead, wait for a significant engulfing candle to form inside the zone or after price touches the edge.
Remember, all reversals begin when one set of orders becomes bigger than the other, resulting in either an engulfing candle or pin bar forming. Seeing either of these signals, especially an engulf, form within a zone generally indicates a strong chance of a reversal.
My second piece of advice:
Stick to zones created at the point where an upswing turns into a downswing and vice versa.
Avoid zones which form in the middle of up or down swings (RBR/DBD Zones), as these often carry a low chance of success.
Take a look at the image for reference…
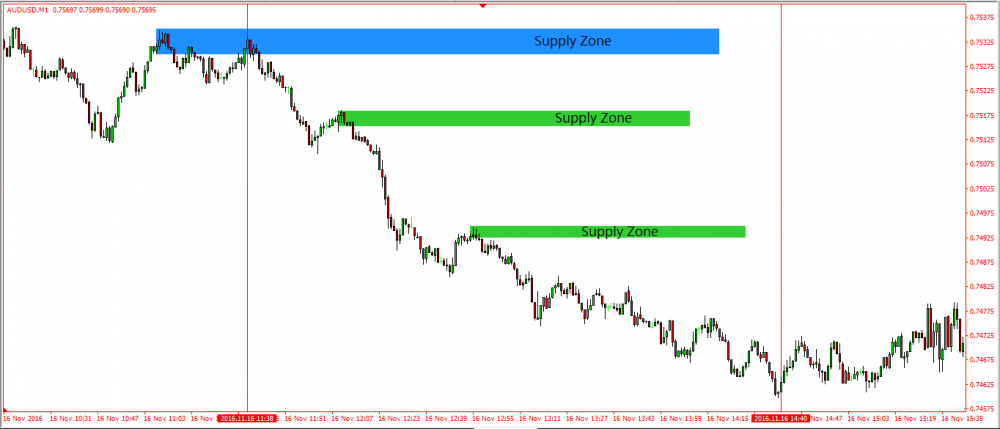
If you look at this downswing from the 1-minute chart, you’ll notice three supply zones have formed…
Paromania might argue the two zones I’ve marked in green are valid trading points and worth monitoring for short entries. However, these two green-marked zones did not form as a result of a substantial influx of sell trades by bank traders, as most traders were already selling by the time they formed; banks had few buyers to sell into.
So, the chance for the zones to trigger a significant reversal is low.
The supply zone marked in blue, on the other hand, has been formed by a heavy number of sell trades from the bank traders, suggesting a much higher reversal probability once the market returns – and provided it returns within the correct times.
Take a look at this upswing on the 1-minute chart…
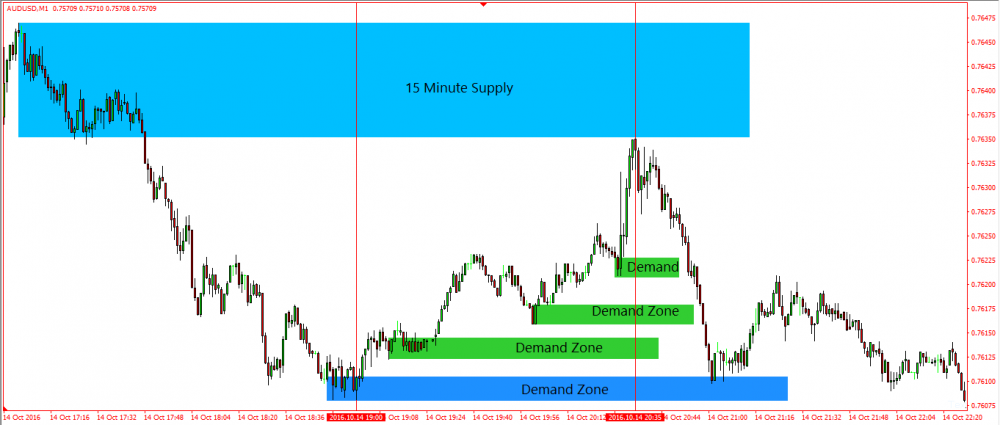
This upswing created four demand zones…
Three of these zones, marked in green, carry a relatively low probability of causing a significant reversal. Why? Because they weren’t created by the banks placing a significant amount of buy trades in the market.
But the story is different for the blue zone…
This zone, which appeared right at the point where the downswing halted and shifted into a new upswing, was created by the banks placing large buy trades or taking massive profits off open sell trades. We know this is the case due to the heavy selling before the zone formed.
As such, when the market revisits this area, there’s a strong chance we’ll see price reverse – which we do, but only for a short while in this case.
There’s another critical point I’d like you to notice…
See the point where the upswing — the one between the two red lines — comes to an end? This point marks the formation of a 15-minute supply zone. Given it’s formed right where an upswing morphed into a downswing, it’s a considered a higher probability zone…
The banks had to enter significant sell trades to make price reverse here.
Give this approach a try, see if it boosts your trading success rate…
If you’re struggling with entering trades using engulfing candles, don’t worry.
You can always switch back to using pending orders…
Just remember: focus on trading the zones created at the major swing points — where an upswing flips into a downswing and vice versa. These zones (RBD/DBR) result in profitable trades far more frequently than zones created mid-swing.
Happy trading…
PAN.
Thank you very much fot the info!