
If I said there was a way to double your profit without changing strategy or using any special indicators or techniques, would you believe me?
Probably not, right?
But there is in fact a very simple way to double and in some cases even triple the amount of profit you make on a trade using NO indicators, NO new strategies, and NO special techniques.
Want to learn what it is?
Then read on…
The Chart Type Nobody Uses
When you think of all the different ways available to double profits on a trade, what comes to mind?
A new trading strategy?
An unconventional technique?
A special indicator perhaps?
These are things that usually come to mind, but one that people completely miss is by using a certain type of price chart.
Wait, what?
There’s a type of price chart that if used in the right way will double the amount of profit you make on a trade.
Its name…
The heiken ashi chart!
Now I know what you’re thinking…
“That looks just like a candlestick chart”.
And, yes, with it’s blue and red candlesticks the heiken ashi does look like a candle chart. However, it differs in one really important way…
The price.
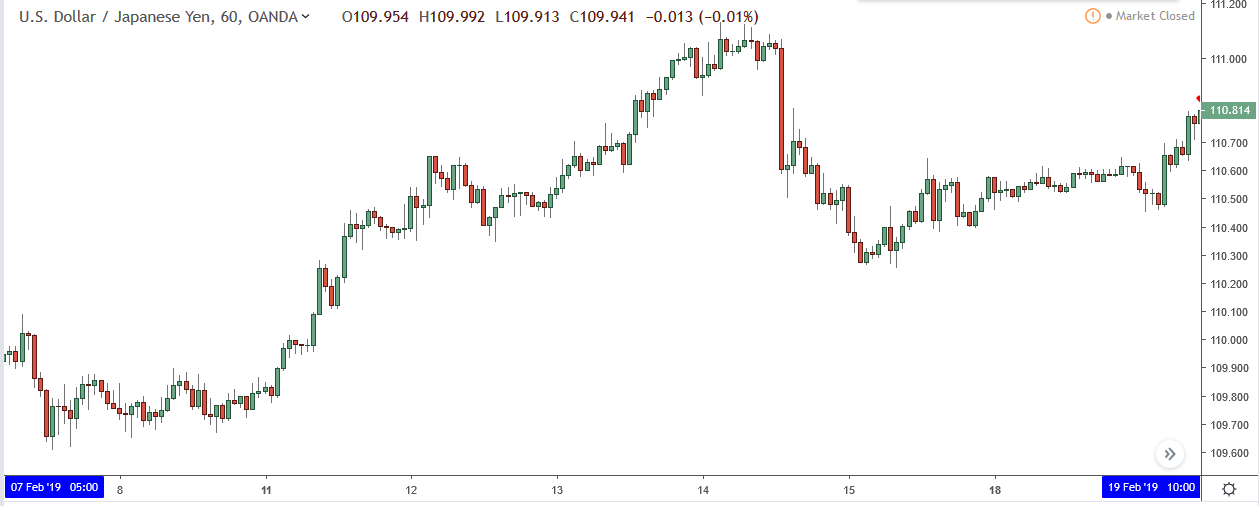
Unlike a candlestick chart (and most other charts actually), the heiken ashi shows how the AVERAGE price is changing.
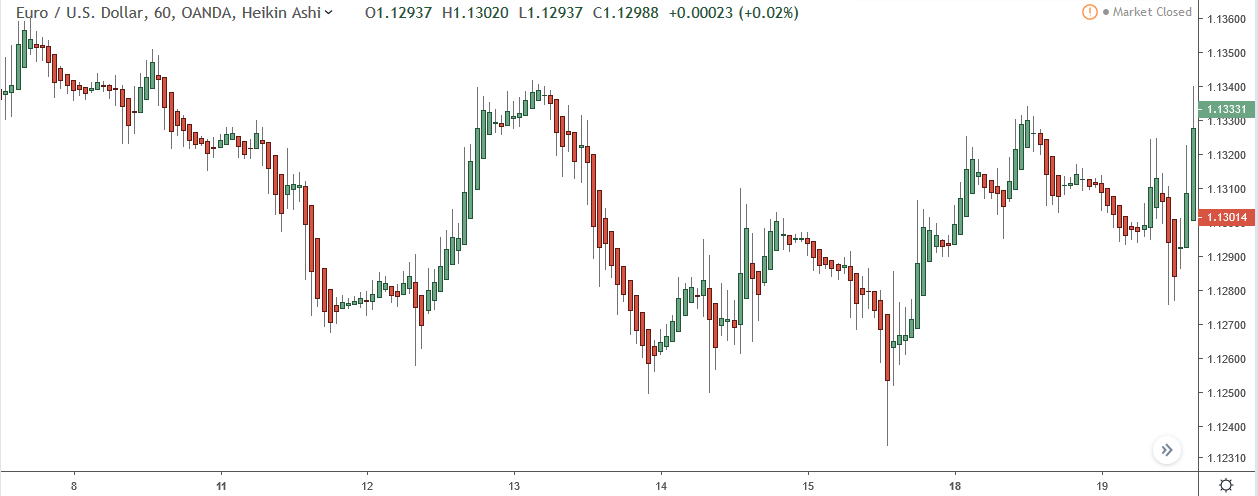
This gives it a much smoother look than the candlestick chart…
And here’s the same bit of action but seen through the heiken ashi…
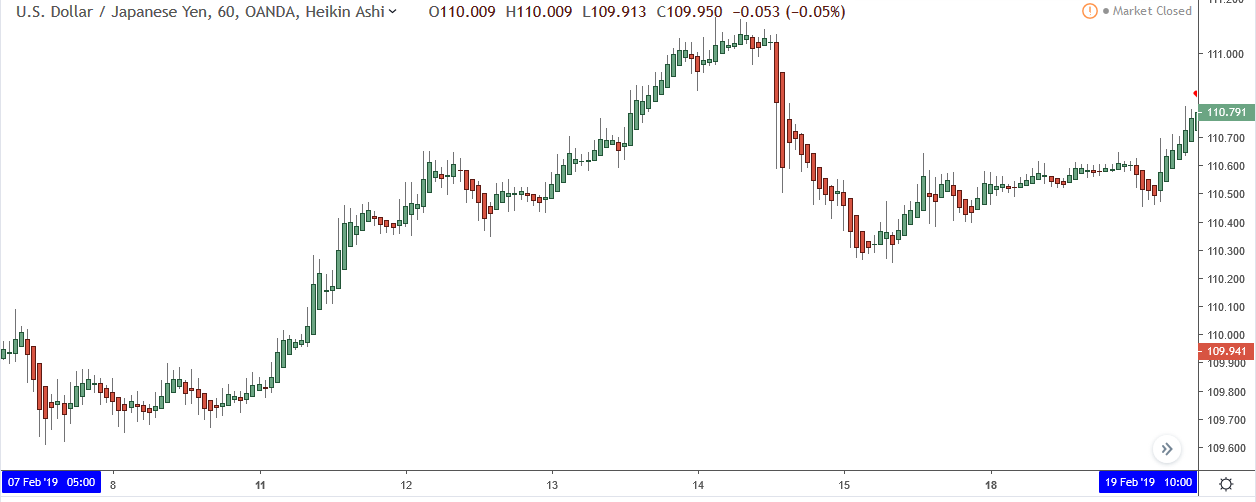 Notice how much smother the heiken ashi is?
Many of the rises/declines seen on the candlestick are much more pronounced than on the heiken ashi; the rises consists of more bullish candlestick and the decline show more bearish candles.
This is because the heiken ashi is showing how the average price.
On average, the price didn’t actually fall/rise that much during many of the rises and rise declines, which is why you see fewer bearish candles during rises and less bullish candles on the declines.
So, that’s the heiken ashi chart.
I guess your questions now is…
“How do I use it to double my profit”?
Lets find out…
Double Your Profit With The Heikin Ashi
How many times have you closed a trade too early because of a small drop or as a result of a candlestick pattern forming that you thought signaled a reversal and missed out on a TON of profit?
Many times, I bet.
Well, when you use the heiken ashi chart as an exit strategy, you can stay in a trade for much longer than normal, and you know what that means…
You make A LOT more profit.
But what do I mean by using the heiken ashi as an ‘exit strategy’?
In simple terms, I mean instead of closing a trade using some sort of rule or condition governed by your trading strategy, you instead close it when the heiken ashi indicates the price is likely to move in the opposite direction i.e when 4 red candlesticks form one after the other.
4 red candles forming in a row usually indicates the price is going to fall for while.
By only closing upon seeing this, you can stay in the trade for a lot longer than normal and double your profits.
Easy.
Now let me show you an example of how well this works…
Imagine you bought on the bullish hammer candlestick marked above.
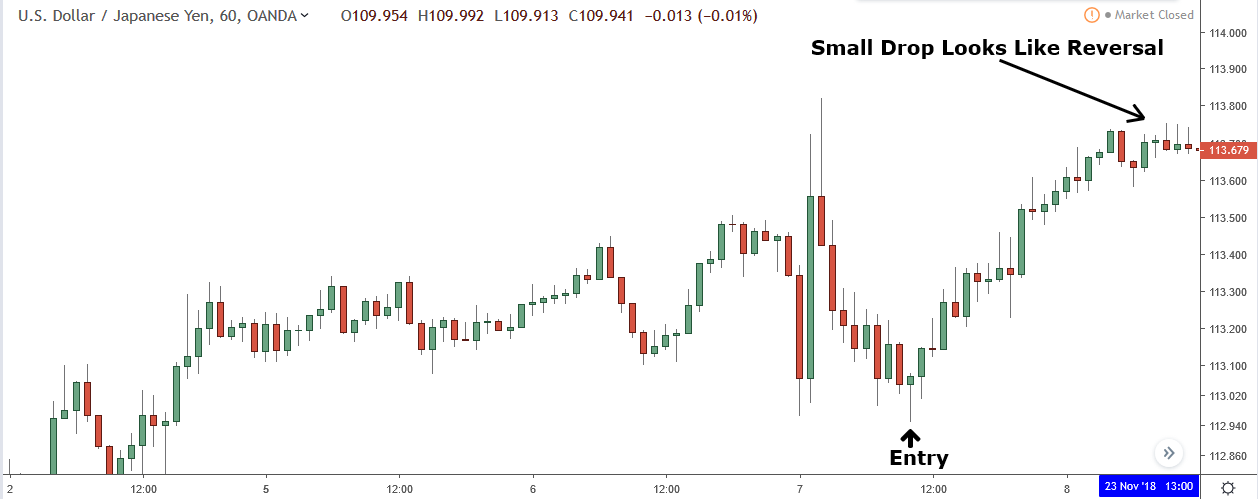
After a pretty decent rise, the price falls slightly, causing you to think a much larger reversal is about to take place.
You decide to close the trade to make a profit and miss the reversal.
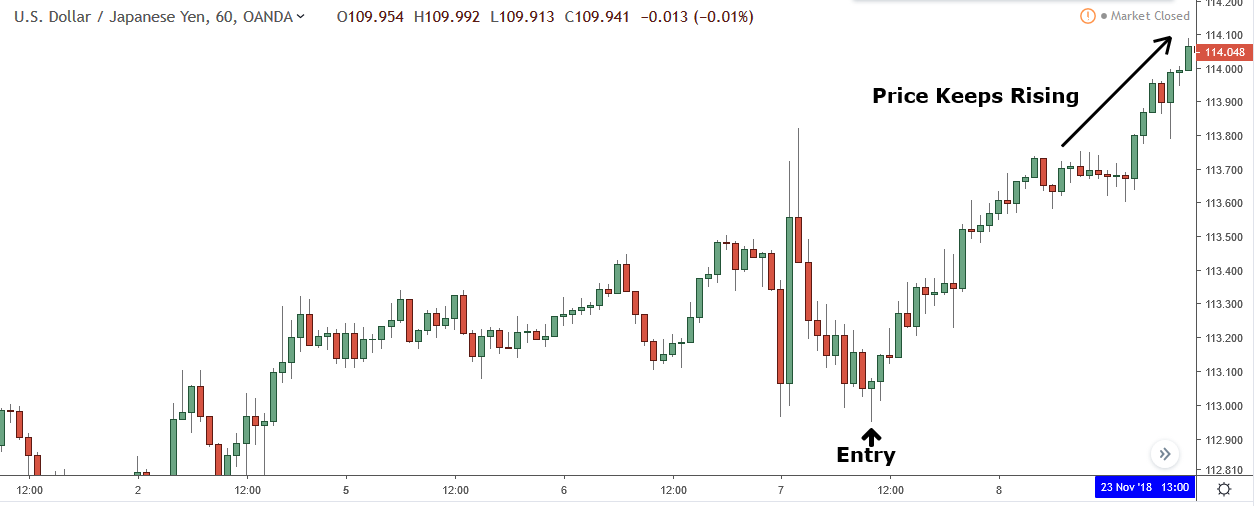
But the reversal never manifests, and the price instead starts rising again.
You watch helplessly as the price then takes off and smashes through your profit target.
Not fun.
Now let’s look at how this would’ve played out using the heiken ashi as your signal to exit.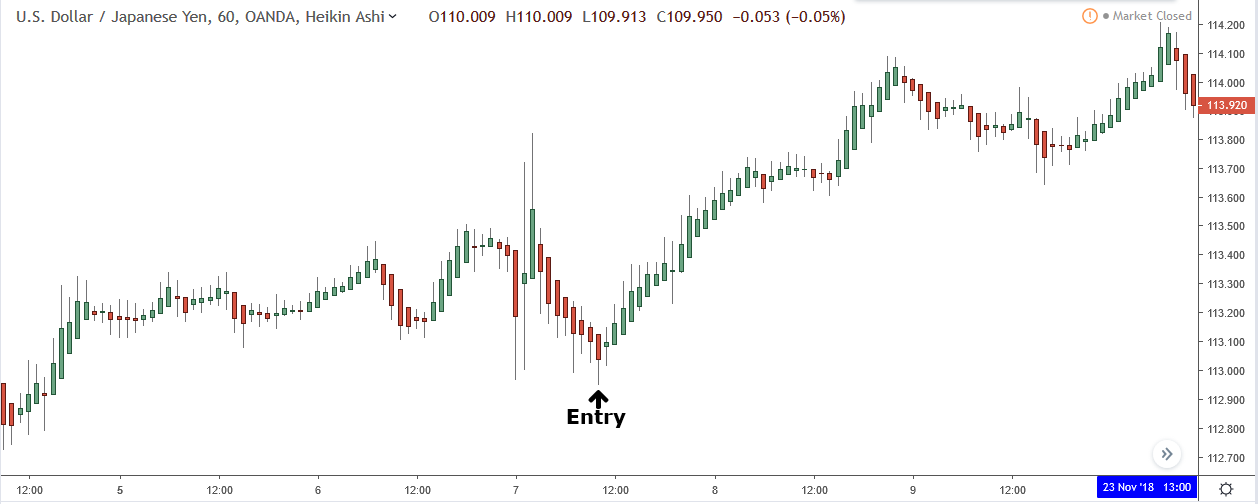
So again, you enter the trade on the hammer and wait for the price to rise.
Note: You always enter trades using the candlestick chart. Don’t look for hammers or other patterns using the heiken ashi, use the candlestick instead.

Like before, this price rises. However, this time, because of the heiken ashi, the bearish candles that caused you to close remain bullish.
As a result, you stay in the trade.
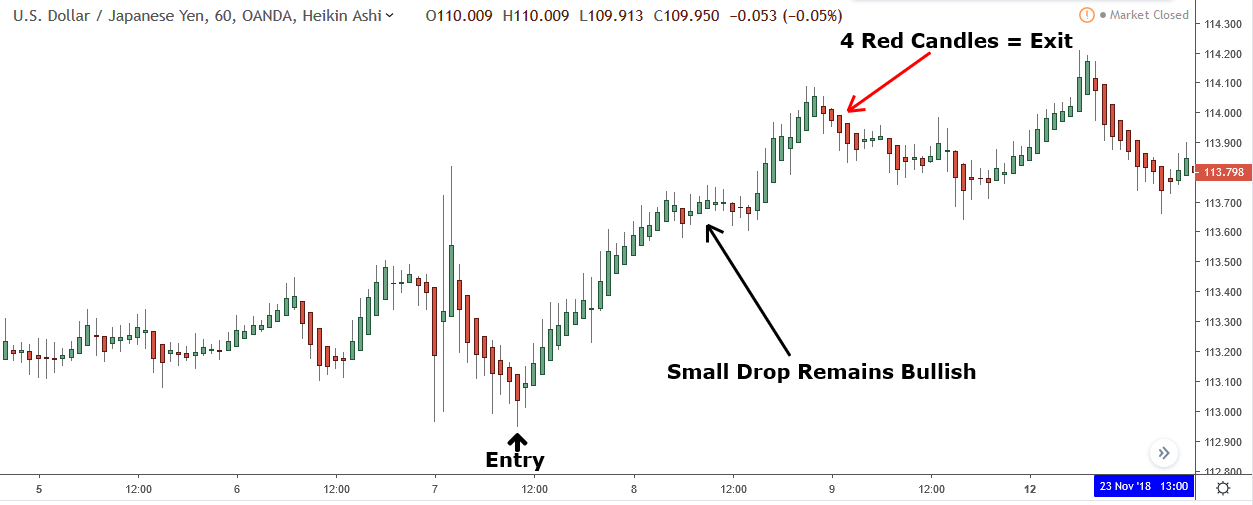
The price continues to rise for another 60 pips, at which point 4 red heikin ashi candlesticks form in a row, giving you a signal to close the trade.
So the heikin ashi allowed you to stay in the trade for another 60 pips, more than doubling the profit you would’ve made not using it.
Summary
It might not be the most obvious way to double profits and it may not work all of the time (sometimes 4 red candles appear and the price doesn’t fall), but the heikin ashi is definitely one of the most effective ways to increase profits, and I recommend using it whether you’re a beginner or experienced trader.