
There’s no doubt about it: The best way to determine the trend is by using higher highs and lower lows.
This method has been around for decades, and for good reason… It allows us to quickly and easily determine what the current trend is as well as when it might be changing. I’ve used it since I started trading as I’m sure you have too.
But have you noticed how it sometimes doesn’t work?
How price will make a higher high or lower low (signaling a trend reversal) but rather than reverse, turn and continue moving in the direction of the trend?
Many traders pass this off as just being part of the method, but it actually happens for a reason.
In this post, I’m going to explain what this reason is and also how you can use it to determine whether a higher high/lower low really signals a reversal.
Why A Higher High/Lower Low Doesn’t Always Signal A Reversal
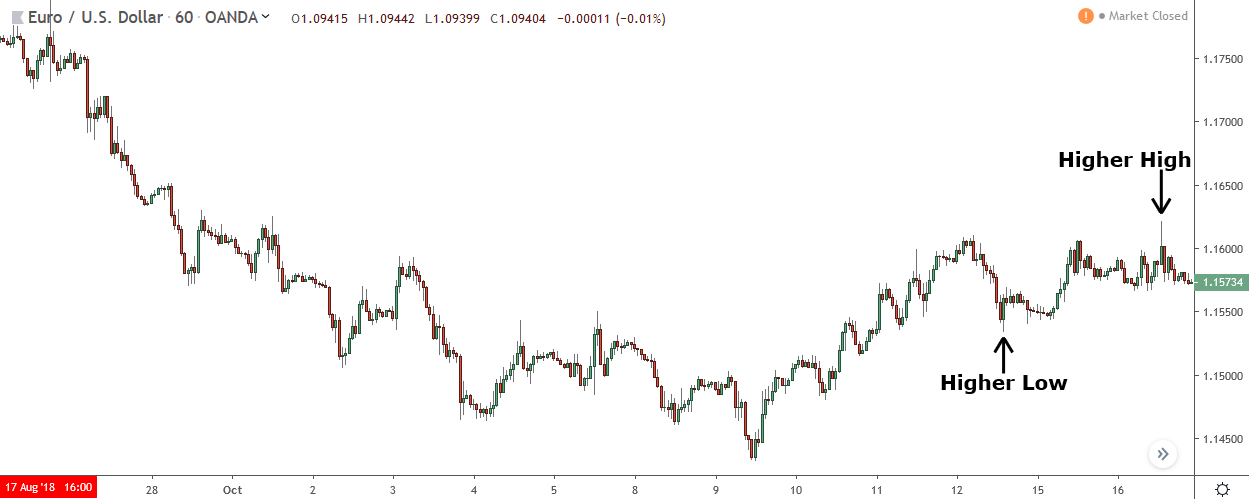
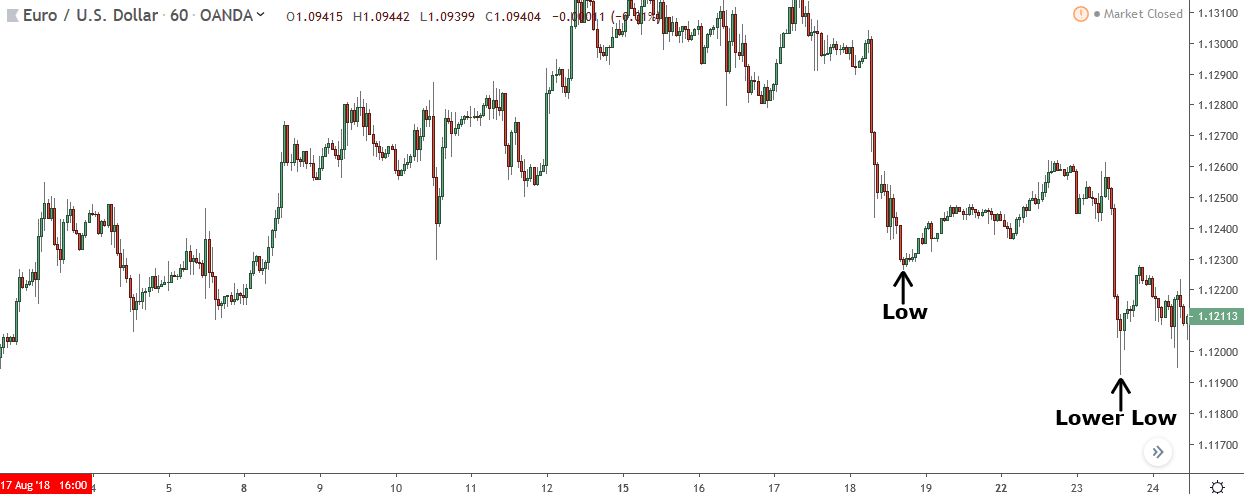
Eur/Usd has just made a higher high after previously making a higher low. According to the Dow Theory, this indicates a trend change, because it shows people are willing to pay more than the highest price they were previously confirmation with paying.
But look at what happens next…
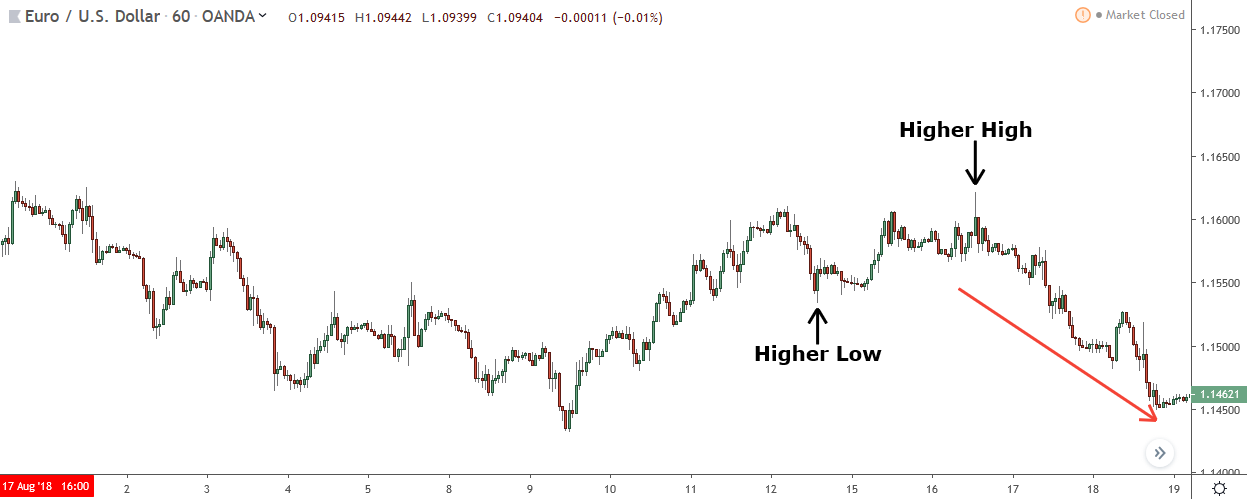
Price falls and breaks through the higher low, signaling the trend hasn’t changed and is now likely to resume.
So what’s going on here?
Why didn’t the trend change?
The answer is because the high was false…
It wasn’t created because traders were willing to pay higher prices (like the Dow Theory states) but as a result of the banks placing sell trades. Them placing trades is what caused the high to form, and the price to then reverse and start falling.
But how do I know this?
It comes down to how the banks place their trades and take profits…
All swing lows and highs form from the banks and other big players either placing trades or taking profits.
When the banks place trades or take profits, they never have enough orders to do so at one price. They have to manipulate the market to get people to buy or sell so they can place their remaining trades or take the rest of their profits off.
This is something I’ve talked about a lot this site.
But here’s the really important thing to understand…
When they place their remaining trades/take their profits, they do so at a similar price to where they initially placed trades/took profits. They do this because it replicates the effect of having all their trades placed/profits taken at a single price, which is what they do if they had enough orders available.
Now if we look again at the high in the example…
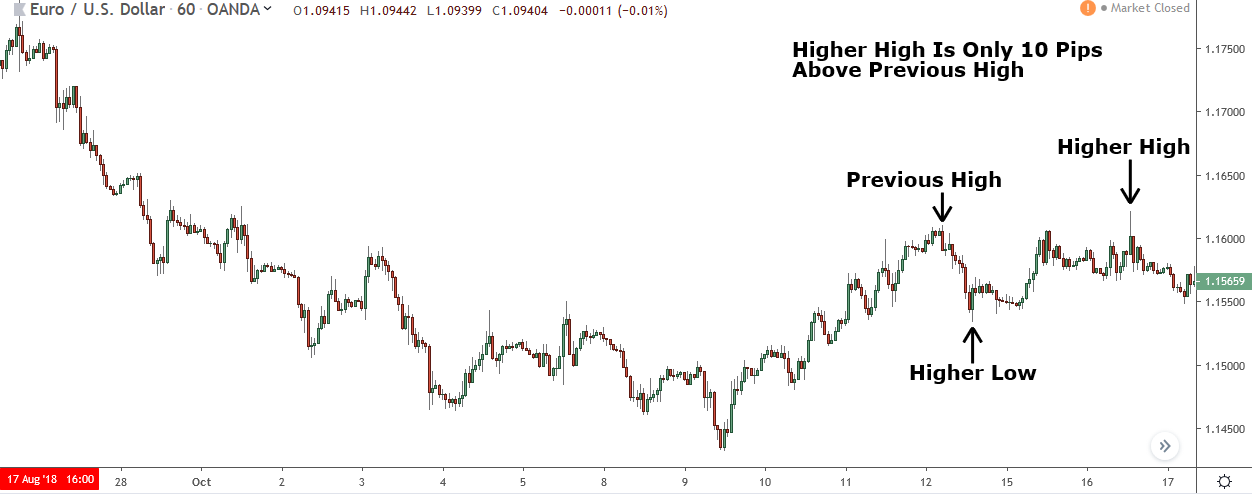
You can see the higher high forms at a very similar price to the previous high.
What does this mean?
It means its probably formed from the banks either placing trades or taking profits, so has a low chance of signaling a trend reversal. It doesn’t mean a trend reversal won’t happen, because nothing’s 100% in trading, but it does make it very unlikely.
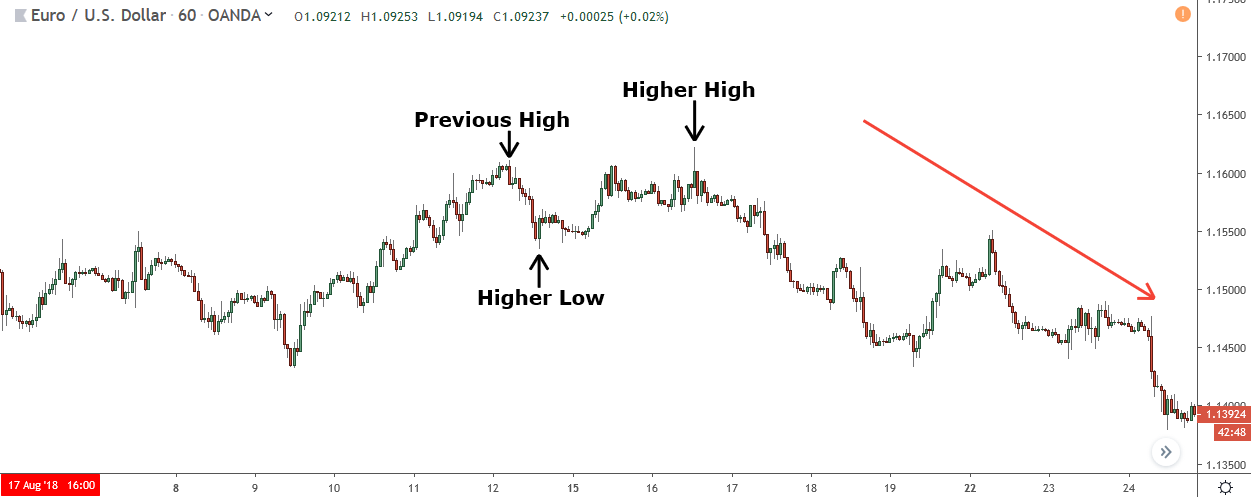
I skip it forward a few hours, you can see price continues to fall not long after the higher high is made.
So that’s why higher highs and lower lows sometimes don’t cause a reversal.
It’s not random like some people say, it’s because of how the banks get their trades placed or take profits off when they haven’t had enough orders to do so at one price.
How To Tell If A Higher High Or Lower Low Actually Signals A Reversal
I have a very simple way to determine if a higher high or lower low actually signals a reversal. You don’t need any technical indicators or any special know-how to use it, aside from how the banks operate, which I just explained in the previous section.
The method is based off how the banks take profits and place trades.
Because of how the market works, the banks often never have enough orders to get all their trades placed/profits taken at one price. They have to manipulate the market and then place them at different prices when enough orders are available.
But where they do place their additional trades/take more profits?
At a similar price to where their initial traders were placed or profits taken!
So the way to determine if a higher high or lower low actually signals a reversal is by looking at how far the higher high or lower low has broken the previous high or low.
If it’s broken it by a large distance, it’s likely indicating a reversal, because the banks always place their trades/take profits at similar prices. If it’s only just managed to break it, it’s probably formed as a result of the banks placing trades or taking profits, so isn’t a reversal.
Obviously this a bit ambiguous, so let me give you some examples…
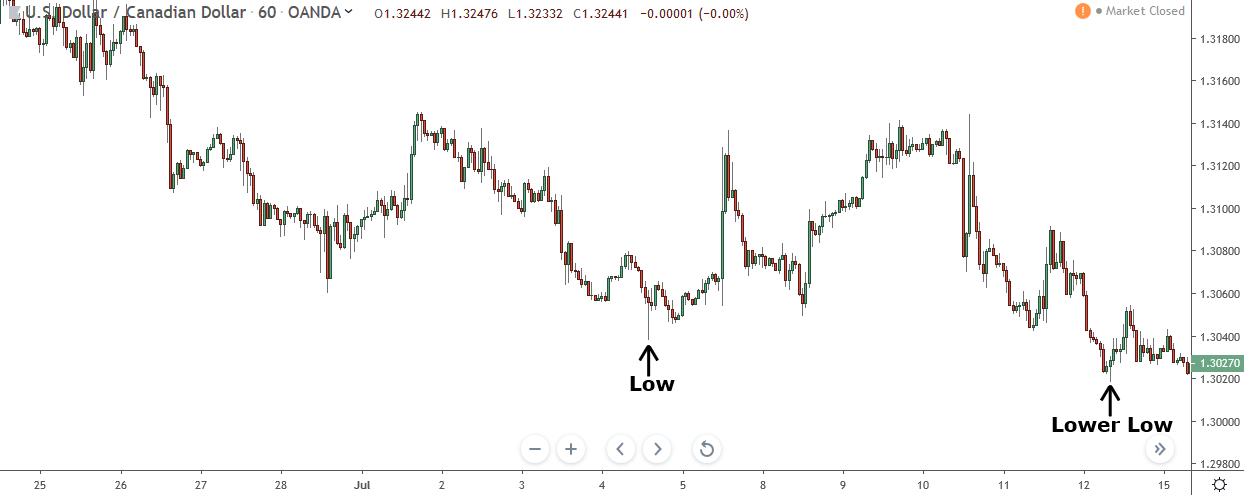
Here’s what I mean by a large distance.
This lower low has clearly broken the previous high by quite a ways. It hasn’t just peaked above and then fallen, like we’ve seen in the other examples, it’s broken through and pushed price far below.
And this is what I mean by a small distance.
This lower low has only just spiked below the previous low, causing it to form at a very similar price. These are the types of higher highs/lower lows that don’t signal a reversal. They form from the banks, and always at a similar price to previous high or low.
Example
I want to make sure you get how to determine whether a higher high or lower low really signals a reversal or continuation, so here’s a quick run through of what you need to do from beginning to end.
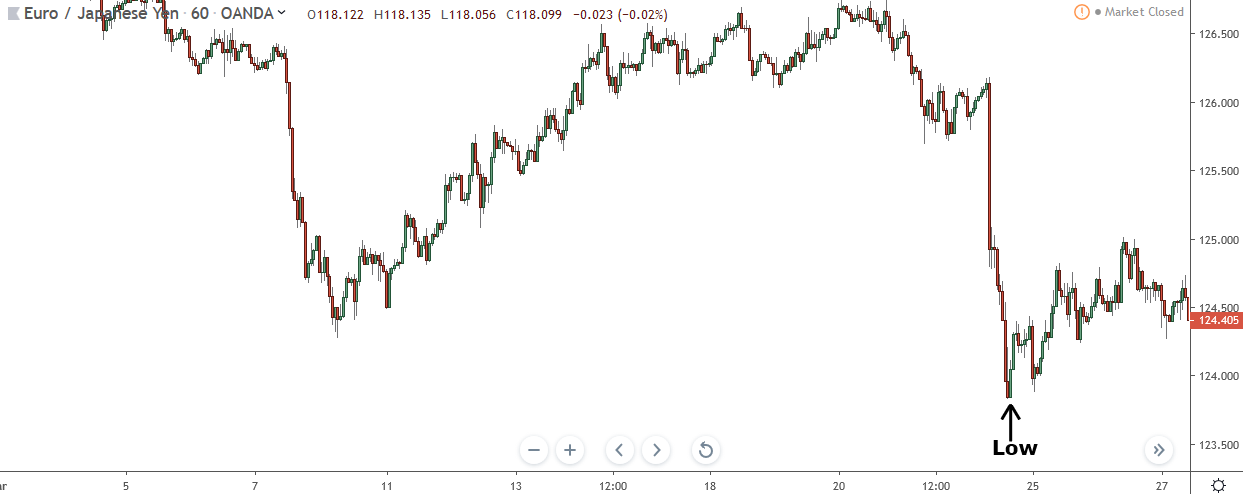
So, Eur/Jpy has just formed a lower low.
This low has been created by the banks buying. At the time, you didn’t know this. But you did know it had formed from them either buying or taking profits off sell trades, as that’s what causes every swing low in the market to form.
Now if the banks haven’t been able to take place all their trades, they’ll make price come back to this low and then buy again, possibly causing another lower low to form.
The key point to remember is this low will only be a small distance below the previous low. It won’t be far away because the banks want to get the rest of their buy trades placed at a similar price, to replicate the effect of having them all placed at one price.
To get price to come back to the low the banks take some profits off the buy trades.
Taking profits consumes all the buy orders from people buying because of the rise. That causes price to start falling, which in turn, makes people sell since it looks like a continuation of the current downtrend.
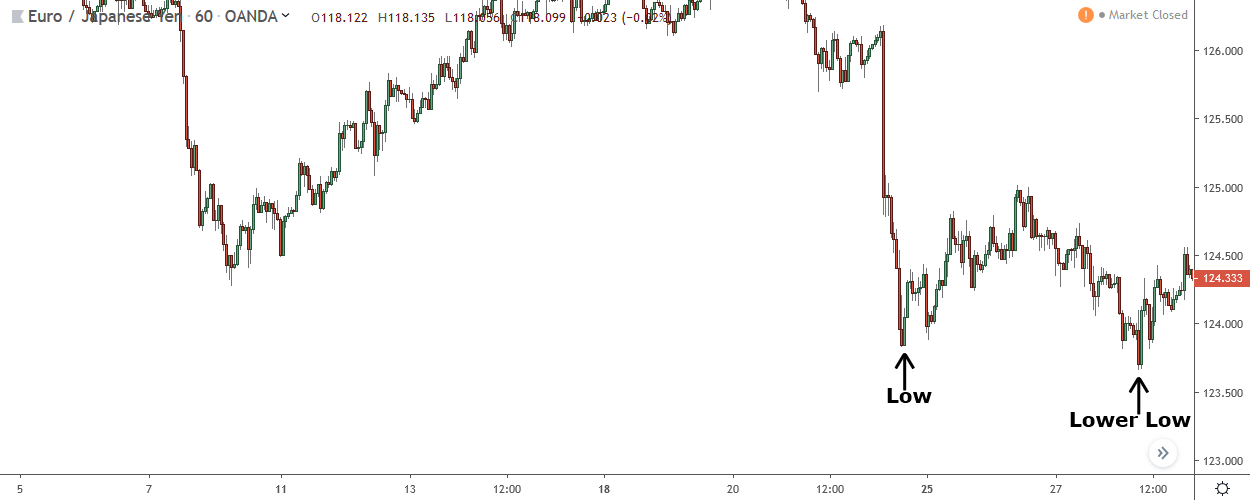
When price reaches the low it spikes through before falling, creating a new lower low.
As far as the Dow Theory is concerned, this trend is now about to continue. The lower low combined with the low seen earlier confirms the trend is probably still in play.
But you know better.
You know the low being at a similar price makes it likely to have formed from the banks selling, which means it probably isn’t indicating a reversal.
And look what happens a few hours later…
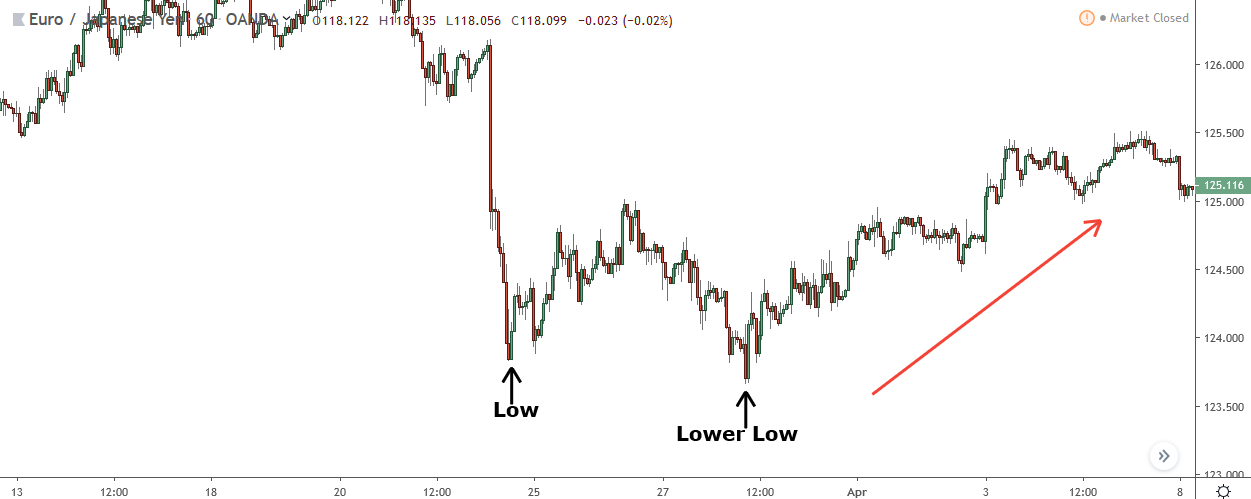
Price rises massively causing a reversal and confirming the banks have actually placed buy trades.
So by knowing this low had probably formed from the banks buying due to it’s proximity in price to the previous low, you knew it had a low chance of signaling a continuation. It didn’t mean a continuation wouldn’t happen, because you can never be certain of anything in trading, but it did make it far more unlikely.
The Bottom Line
I know this method is a little on the ambiguous side, but it does work well once you get an idea of how far price should break the previous high or low. It’s best to go back and look at some higher highs/lower lows that have failed.
Most of the lows/highs that fail do so because price only spikes above below them, so if you have a good idea of what that looks like it should make using the method a little less ambiguous.
There is no picture, are u update it?