How many times have you heard that support and resistance levels need to have multiple touches and that the more touches a level has the better chance it has of causing a reversal?
These two rules form the bedrock of trading support and resistance.
They tell you how to find the levels on the chart and how to determine whether they have a high probability of causing a reversal. But you know what’s funny about these rules?
As sound as they seem, they don’t make any sense.
Support and resistance levels DON’T require multiple touches. And they DON’T get stronger with each subsequent touch.
There are two reasons why this is, and they both come down to how and why support and resistance levels form.
Today, I’m going to explain what these two reasons are, so you can understand why the normal way of trading S & R doesn’t work. I’m also going to show you a couple of new ways to find S & R that’ll make it easier for you to locate high probability levels.
Lets take a look…
- The Problem With Support And Resistance Levels
- Who Causes Price To Reverse From Support And Resistance Levels?
- How To Use This In Your Trading
- 1. Watch Levels With Recent Touches For Near Term Reversals
- 2. Unbroken Levels Have A High Probability Of Causing Reversals
- 3. Draw SR Levels As Zones Instead Of Lines
- Summary
The Problem With Support And Resistance Levels
As many of you know, the concept of support and resistance is based on a very simple (but very flawed) idea of how traders behave in the market. This idea explains how the levels form, why they require multiple touches, and most importantly, why they get stronger each time price reverses from them.
The idea is as follows:
If lots of traders buy or sell from a price, they’re highly likely to buy or sell from the same price in the future, resulting in a reversal; the more times traders buy or sell from the same price, the higher the probability the market will reverse from that price when it returns.
This is why you get told levels get stronger with more touches.
Now to the average trader, this makes perfect sense; open a chart, and you’ll see levels with lots of touches cause reversals all the time. However, there are two big problems concerning how the levels form and why they supposedly get stronger with multiple touches.
Let’s take a look at the first.
Who Causes Price To Reverse From Support And Resistance Levels?
Have you ever wondered who causes price to reverse from support and resistance levels? Scratch that, have you ever even thought about it?
Chances are you haven’t, and there’s a reason for that.
Most price action sites that teach people how to trade S & R say price reverses from the levels because of retail traders, people like you and me who trade forex non-professionally.
According to them, retail traders create the levels because they believe in the concept of support and resistance, making it a self-fulfilling concept. In other words, because so many people believe S & R exists, that in itself creates the levels and causes people to buy or sell once price returns.
You’ve probably heard this said at some point yourself?
It is true many retail traders buy or sell when price returns to an S & R level, but they don’t cause price to reverse. They can’t because they don’t have enough volume (money).
It takes tens of millions to make price to move just a few pips in forex, let alone a cause a reversal. Retail traders don’t have anywhere near that amount. Even they all worked together and co-ordinated their buying and selling, which they could never do, they still wouldn’t have enough. It’s crazy to think otherwise.
Retail traders don’t cause price to reverse from the levels, that we now know. But this begs the question, who does cause price to reverse from the levels?
Well, there can only be one culprit – I bet a few of you already know what’s coming.
The traders who really cause price to reverse from support and resistance levels are the same traders behind most other reversals and events in the market:
The bank traders.
The banks cause price to reverse from support and resistance levels. Only they have the money and resources required to make price reverse. Normally it’s from placing trades, but sometimes it’s from closing trades and taking profits too.
It depends on the situation and what’s happening at that time.
There’s a good reason why the banks cause price to reverse from support and resistance levels, and it’s linked in with why the levels don’t get stronger with multiple touches.
Why Levels Don’t Get Stronger With Multiple Touches
Thinking retail traders cause price to reverse from S & R levels is a problem, but it’s not something that causes you to lose a lot of money. What does cause you to lose money, though, is the other rule with S & R, believing the levels get stronger the more times price touches them.
For a long time, I followed these rules myself, religiously.
I still remember noting down how many times price had touched a level in my journal, and then comparing that with other levels, to see which had the highest chance of causing a reversal. I’d often go back years to look at the touches too, just to see which had the most.
The idea that levels get stronger with more touches, which isn’t true by the way, stems from the fact the levels supposedly form from retail traders buying and selling.
Remember when I talked about this earlier?
The books, guru’s, videos, etc say that because retail traders cause the levels to form, they also make them stronger each time price reverses from them.
Their logic behind this is simple:
Since most traders believe support and resistance levels get stronger with more touches, that in itself causes the levels to get stronger.
So in essence, because traders believe S & R levels get stronger with multiple touches, that actually causes them to get stronger since it makes them trade levels with lots of touches.
Does that make sense?
Whether you understand what I explained above or not, the point is it’s not true. And the reason why is down to what causes price to reverse from the levels in the first place.
Like I said earlier, price reverses from support and resistance levels not because of retail traders like most of the guru’s and books say, but because of bank traders. They decide to place trades, close trades or take profits when price reaches a level and that’s what causes it to reverse.
Obviously, the banks don’t decide to buy and sell because of some line price has touched a few times on a chart, that’s not how they make decisions.
The only thing they care about is orders.
They need orders coming into the market to be able to buy or sell. If enough orders are coming in from other traders buying or selling, the banks may decide to do something with them; could be take profits, place trades, close trades, or whatever. But they need orders, that’s the key.
If they haven’t got any orders available or not enough are coming in for what they want to do, they can’t take an action, whatever it may be.
If you’ve read my book, this should sound pretty familiar.
Retail traders don’t buy and sell everywhere, at least not large quantities. So the banks can’t buy or sell whenever/wherever they want. Instead, they have to push price to points where they know lots of orders have built up and then use them to place trades, close trades, or take profits.
And what’s one of the key places lots of orders build up?
Yep, you guessed it, support and resistance levels!
Because they generate so much interest, a huge amount of orders build up on and around support and resistance levels. This makes them a prime location for the banks to push price whenever they want to buy or sell.
It happens like this:
The bank spot that a large number of orders have built up around a level, and decide to push price to it so they can place trades or take profits, depending on what they want to do.
Using a variety of market makers and other sources, the banks push price to the level. They then, depending on where the orders are, make price chop around – I’m sure you’ve seen this before – to trigger all the orders and get their trades placed/profits taken, before causing price to reverse.
And that’s why levels don’t get stronger with more touches.
The banks, who cause price to reverse from the levels, only care about the amount of orders coming in and what they can do with them. How many touches a level has or where it’s formed isn’t important, it doesn’t have anything to do with how they place trades or make decisions.
With that out of the way, lets look at how this can help you in your trading.
How To Use This In Your Trading
We’ve dispelled the myth that S & R levels get stronger with more touches, and that price reverses from the levels because of retail traders buying or selling.
You can now go off and trade the levels in a much better way, right?
….not quite.
See, while knowing the levels don’t get stronger with more touches is important, it leaves us in a bit of hole.
How do we now find out if a level has a high probability of causing a reversal or not?
Before, we would look at how many touches a level had, but we now know that doesn’t work, so we can’t use it anymore. We have to find a different way to determine whether a level has a high chance of causing a reversal.
Luckily, there are still a couple of ways to find good levels, both of which I’ll explain here.
Let’s take look at the first…
1. Watch Levels With Recent Touches For Near Term Reversals
Support and resistance levels don’t get stronger with multiple touches, as we now know. However, levels with recent touches (at least two), are strong levels that have a high probability of causing price to reverse.
Levels with recent touches work well for two reasons:
1. It shows the banks are currently interested in the levels – hence the recent touches.
2. They reveal that lots of retail traders are placing trades at the level.
We know that if lots of retail traders are placing trades at a level, the banks will want to use the orders to get their own trades placed or to take profits off (or close trades too, in some cases). We also know if price has reversed from a level recently, the banks must be using it, as only they can cause price to reverse.
So together, these tell us levels with recent touches have a high probability of causing price to reverse. And if you look at a chart, you’ll see this is true most of the time.
Take this level, for example…
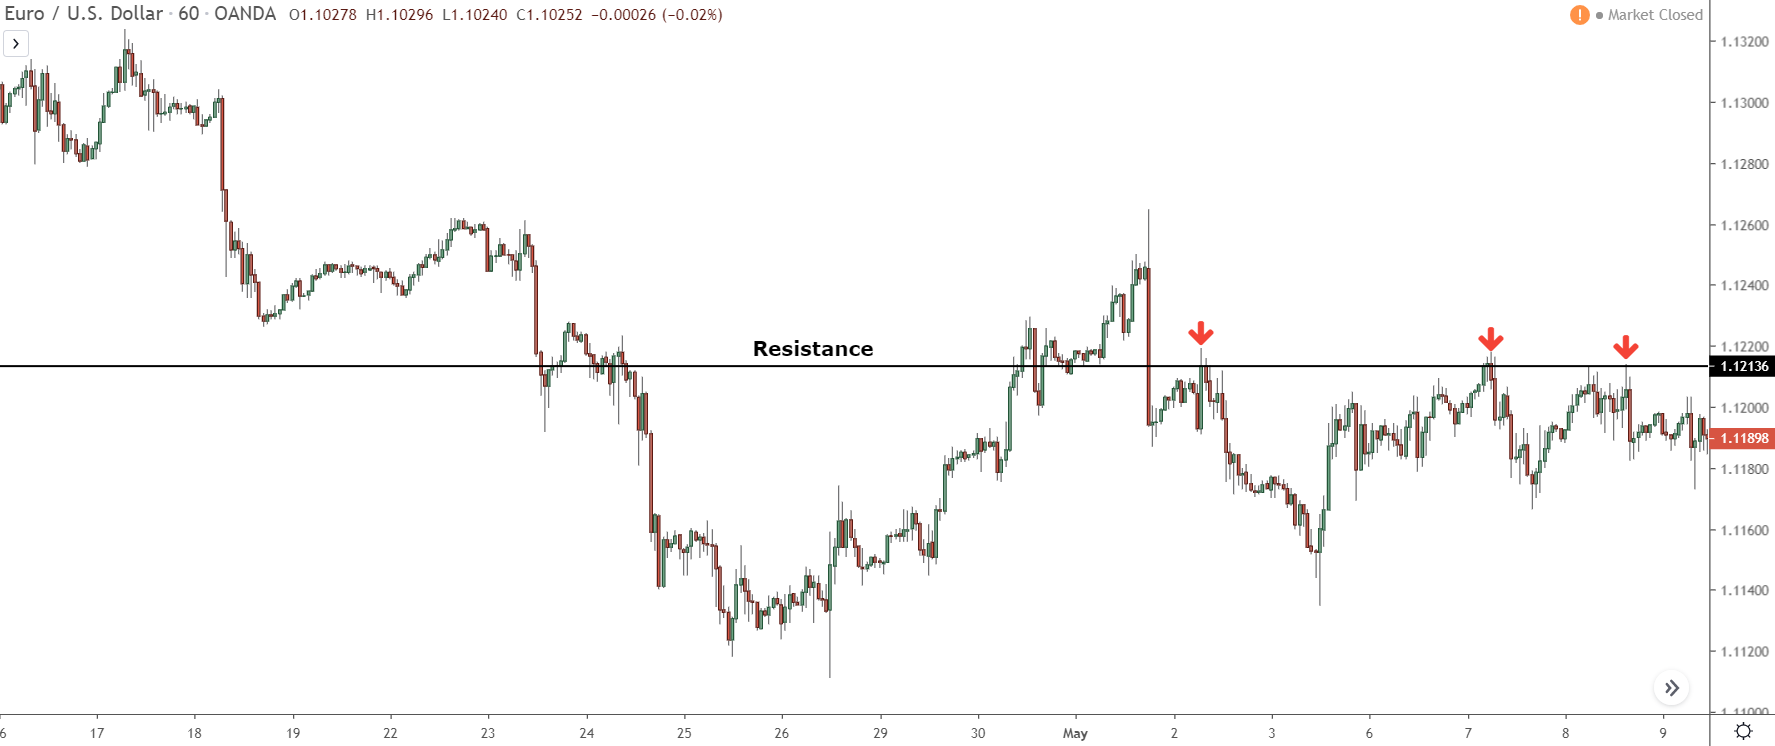
Price has touched this resistance level 3 times over the last couple of days, each of which has resulted in a reversal, telling us the banks must have used the level for some purpose.
Watch what happens over the next few days.
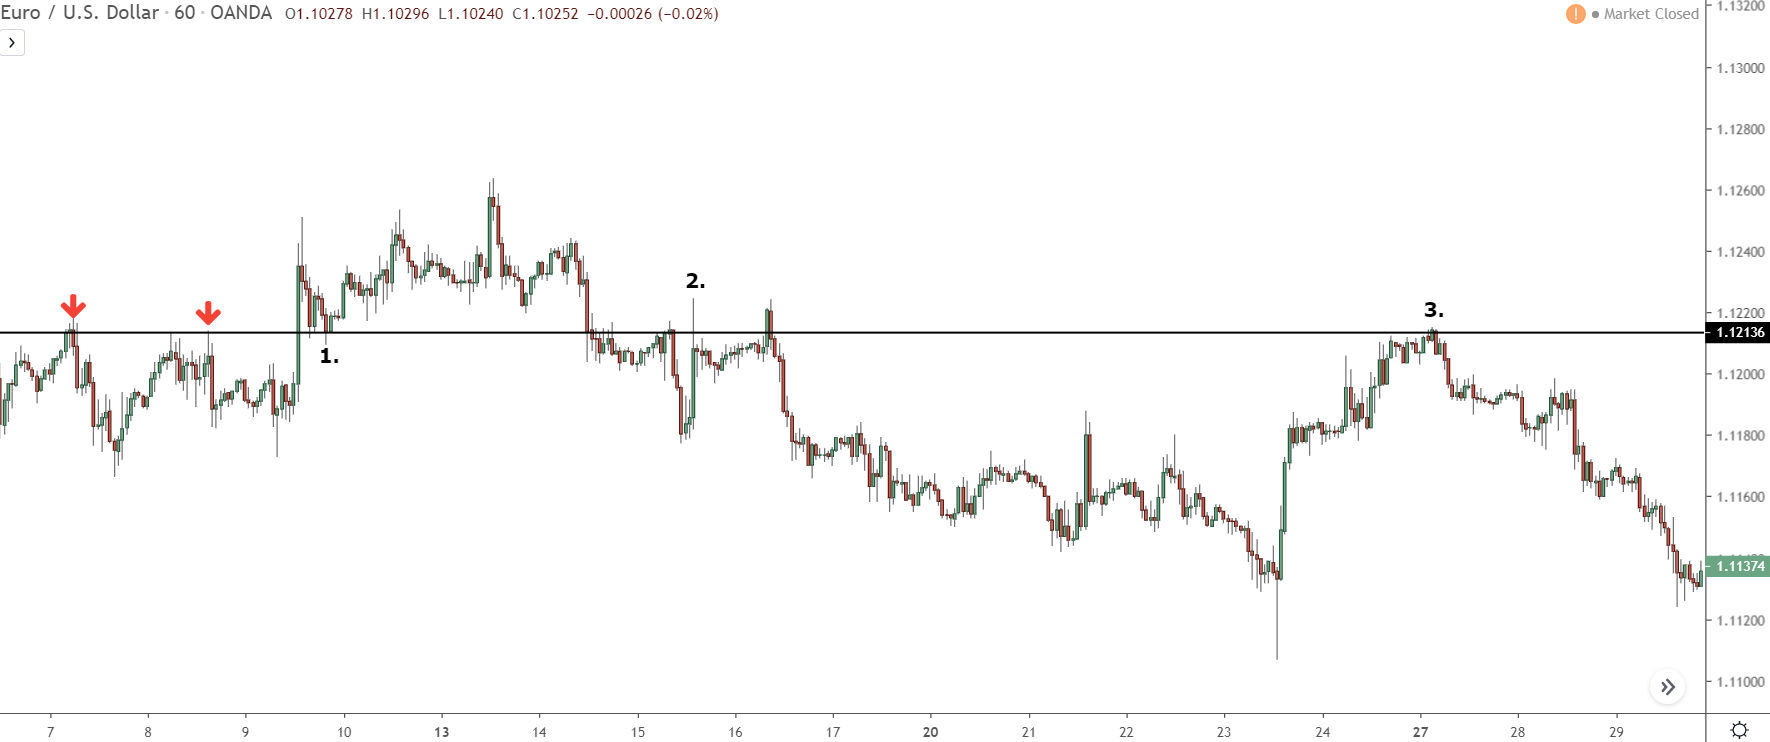
Shortly after the 3rd touch, price breaks the level – turning it to support – and reverses (point 1.). A couple of days later, it breaks through the level again, turning it back to resistance before reversing for a 2nd time (point 2.). After a long decline price returns to the level on the 27th, uses it as a resistance, before a large reversal gets underway.
So do you see how active this level was?
Overall, after the first two touches (it always takes 2 touches for a recent level to be valid), price reversed from this support and resistance level a total of 8 times, in only 25 days!
This is how useful it is to watch levels that have recent touches.
The fact the banks have recently used the level (hence the recent touches) means that lots of orders must be building up around it – why else would they use it? That, in turn, means price will probably reverse from the level again in the near future, which is exactly what we saw in the example.
Before we move on, here’s a couple of important points to remember…
1. A level needs two recent touches to be valid.
For price to have a high probability of reversing from a level, it must have at least two recent touches. The touches can come from the level acting as support or resistance, but they have to be recent, not from a long time ago.
2. Use the following times to know if the touches are recent.
In addition to a level having recent touches, the first two recent touches must come within a certain time of each other, otherwise, the level has a low chance of causing price to reverse.
There aren’t any official times for defining if the two touches are recent, but these are what I use, so they should serve you well.
5 min – 1 day.
15 min – 3 days.
30 min/1 hour – 8 days.
4 hour – 11 days
Daily – 1 month
2. Unbroken Levels Have A High Probability Of Causing Reversals
Looking for recent touches is a great way to find high probability levels, but another really good way is to look for levels that have multiple unbroken touches.
Remember earlier, how I said S&R levels from the banks?
Well, because they never have enough orders to place all of their trades or take their profits off at once, the banks have to split their positions up and place them at similar prices. They place a trade (or take profits), price reverses, and then they make it return to a similar price, later on, to get more placed.
On a chart, this results in multiple swing lows or highs forming at similar prices.
Many of you will know this already, especially if you’ve read my books. What you probably didn’t know, however, is the high or lows that form from the banks placing trades/taking profits usually create powerful support or resistance levels.
These levels, though rare compared to levels with recent touches as I showed above, have a high probability of causing price to reverse, so make great points to watch for reversals.
Here’s an example:
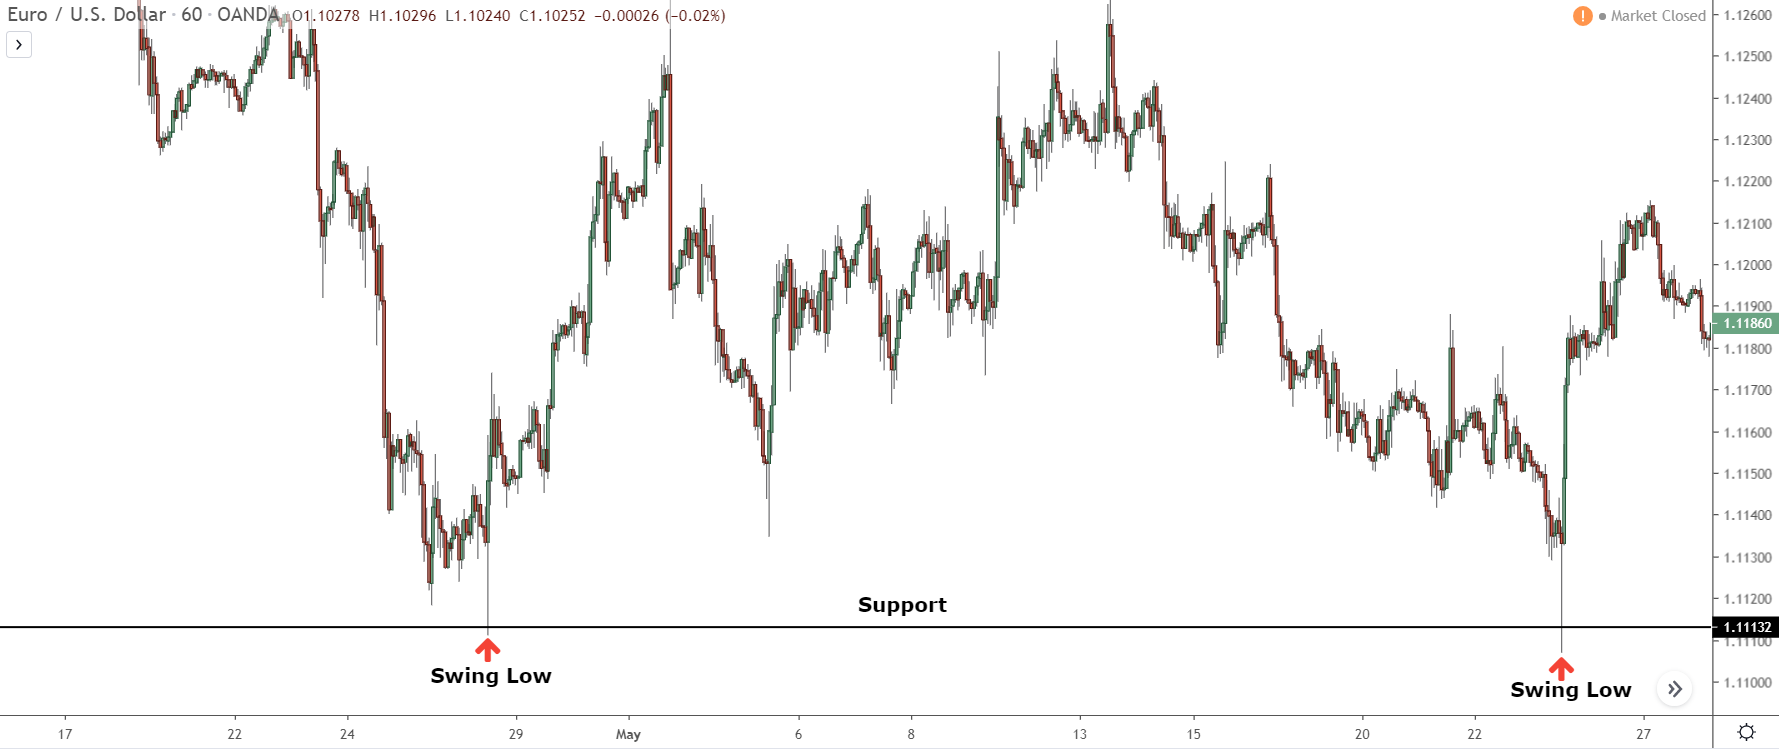
The support level above is drawn on two swing lows that formed at similar prices.
While we can’t say for sure, these lows have formed from the banks either placing buy trades or taking profits, as that’s what causes all swing lows and highs to form in the market – let’s assume it was from placing trades, just to make the example easier.
We know the banks never have enough orders to get their trades placed at once, so there’s a high probability price will soon return to this level and reverse as they get their remaining trades placed.
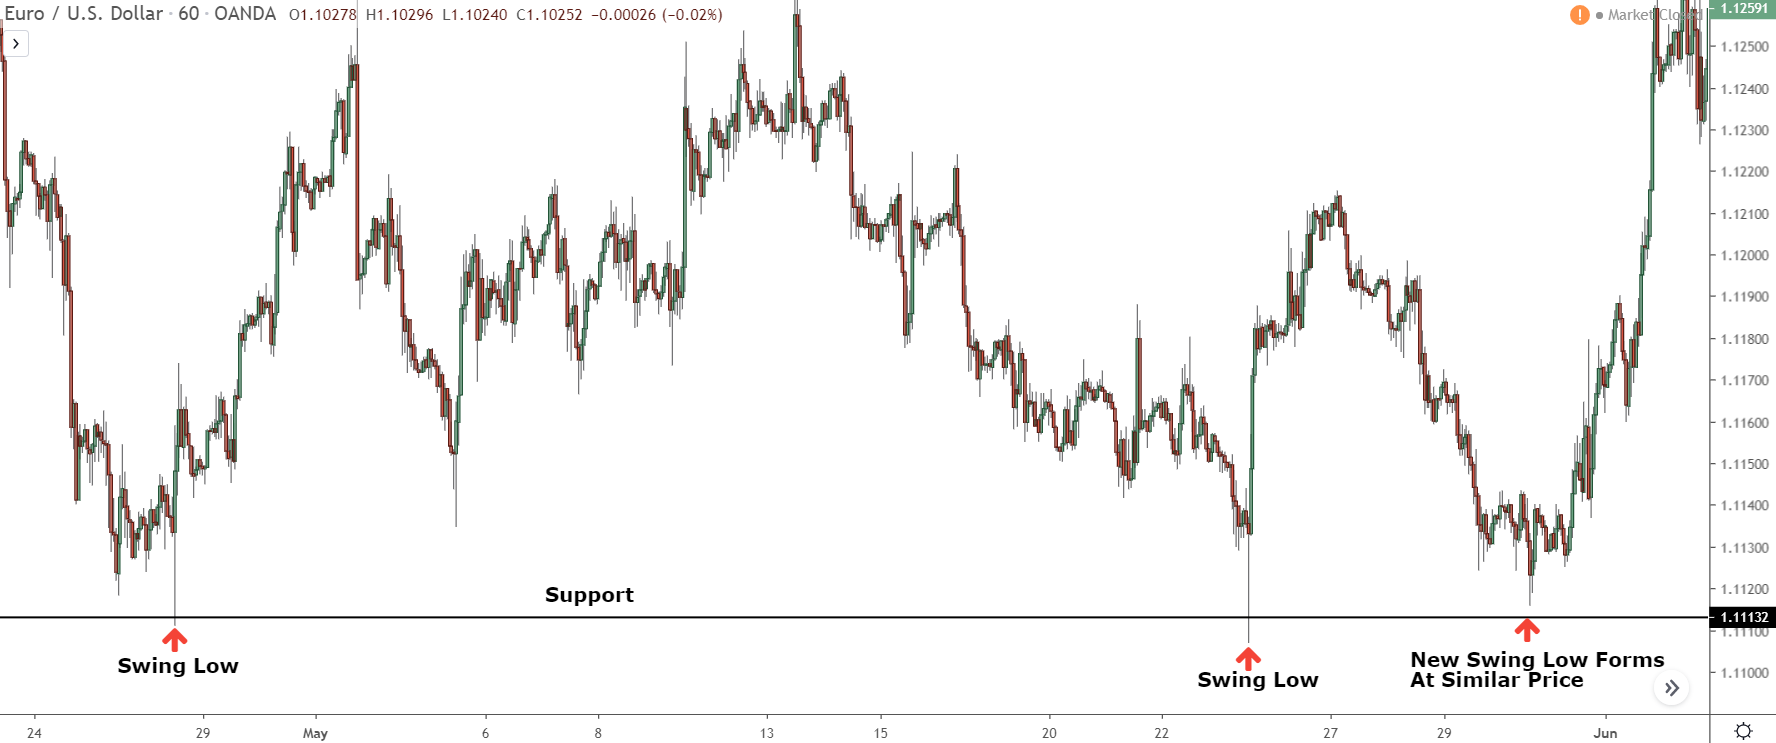
Sure enough, price returns and reverses, causing a new swing low to form.
It’s reversed because the banks have got their last buy trade placed. We didn’t know this at the time, but it was confirmed because price continued to rise and break the swing highs later that week.
Unbroken levels are pretty simple to understand and trade, but there are a couple of things to remember before you start using them.
1. Don’t continue watching the level after price has fully reversed.
When price fully reverses from an unbroken level, as it did after the 3rd touch in the example, don’t continue to watch it for reversals. Once price has reversed, that means the banks have got all of their trades placed/profits taken, so price probably won’t reverse when it returns.
2. Levels aren’t valid after 4 touches.
As with recent levels, it takes 2 touches to validate unbroken levels, but don’t watch for price to reverse after the 4th touch. Most of the time, the banks are usually able to get their trades placed or profits taken in 3 – 4 sets, so seeing more than 4 touches suggests something else is going on.
3. Draw SR Levels As Zones Instead Of Lines
You’ll notice the 3rd touch in the example didn’t hit the support level, it missed it by a few pips. Price missing S & R levels and failing to provide an entry is a big problem, for both unbroken levels and recent levels I showed earlier, but it’s one that can easily be fixed by trading levels as zones instead of lines.
I haven’t got time to explain how to do this today, but it is something you can learn more about in my members post.
Summary
So that’s why the normal way of trading support and resistance levels doesn’t work. Pretty surprising, isn’t it? You’ll find that this is the case for most techniques in forex. The books, guru’s etc will teach you to trade them in a way that sounds like it makes sense, when in reality, things don’t add up.
From now on, keep what I’ve explained above in mind when trading S & R and start looking for some of the levels I mentioned. These should make it easier to find good levels and as a result help you make more money.
.
Great
one question. where’s your profit target?
thx
I’ll usually target the closest daily supply or demand zone, Marvin. Price usually moves from daily zone to daily zone, so targeting the next closest zone is typically a good idea. I won’t close as soon as price enters the zone, though. I’ll wait for what price action appears and then make a decision. If it looks like a big reversal or retracement is beginning, I’ll either close the trade completely or take a lot of profit off, so that I don’t lose much if price reverses. If it just looks like a small retracement is starting or a consolidation is underway, I’ll leave the trade open, but I’ll take quite a lot of profit off by moving the stop closer to the zone.
Hope this helps,
Liam.
Hi, thanks, this is the closest way to know the “order book” of forex, cause it’s all about bid/ask and only banks have the enough quantity of money to move price.
HI, Tim
I have an idea of the inside bar trading. I think for the inside bar pattern. it is the position building on the lower timeframe actually.
But. I am not sure. why when I trade inside bar with this idea.
I usually will fail.
can you publish the inside bar trading article as quick as possible.
can I get it at next week?
thx