What’s a better way to kick off the new year than chatting about mistakes?
Just like life, trading comes with its own set of slip-ups. Some of these are minor, like picking the wrong signal to enter a trade or choosing an incorrect zone. These might cause a small loss here and there, but nothing to
lose sleep over.
But some mistakes can DESTROY your account balance.
Today, we’re zeroing in on the top three mistakes.
I’ll guide you through what these mistakes are, why even seasoned traders can make them, and dish out some advice on how you can either avoid them altogether or mitigate their damage.
So, are you ready?
Let’s dive in.
Thinking Supply And Demand Is How The Whole Market Works
I’ve encountered this misunderstanding a lot over my years of trading, and I’ll confess…
I made the same mistake when I first got started with Supply and Demand.
So, what’s this all about?
S&D is not just a trading strategy; it’s also a theory explaining why prices move and how the forex market operates… It’s our guide to understanding why things happen in the market.
If we didn’t believe it worked, we wouldn’t be using it, right?
Here’s a quick summary of the theory:
Banks create supply and demand zones through significant trading actions. The banks then manipulate price to revisit these zones, quickly filling any remaining positions using the buying or selling generated by the returning move into the zone.
This activity gives rise to the reversals we see in these zones.
The theory makes sense, doesn’t it?
But here’s the problem:
Many traders misapply the theory of supply and demand to everything in the market. Once they start trading S&D, they start to believe every tick and twitch on the chart somehow comes from the zones.
They discard:
- Support & resistance levels
- Psychological levels
- Swing structure
- Order flow
If these traders see a reversal which doesn’t originate from a zone, they’ll conveniently attribute it to a zone from some other timeframe.
Sound familiar?
Ever catch yourself falling into this trap?
I get why traders go down this path; believe me, I’ve been there. I, too, assumed every market movement could be attributed to S&D. If I noticed a reversal, I’d chalk it up to some zone—even if the zone hadn’t materialized on my current timeframe.
Sometimes, I’d even hop between smaller timeframes until I stumbled upon a zone that aligned with the reversal, just to validate my theory.
But experience taught me a lesson: This isn’t accurate.
While S&D zones do influence a significant portion of price movement, they aren’t the factors behind every reversal.
Other elements can—and do—trigger price reversals.
These factors often coincide with supply and demand zones, creating the illusion the zone instigated the reversal, when in reality, it was some other technical factor completely unrelated.
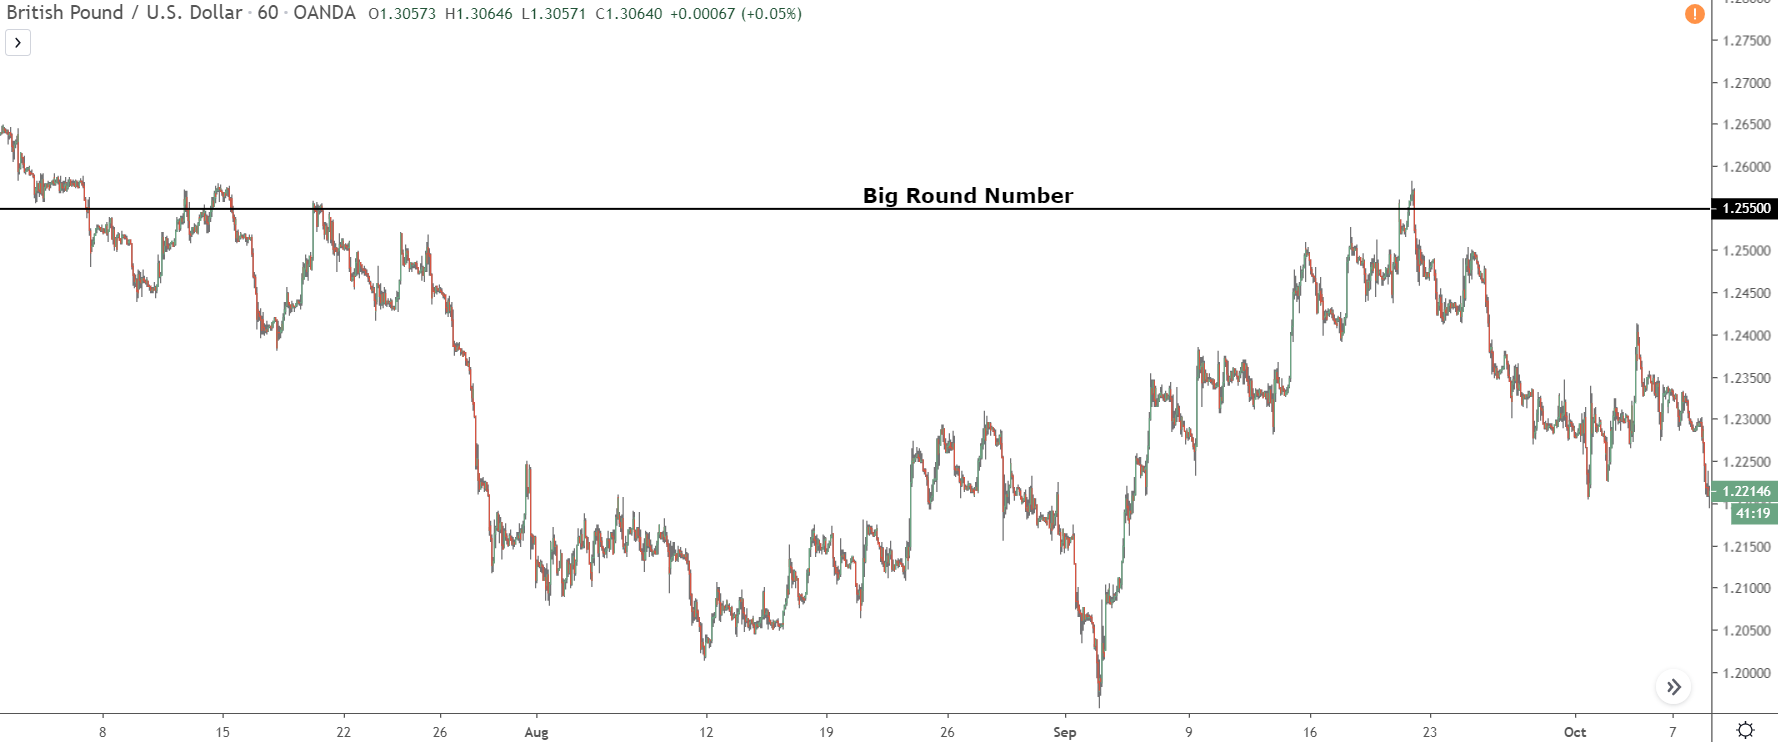
Take Psychological levels, for example…
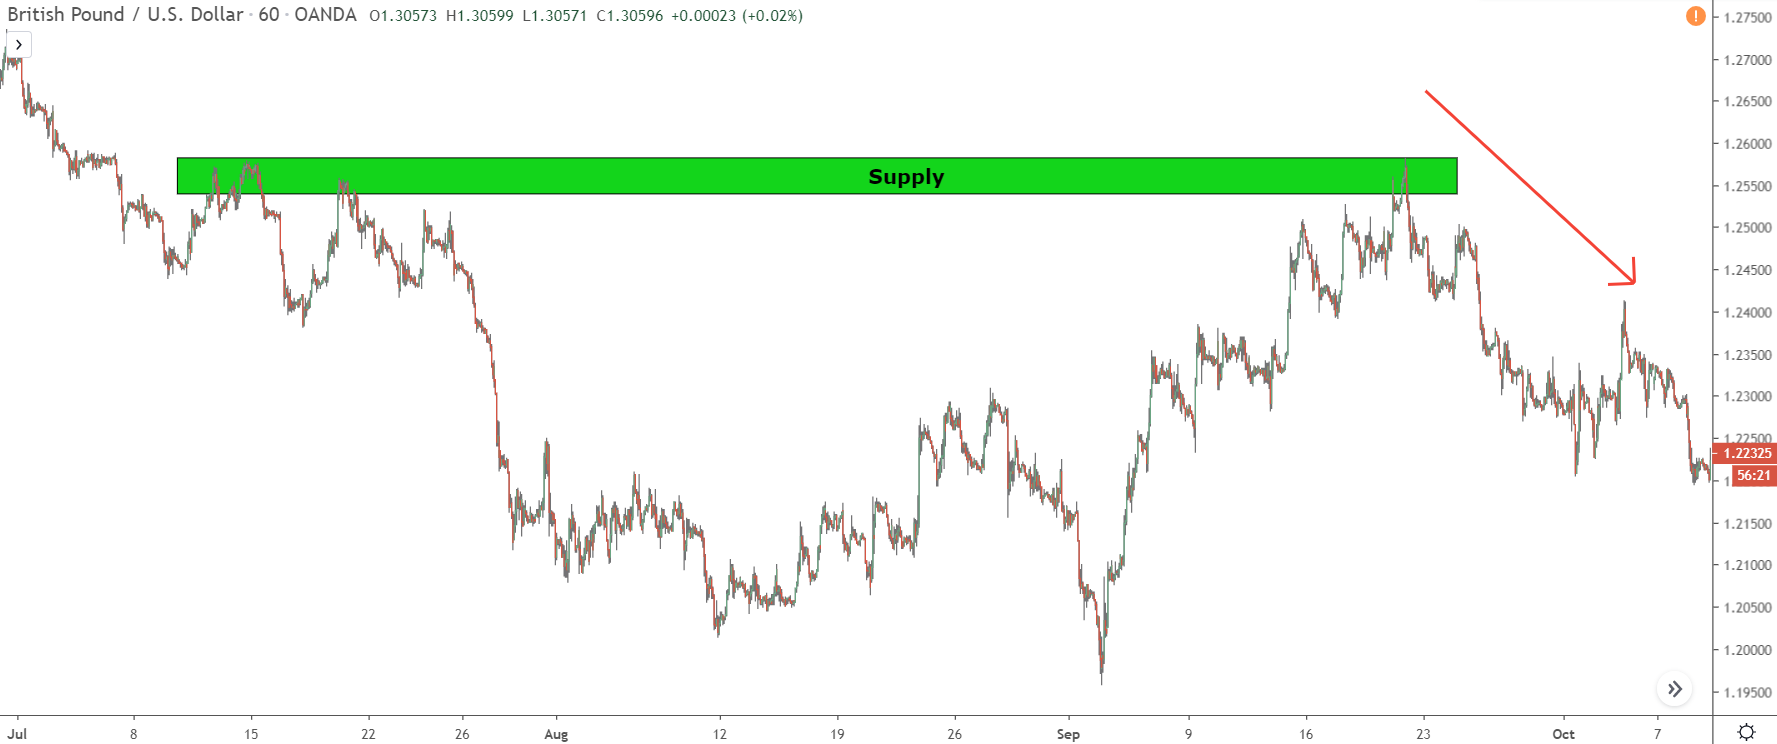
At first glance, the reversal appears to be triggered by the supply zone. Most S&D traders would nod in agreement because, well, they naturally assume all price movement originates from zones.
But hold on a second and look again…
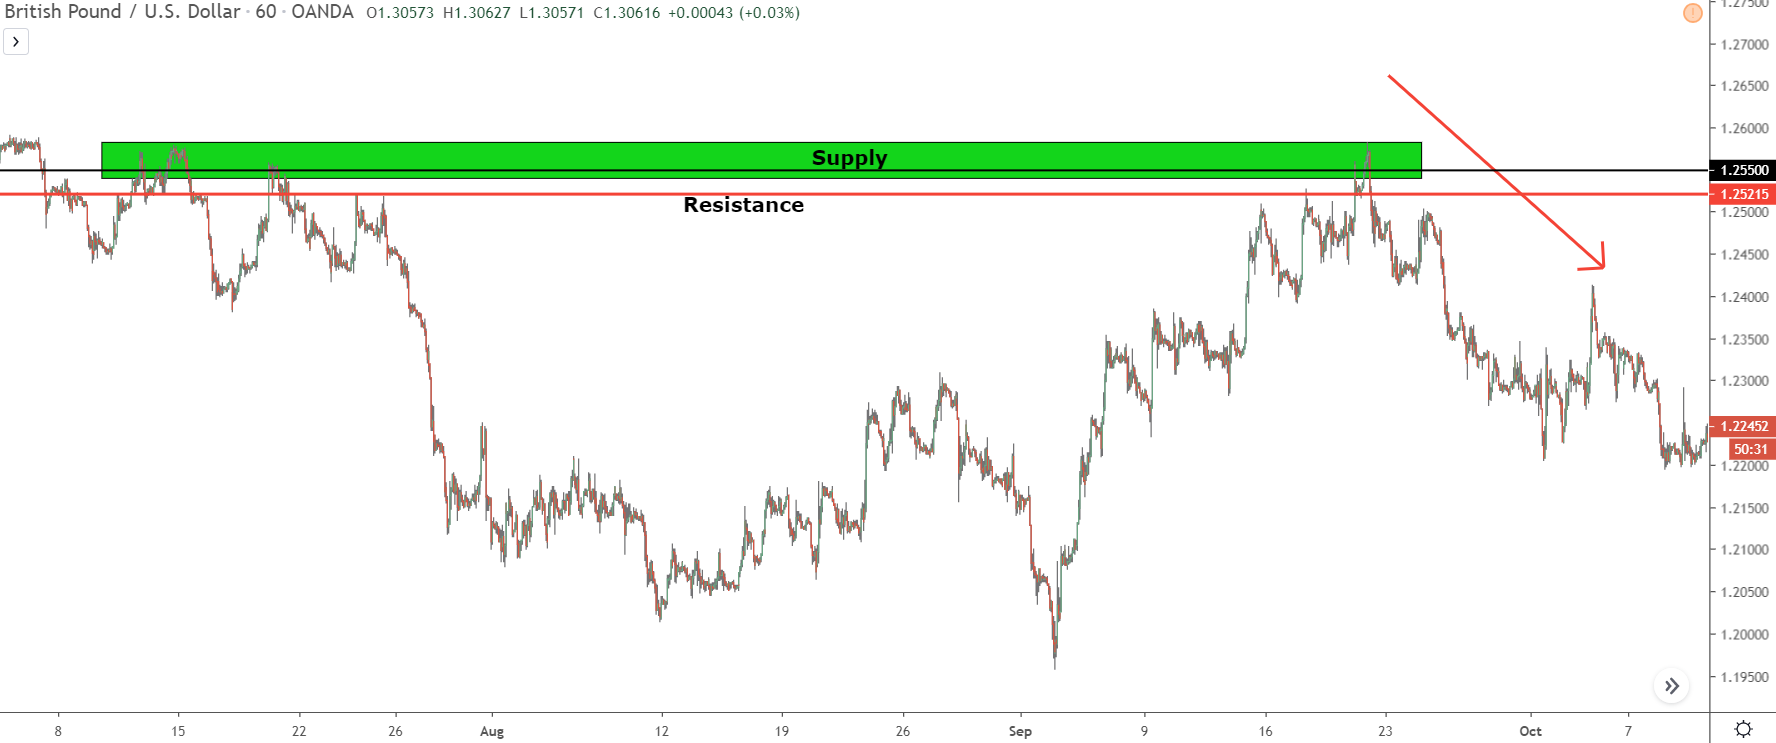
Notice the 1.25500 Psychological Level and the resistance level just below?
These also align with the supply zone. Either of these could be the real culprit behind the reversal. Traders who use these technical points might argue these levels triggered the reversal.
So, the million-dollar question is: Who’s correct?
- What was the real cause of this reversal?
- Was it the supply zone, as S&D traders would bet?
- Was it the psychological level or resistance level, as other traders might argue.
Truthfully, I don’t know.
I can’t say with certainty which of these technical points actually led to the reversal. There’s no definitive way to know, as none of these factors come supported by real evidence; they’re just theories developed by traders.
That said, there’s a way to make educated guesses—through the process of elimination.
Let’s start with supply zones.
In S&D trading, old zones are unlikely candidates for causing reversals. Why? Because it doesn’t make sense for banks to sit on their hands for weeks, months, or even years to enter leftover positions.
So, if the supply zone in our example is old, we can safely rule it out as the cause of the reversal.
That leaves us with the psychological level or the resistance level.
Let’s look again…
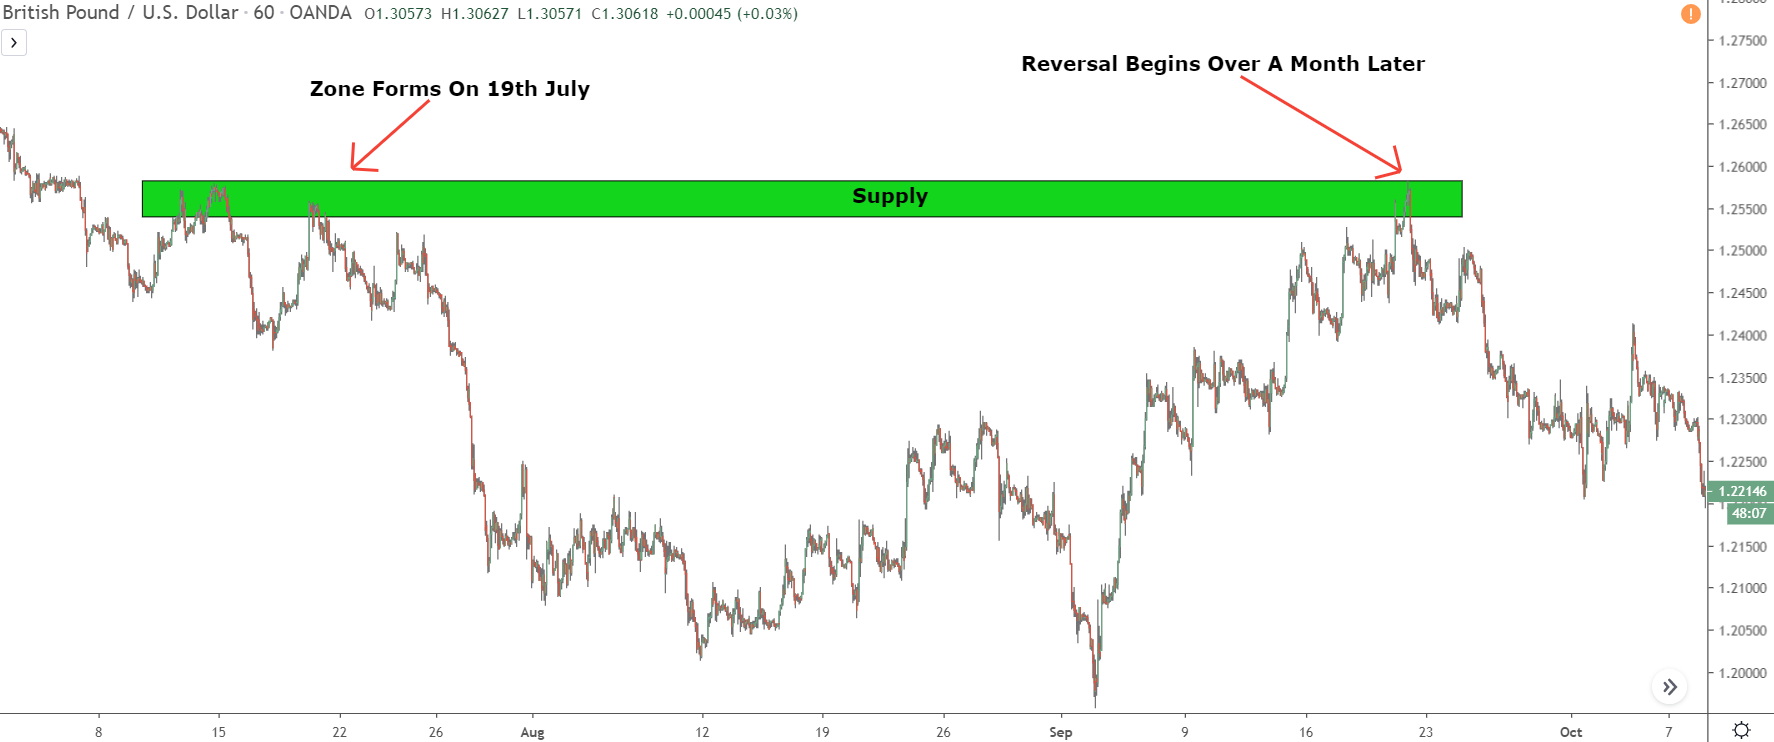
The supply zone formed 35 days before price returned.
For a 1-hour timeframe, that’s practically ancient. (Don’t worry, we’ll dive into old zones later). Given the zone’s age, we can cross this supply zone off our list of culprits for the reversal.
Now, let’s check out the resistance level.
My hot take: Support and resistance levels don’t hold much water.
Sure, these levels exist, but they function more like short-term pit stops rather than pivotal reversal points. And I’m far from convinced reversals occur at levels simply because they’ve had multiple touches in the past.
Why would banks choose to buy or sell from a spot where price has reversed three or four times already?
What logic is there in that?
I’ve yet to find a strong answer.
So, in my book, support and resistance levels only hold significant validity when they’ve been touched recently and drawn as a zone.
Our current resistance level?
It doesn’t meet this criteria.
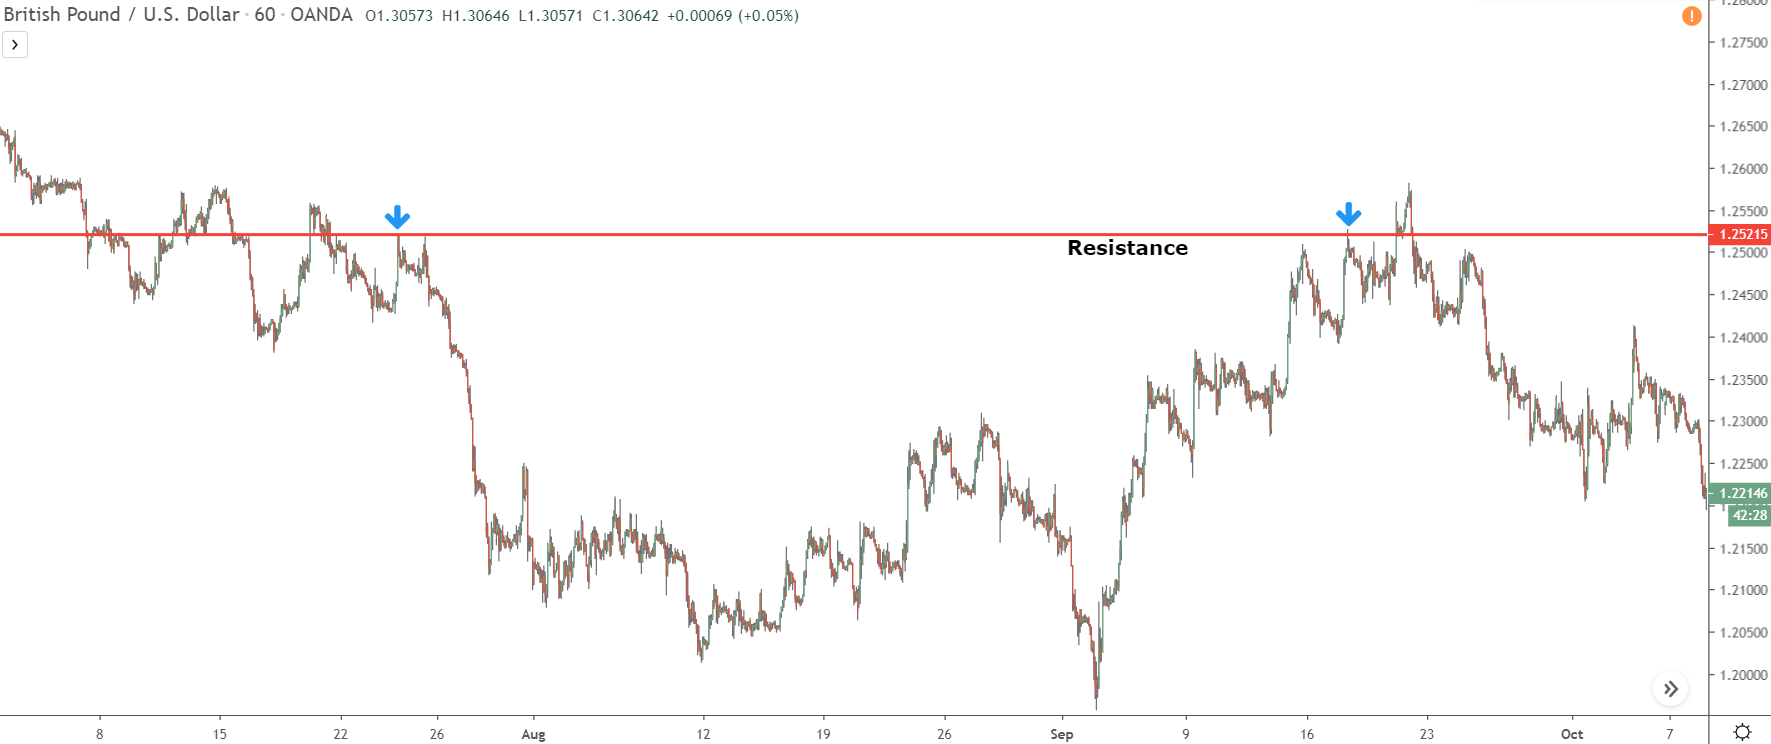
Yes, it has multiple touches, but none are fresh.
The most recent unbroken touches (which I’ve marked with blue arrows) got obliterated when price rose just before the reversal kicked in.
All its touches are from the past; none are recent!
Adding to that, the level’s last touch was marred by a significant price drop, effectively erasing any value or significance it once held. So, it’s safe to say the reversal was likely not triggered by the resistance level.
This narrows down our options to just one more possibility:
The 1.25500 Psychological Level.
Our current resistance level?
It doesn’t meet this criteria.
Yes, it has multiple touches, but none are fresh.
The most recent unbroken touches (which I’ve marked with blue arrows) got obliterated when price rose just before the reversal kicked in.
All its touches are from the past; none are recent!
Adding to that, the level’s last touch was marred by a significant price drop, effectively erasing any value or significance it once held. So, it’s safe to say the reversal was likely not triggered by the resistance level.
This narrows down our options to just one more possibility:
The 1.25500 Psychological Level.
Unlike the other two concepts, big round numbers do have statistical evidence backing them up.
Scientific papers have been written about their significance in multiple markets, and if you look at Oanda’s order book, you can clearly see orders build up around big round numbers all the time.
But why would price reverse at a big round number?
Well, because of how the banks trade, they have never have enough orders to buy or sell in one go. They have to split their trades up and place them when enough orders are available. They typically do this at similar prices, to replicate the effect of having their trades placed all in one go.
This will be familiar to those of you who have read my books.
To make this process easier, the banks always try to push price to points where they know a bunch of orders have built up. That way, they can use them to get more trades placed in one go, lessening the amount needed later on.
And where do lots of orders build up?
At big round numbers prices.
So the reason price reverses from big round numbers is because the banks use the orders that have built up to place trades, take profits or close trades. And the reason the reversal in our example was most likely caused by the BRN is that it’s the only level with sufficient evidence behind it.
Now, what am I suggesting with all this?
Do I think you should cross-examine every supply and demand zone to see whether it’s going to cause a reversal or if it’ll be something else?
No, that would be crazy, and pretty time consuming too.
All I’m saying is that don’t assume every event, reversal, or whatever happens as a result of your trading strategy.
Forex is full of complicated variables that interact with one another in strange ways. To break it down to the point where only one theory (S & D in this case) is behind everything is a massive oversimplification that will only result in you losing money and not knowing why.
Make things as simple as possible, but not simpler.
Before we move on, here’s a quick overview of what technical points cause reversals depending on where price is at.
1. Most short term reversals – reversals close to the recent price action – are caused by new supply and demand zones, as the banks always want to get their trades placed/profits taken quickly.
2. When a supply or demand is too old to cause a reversal, the next most likely candidate are big round numbers. Some short term reversals are caused by big round numbers too, but it’s impossible to determine whether it was them or a new S + D zone, so it’s better to just assume it was a zone.
3. Support and resistance levels in their traditional form don’t exist. However, levels with at least two unbroken recent touches can and often will cause short term reversals.
You’ll usually see this when price moves sideways after a sharp move and creates two swing lows or highs at similar prices. After the second low or high forms, price will come back and reverse from a similar point. A weak demand zone sometimes forms from the second high/low too, but not always.
Drawing The Zones The Wrong Way
Drawing zones the right way is THE most important skill in supply and demand trading. If you don’t know how to draw the zones properly so that they encompass the right points, you won’t be able to enter trades correctly, and it’ll be extremely difficult for you to make consistent money.
In itself, drawing the zones correctly isn’t difficult:
You find the source of the move the supply or demand zone has formed on, then drag a rectangle from the beginning of the move to the most recent lowest or highest high; highest high for supply zones, lowest low for demand zones.
So why do so many traders get it wrong then?
Well, because they don’t get taught to draw zones correctly in the first place.
Over the past 10 years or so, supply and demand has gone from being a niche strategy only used by a few traders in forums to rivaling support and resistance trading. In fact, supply and demand today receives almost as many google searches as support and resistance trading…

It’s good that supply and demand has become more popular – the more the merrier after all. But one unfortunate side effect of this is it creates many guru’s who claim they know how to trade S & D but don’t really have a clue.
I’m sure you’ve come across some of these yourself.
These gurus teach traders their interpretation of how to trade supply and demand. The problem is because they don’t really know how to trade the zones, a lot of what they teach isn’t correct. With the perfect example of this being the way some gurus teach traders how to draw the zones.
Tell me, have you ever seen someone draw zones like this…
Looks pretty crazy, doesn’t it?
Believe it or not, this is how many guru’s teach traders to draw supply and demand zones.
According to them, this is the right way to draw the zones because the candle body is where the banks bought or sold, therefore it’s the point where price will reverse upon returning to the zone.
Now obviously, this isn’t correct.
The banks always place their trades at swing highs and lows, as that’s when the maximum amount of opposing orders are coming into the market. So drawing the zones this way, while it may net you the odd winner here and there, will consistently cause you to lose money and miss trades.
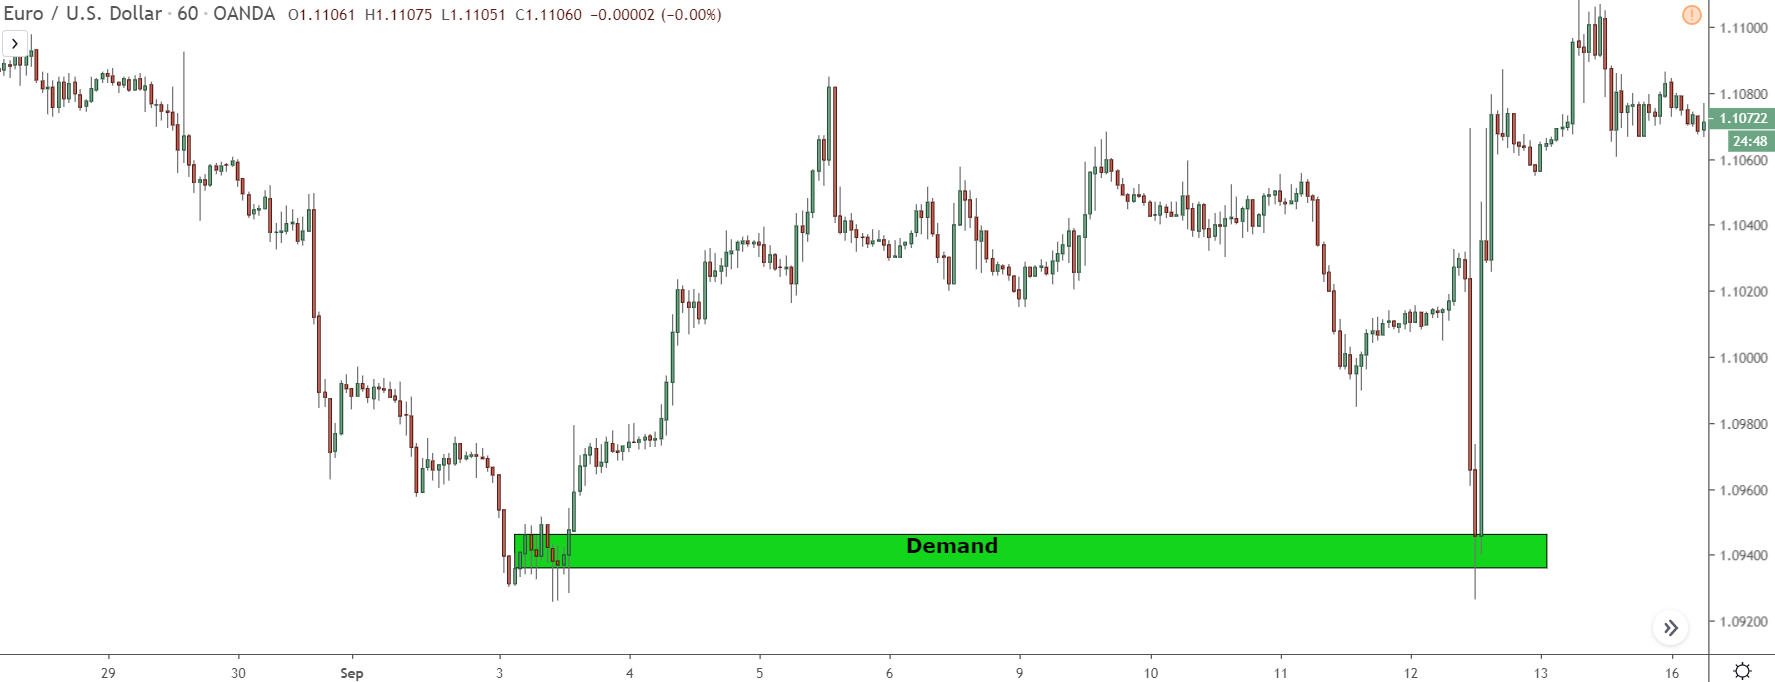
The right way to draw zones is from the open of the first small candle in the rise/decline that created the zone to the most recent highest high or lowest low; highest high for supply zones, lowest low for demand zones.
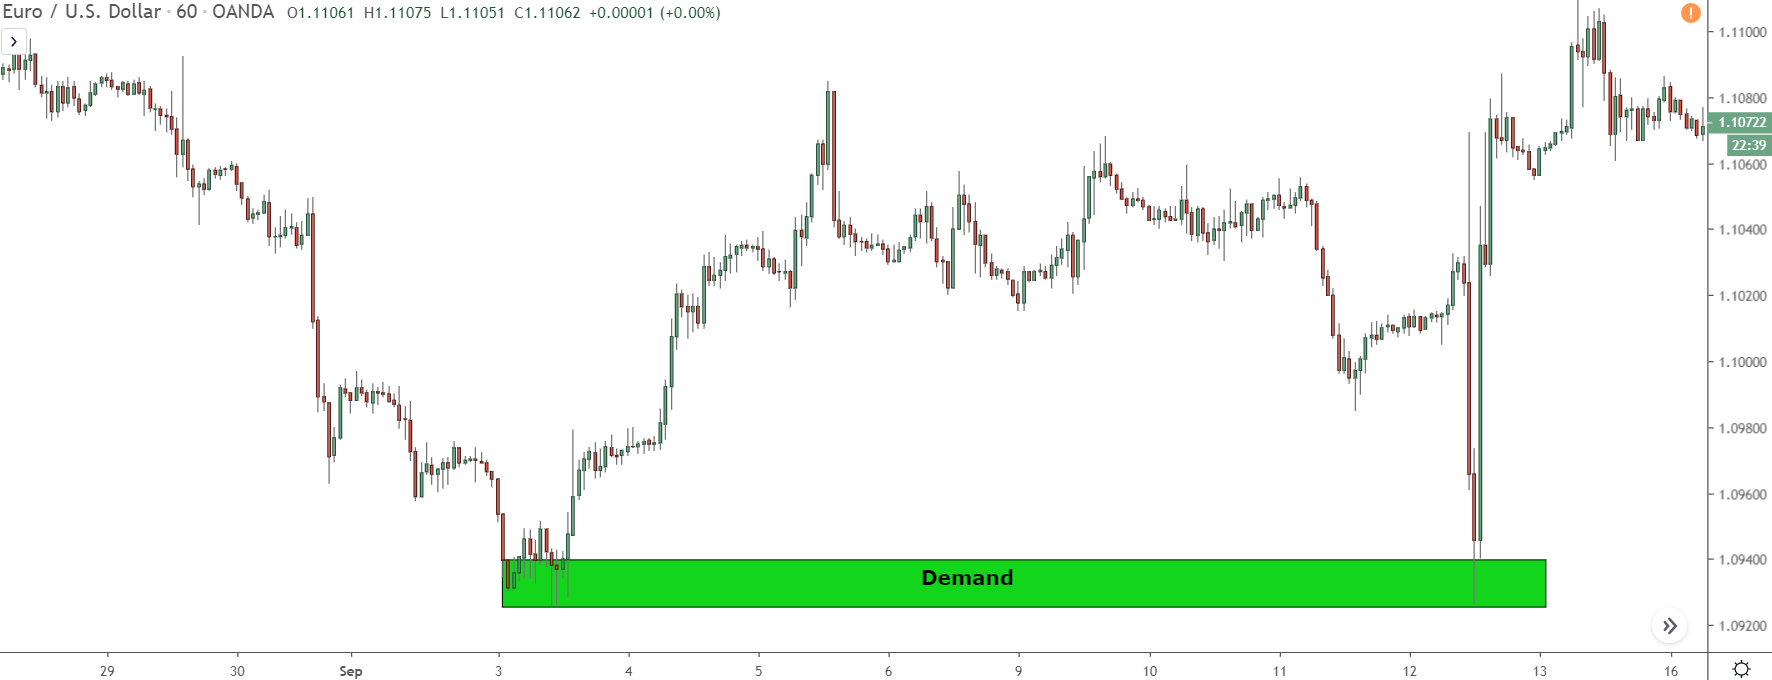
Here’s how that looks like with a demand zones.
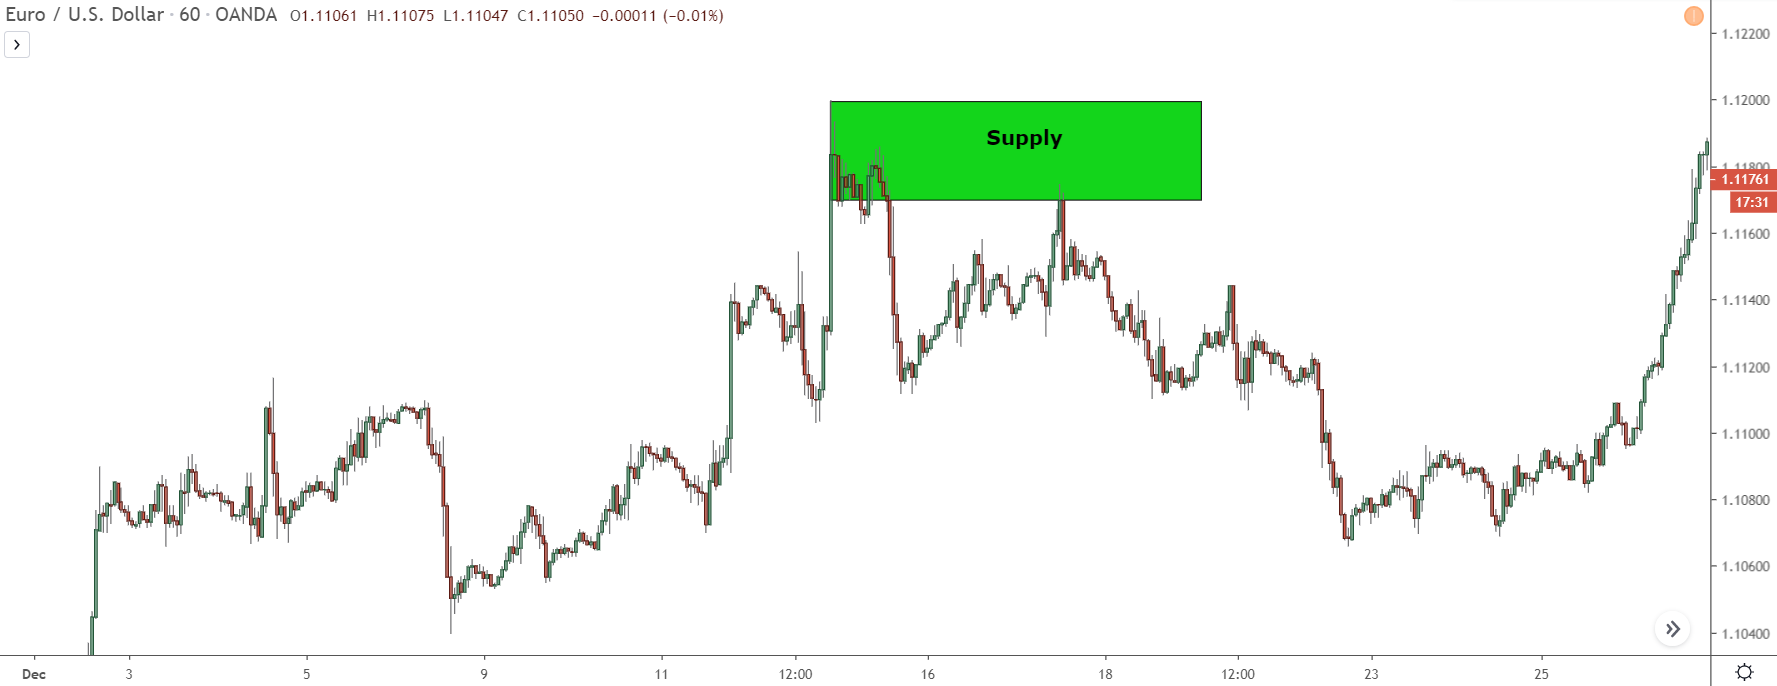
And here’s how it looks for supply zones.
There’s a bit of a knack to drawing the zones correctly, but if you spend a couple days on it, it shouldn’t be too hard to pick up. My drawing supply and demand zones guide goes into much more detail, so check that out if you want learn more.
Trading Old Zones
And last, but not least, we have trading old zones.
Trading old zones is a mistake born out of misinformation.
When supply and demand was created many years ago now, the main guru was Sam Seiden. He created the strategy using his experience working at the Chicago Mercantile Exchange and translated it into a retail trading strategy.
Sam came up with many of the concepts now familiar to user trading S & D today.
Concepts like the idea the banks make price return to zones because they can’t get all their trades placed at a single price comes from him, as does the fact zones form at the source of large rises and declines as a result of the banks placing trades, which is a core component of S & D trading.
We have to thank Sam because without him we wouldn’t have S & D trading, and this site probably wouldn’t exist. But just because he created the strategy as we now know it, doesn’t mean he got everything right.
And nowhere is this more evident than his insistence old zones work just as well as new zones.
While Sam hasn’t said this himself – at least from what I understand – it is heavily implied through his teachings and how he often cites old zones as examples of successful trades.
It’s obvious why Sam thinks old zones cause reversals and why so many traders believe him. I mean, take one look at the charts, and you’ll see price reverse at old zones all the time.
The thing is, while price looks like it reverses because of these zones, in reality, it has nothing to do with it.
And here’s why…
Supply and demand zones form from the banks placing trades, and in some situations, taking profits. They place their trades, a zone forms, then they make price return later on. They make it return because they weren’t able to get all of their trades placed, due to a lack of orders entering the market.
So far, so supply and demand 101.
The important point that no-one seems to think about is why would the banks wait weeks, months, or even years in some cases, for price to return to a zone?
I mean, think about it…
If a bank bought some Eur/Usd, but didn’t get their entire order filled – so had to make price return to a demand zone – are they really going to wait 3 or 4 months just for price to return?
Of course not, right?
By that time, the whole economic situation may have changed. And your reasons for entering in the first place might not be valid anymore, making it riskier to buy again.
This is why old zones don’t cause reversals.
It doesn’t make sense for the banks to wait a long time to get their remaining trades placed. The longer they wait, the more that changes in the markets; the sentiment changes, the economic situation changes, and many other things change, all of which make it much riskier for them to buy or sell again.
So I guess the next question is:
How do you determine whether a zone is old or not?
Nobody knows for sure what constitutes to an old zone or not. Like I said, most guru’s see all zones as the same, so they don’t distinguish between them.
That being said, I do have some guidelines you can follow to determine if a zone is old or not:
1 min/5 min/15 min charts – 1 day.
30 min/1 hour/4 hour charts – 20 days.
Daily chart– 3 months.
Obviously, these won’t be accurate 100% of the time, so it’s a good idea to give it an extra couple of days/weeks for price to reverse – depending on the timeframe, of course.
Keep in mind too that if a zone forms inside a higher timeframe zone, like a 1-hour zone inside a daily zone, for example, the 1-hour zone falls under the same time as the daily. There’s no difference between them because the banks will use the 1-hour zone to place their daily trades.
You can find more about old zones and their times in my trading course..
The Bottom Line
It’s impossible to not make mistakes trading supply and demand.
It’s a fact of trading we all just have to live with. That being said, I hope with this guide, you now know which of the big ones to avoid when trading S & D, and can stay on the right track without suffering major losses.

Grab Your FREE E-Book:
5 Pro Rules For Trading Supply And Demand
- Master the core principles of supply & demand.
- Advanced techniques for trading SD zones.
- Exclusive new lessons/books/tools every week!
Sign Up Now To Download Your FREE Guide:
🛡️ Spam-Free Promise: No spam, ever. We'll only send you relevant updates and content. Unsubscribe at any time.
hi. Tim. I get one question. can I use The method you talk above to locate the 1h supply demand zone. and then use the method you talked in your YouTube video. like the event2&3. to enter into the trade.
Hey Marvin, Liam here.
Yes, of course. The method that Atlas talks about in his video works fine with everything explained above. You shouldn’t have any problem with it.
Enjoy your weekend,
Liam.
That’s amazing article. Thank you
Hahaha Liam, I’ve just seen this at the perfect time. I’m such a victim of this. When I see the market miss my zone…”I’m like what, there must be another zone on another timeframe I missed” … and il go hunting. You’re so right.
This is something I’m going to have to discuss on the channel and push people to this post.
Killer lesson.
Atlas
Glad you liked it Atlas, thanks for the comment.
Hi. Liam
I still get one question. to locate the strongest supply demand zone.
I know. to determine the zone is strong or not. the zone must with long up or down move before. but. to see the valid supply demand zone. it should with strong move after the zone or not, because, if the moves is too small, how do I know, this zone is position building or not.
thx
Thanks for the information.Where can we find your youtube channel.
Hey Derby,
I don’t run a youtube channel myself, but my friend AtlasFX has a channel… I’ve left the link below.
AtlasFX
He doesn’t trade in exactly the same way as me, but his videos contain lots of great info on supply and demand and various other trading concepts. Check it out if you’re interested.
Hi Liam,
I have a question.
You did mention not to trade on old zone. What happen if a price goes into a old zone territory , let say daily chart, the nearest zone was 9 months ago?
Thanks
If it’s that old, I wouldn’t consider using it Albert.
Price may still reverse inside, but because of some other factor, not the zone itself. Wait for price action, that’ll give you clues.
If price moves into an old zone and you see a sharp move in the opposite direction, it’s a good signal the banks are upto something (either buying or selling). So you may see price reverse soon after. Hope this helps,
Hi Tim,
Thanks a bunch for the selfless service you’re rendering. Can S & D zones be drawn on Mt4 & Mt5 Android version? If so, how do I draw them?
Hi Liam,
Many thanks for the selfless service you are rendering to the fx trading community. Would like to know if it is possible to draw Support and Resistance zones on Mt4 & Mt5 for Android. If so, how are they done? Thank you
Hey Steve, thanks for you comment!
I would assume so. I don’t have MT4/5 on android – I just use my broker’s charts when out and about – so I don’t know for sure whether you can or not. If you can place rectangles and lines on the chart, I see no reason why you couldn’t draw the zones. Might be a bit of a hassle getting them placed, but it should be possible if you line everything up correctly.
Hope this helps,
Noted with thanks. Keep up the good work!