
Over the last 200 years, trading and investing in financial markets has become commonplace.
During that time, many strategies and trading methods have cropped up, all with the intention of giving traders the edge in making money from the markets. Many of these have become outdated with time, but some still provide an edge.
Case in point: the Wyckoff method.
The Wyckoff method is an all-encompassing theory of how financial markets function at both the macro (long term) and micro (short term) scales.
The method states market movement is based on #1 price and #2 volume: price action creates buyers and sellers; volume reveals the intent behind those buyers/sellers.
It also states market action usually results in certain outcomes.
Basically, price has a cause-and-effect relationship:
Different events (cause) provide specific outcomes (effect), which forms the price action we see.
This results in markets moving through repeatable cycles, which can be observed on a price chart.
With these principles, the Wyckoff method can give you a far greater understanding of what’s taking place in the market. It acts almost as a roadmap for where price is and where it might go in the future, which you can use to your advantage.
In today’s post, we’re going to explore the Wyckoff method…
How it works,
Where it came from,
The 4 key market cycles,
The laws and principles behind it.
This should give you a firm overview of the method and how to implement its many concepts and ideas in your own trading.
So, ready to learn how Wyckoff method works?
Let’s jump into part 1…
IMPORTANT: Click Here To Download My Wyckoff Guide As A PDF!
What is the Wyckoff Method?
Forex is littered with all manner of trading methods, but few are perhaps more famous than the Wyckoff method.
Created by Richard D Wyckoff in the 1930s, the Wyckoff method provides traders a framework for tackling the markets using price and volume. Initially only used in stocks, today, the Wyckoff method has been adapted to all markets, with many of its core concepts and ideas finding their way into modern technical analysis.
The Wyckoff method is made up of 3 laws and a few principles which govern analysis and dictate how you should view the markets.
These are as follows…
Laws/Principals
1. Supply and demand
2. Cause and effect
3. Effort vs result.
Concepts
1. The composite man.
2. Chart analysis schematics (plans).
3. A 5-step trading approach.
Alongside these, Wyckoff believed two fundamental truths were present in all markets, which he detailed in his 1933 book “Stock Market Techniques”.
1#: The market never behaves in the same way.
Wyckoff believed price action will never form the same way it did in the past. Too many variables are present. Even if a move appears identical, the underlying psychology isn’t the same.
Therefore, you must treat every move as being unique.
#2: Every price move is unique.
Tied in with rule #1, every price move being unique (due to the different variables) means the only way to properly analyze moves is to compare them against one another. This is important for understanding the Wyckoff cycle, which we’ll look at later on.
Understanding Wyckoff’s 3 Market Laws
Wyckoff came up with several important concepts to define his trading method.
One of those concepts was his 3 market laws, which occur naturally and help form the market cycle – more on this later.
These 3 laws are as follows…
Law #1: Supply And Demand
The law of supply and demand (not to be confused with S & D zones) is one that permeates all financial markets. It’s also one of Wyckoff’s most important laws, being that it creates the price movement we see.
The law can be explained as…
Demand greater than supply = price rises
Supply greater than demand = price falls.
Demand almost equal to supply = price moves sideways.
The law of supply and demand comes from a simple fact about markets:
That people move prices!
In any market where people generate buying and selling, the law of supply and demand exists and creates the price movement we see.
If more buyers exist than sellers, prices must rise – demand is greater than supply. More people want to buy a product than want to sell. Therefore, price must rise to reflect the increase in buyer’s vs sellers.
The opposite also rings true…
If more sellers exist than buyers, price must fall – supply is greater than demand.
More people want to sell than buy, so price must fall to reflect the difference.
To gauge the level of supply and demand, Wyckoff uses price action and volume; price action to identify whether buyers or sellers exist; volume to confirm their level of interest in wanting price to rise or fall.
Law #2: Cause And Effect
In physics, the law of cause-and-effect states that every event is an action followed by a reaction. A bridge collapses; the cause was severe weather. The effect being no one can use the bridge anymore – not the best example, but hey, it makes sense.
Wyckoff also believed in the law of cause and effect but applied to markets.
He explains the changes in supply and demand (price movement) are not random but are initiated and preceded by preparation events, those being:
Accumulation (Cause) always leads to an uptrend (Effect).
Distribution (Cause) always leads to a downtrend (Effect).
These two preparation events, which we’ll talk more about later, create uptrends and downtrends on both macro and micro scales – accumulation leads to long-term uptrends made up of smaller short-term trends, also initiated by accumulation.
Understanding these two events is central to using the Wyckoff method and usually appears as consolidations or sideways movements on a chart.
Law #3: Effort vs. Result
The final law is one we all know too well… effort vs result.
To get a result, you must put effort in, no if’s and no but’s.
In Wyckoff’s teachings, effort vs result means price only changes because traders put effort (buying or selling) into making it change. It’s a way of measuring interest, basically.
If traders really expect higher prices, many will buy (high effort).
If traders aren’t convinced, many won’t buy (low effort).
To measure the level of effort, Wyckoff uses volume. Volume reveals whether significant effort is being put into the move or only a little.
The more effort being put in, the more likely price is to continue in that direction.
There is a catch, however…
Effort (volume) must match the price action.
If the volume increases during an uptrend (more effort) yet we see little bullish price action or even bearish action, something isn’t right. Price and volume are not in harmony. That suggests a change in direction via retracement or reversal could be gearing up.
Learning to read volume and match it with price action is a key skill to Wyckoff’s teachings, but it’s not required to use the method in your trading.
The Composite Man
Financial markets consist of many participants, but Wyckoff suggests viewing the market as if controlled by a single entity:
The composite man.
In forex, the composite man represents the big players such as banks, hedge funds, and market makers. These guys essentially control the market and trade in a similar fashion. So, it makes sense to view them as one rather than separate groups.
Strategy-wise, the composite man uses manipulation and deception to mislead retail traders into losing money.
This is because forex is a zero-sum game, where the only way to win is via other traders losing.
That applies to every participant, from the composite man to us retail traders.
If you want to make money, you MUST take it from somebody else.
That’s how the market functions: one must lose for another to win.
For the composite man, this has two massive implications…
#1: Their goal is to make as many traders lose as possible.
Since forex is zero-sum, the composite man’s entire trading strategy centers on manipulating traders into losing money. They want as many traders to lose as possible because that’s how they make a large profit.
They do this using a variety of tricks and tactics.
You can learn more about these in the articles across my site.
#2: They always trade the opposite way retail traders.
For the most part, retail traders all tend to trade in the same way; when price rises, they buy; when price falls, they sell. The big players (composite man) want retail traders to lose, and so always take the opposite action.
When retail buy, the composite man sells.
When retail sell, the composite man buys.
On the charts, this manifests as different price action structures.
For example, if price has risen for a long time, most retail traders are probably buying. That means the composite man can’t make money anymore – no one is losing! They must initiate a confusion event by taking price the other way, like a retracement.
That’ll shake out the late longs (weak holders) and push many into shorting.
Once enough retail traders are short, the big players can take price higher and profit again.
Overall, the composite man is a nice way to think about the market. It simplifies the big players into one group, which makes a lot of sense given they all trade in a similar fashion with the same objectives and strategies.
Wyckoff Market Cycle Theory
The market cycle theory is the centerpiece of Wyckoff’s method.
Based on his laws, the theory states that every financial instrument follows 4 key stages, one after the other, which together create a full market cycle.
The stages are as follows…
Stage 1: Accumulation
Stage 2: Markup
Stage 3: Distribution
Stage 4: Markdown
Each stage has a cause-and-effect relationship with the other, and represents a different state taking place in the market.
Let’s look at the stages in more detail…
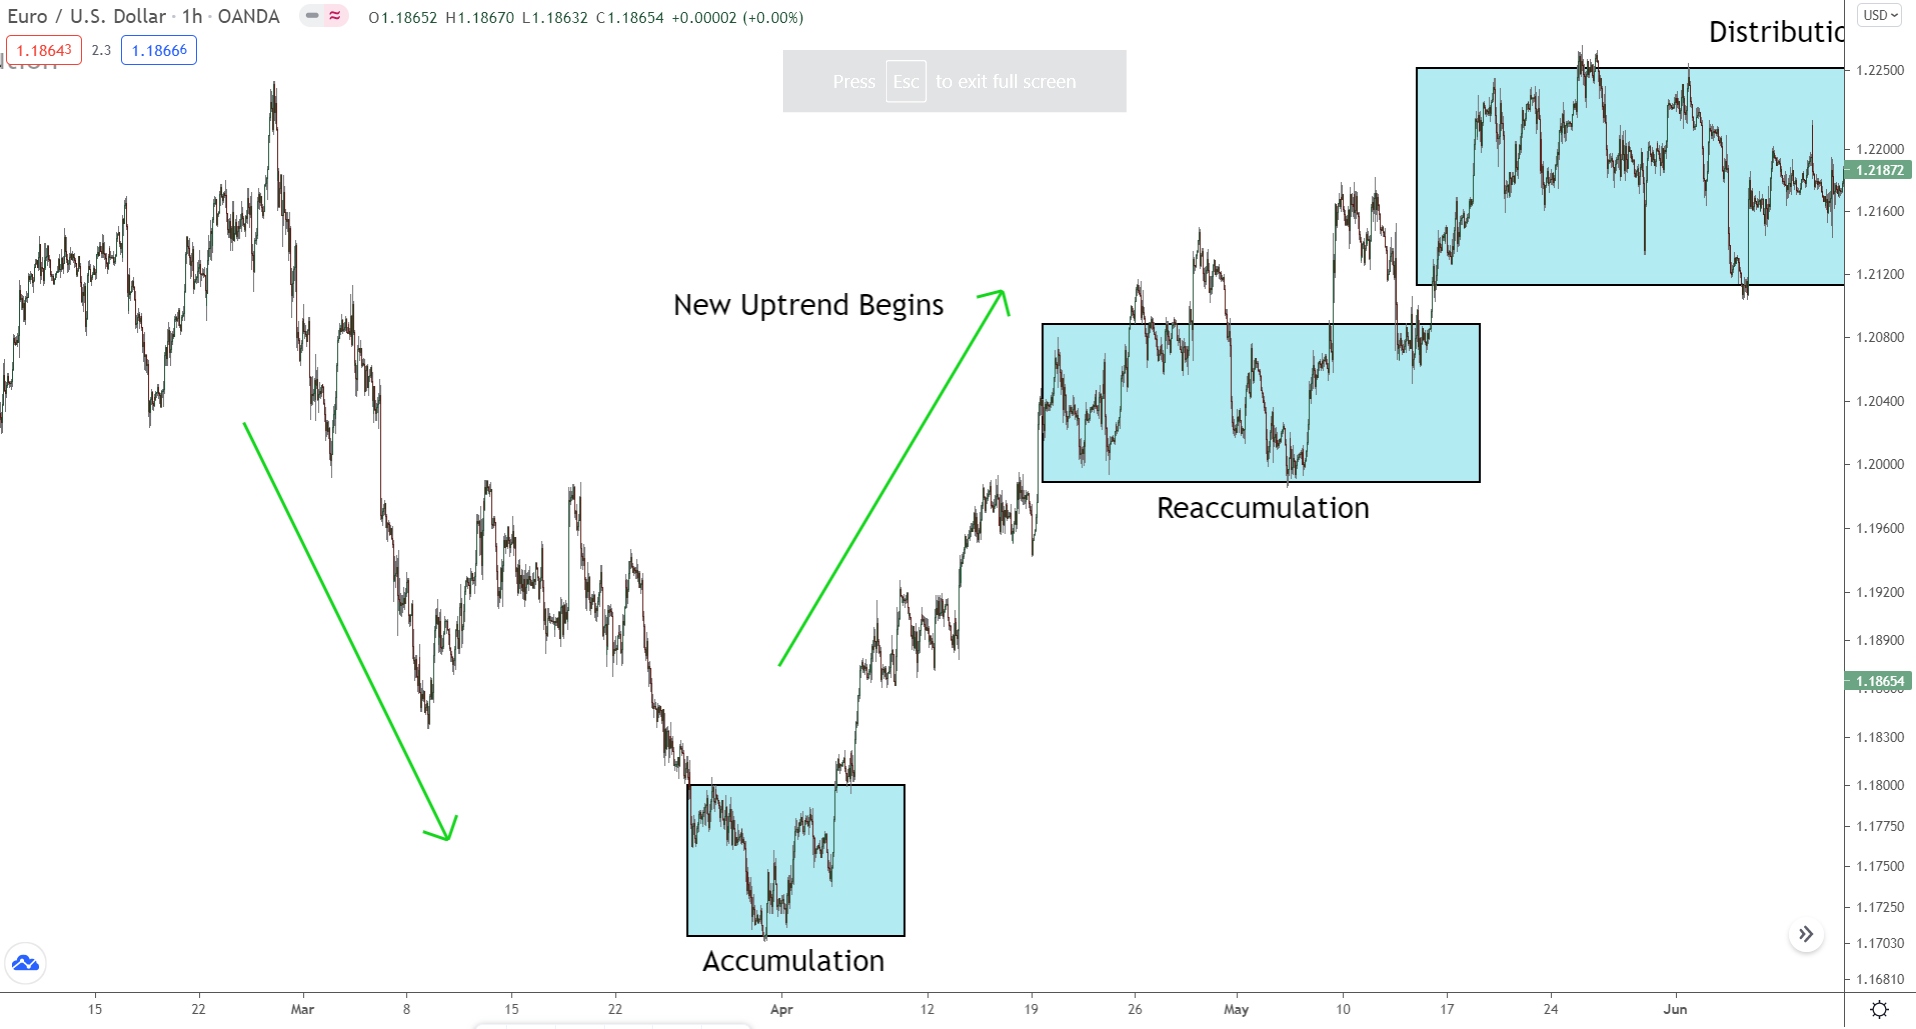
Stage 1: Accumulation Phase
All cycles begin with the accumulation phase. This is where the big players begin to buy up the bears to initiate a new uptrend. On a chart, the accumulation phase always appears as a protracted consolidation, with no discernible direction to speak of.
Here’s an example…
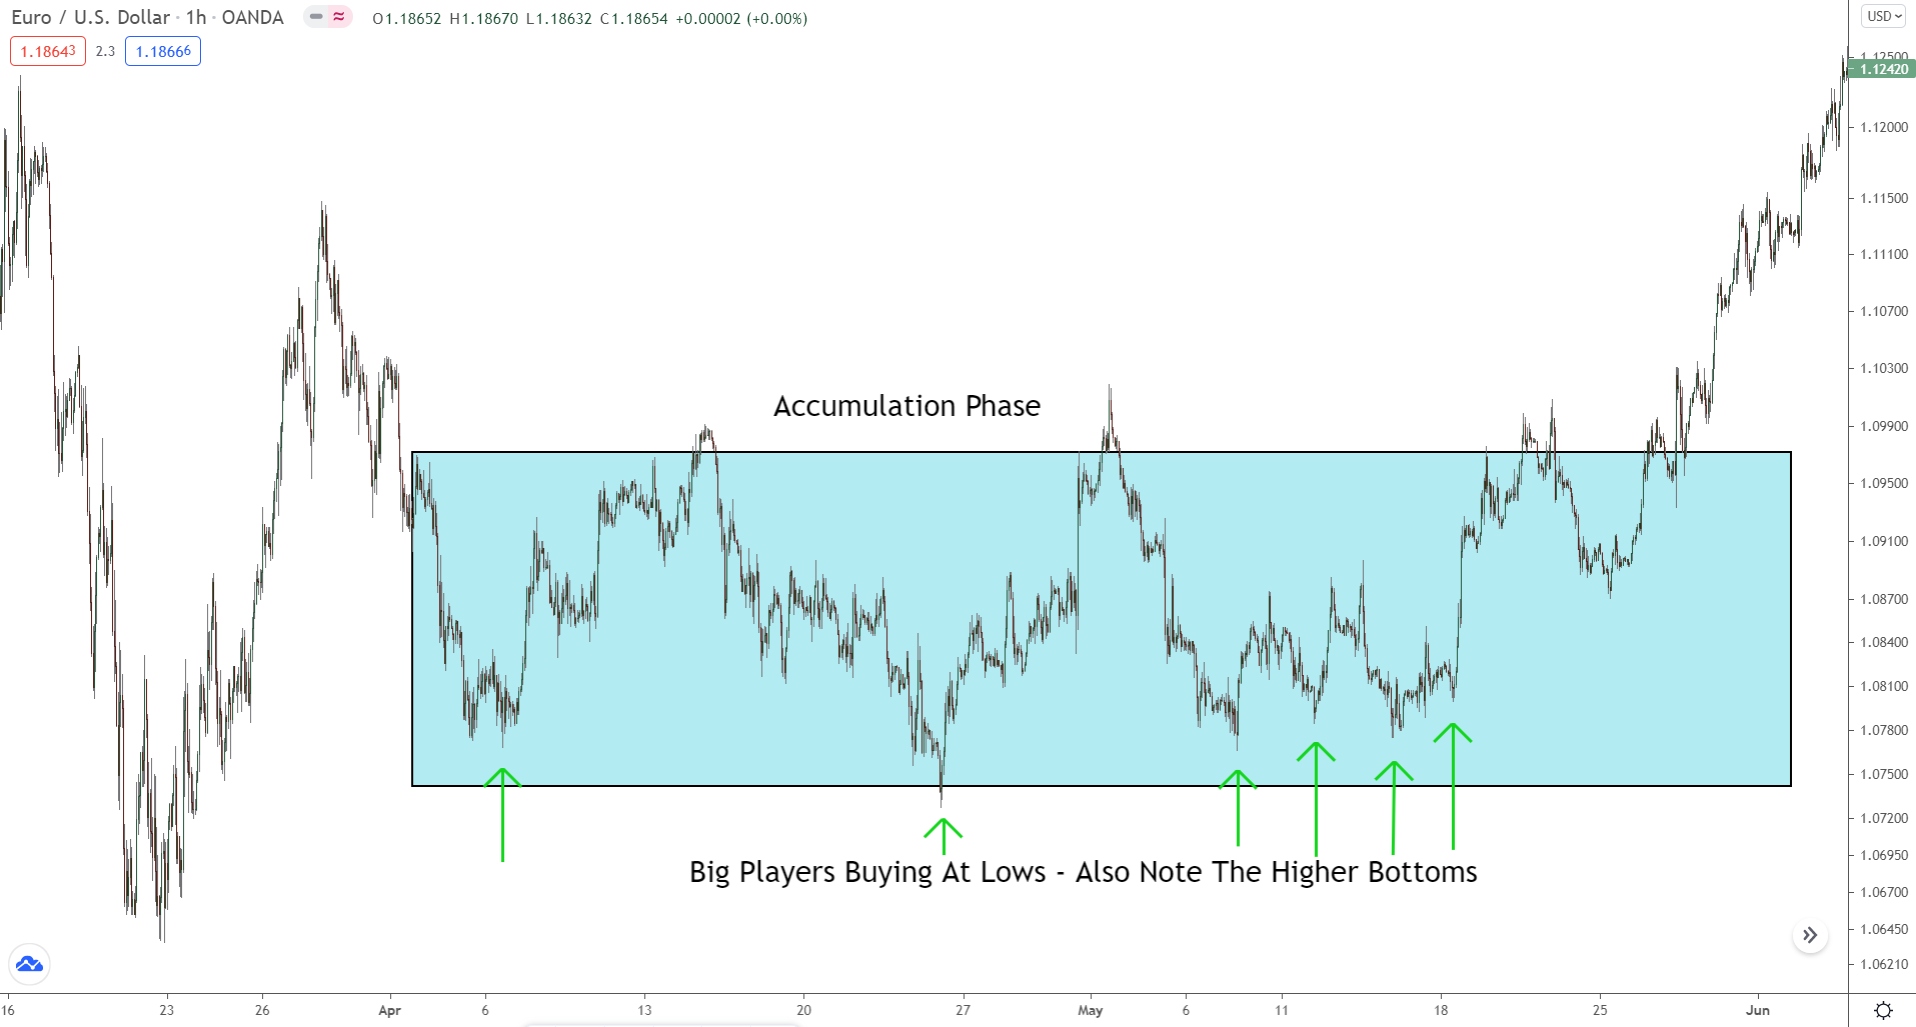
This is the accumulation phase on the 1 Hour chart of Eur/Usd.
As you can see, it’s a consolidation – nothing out of the ordinary.
But that’s only how it seems on the surface…
Behind the scenes, the big players are buying from all the bears entering due to the downtrend and building a massive long position to set off a new uptrend. Price consolidates because the big players buy gradually, so other traders don’t catch on to their plans.
To spot accumulation, watch for two signs…
#1 a long preceding downtrend/down move.
Accumulation always initiates a new uptrend, which only happens after long downtrends.
Once everyone trades in the same direction, the big players can’t make money anymore.
With long downtrends/down moves, most traders are short. The longer the downtrend/down move, the more who are short. So, if consolidation follows an especially long downtrend, chances are its accumulation for a new uptrend.
#2 higher bottoms within the range.
Higher bottoms (lows) in the consolidation often suggest the big players are accumulating. Especially if they form at similar prices. Due to their size, the big players usually split their trades into smaller chunks to place them without upsetting price too much.
On a chart, that often appears as lows forming at similar prices.
Each low being a new trade, only placed at separate times.
If you see multiple lows form at similar prices, accumulation is probably beginning.
Stage #2: Markup Phase (Uptrend)
Stage 2 of the Wyckoff cycle, the mark-up phase always follows the accumulation phase. Here we see price break out of the consolidation and begin rising, creating a new uptrend. The big players have now revealed their hand and expect higher prices.
The markup phase is characterized by higher highs and higher lows – like all uptrends – interspersed with smaller accumulation phases.
You can see this below…
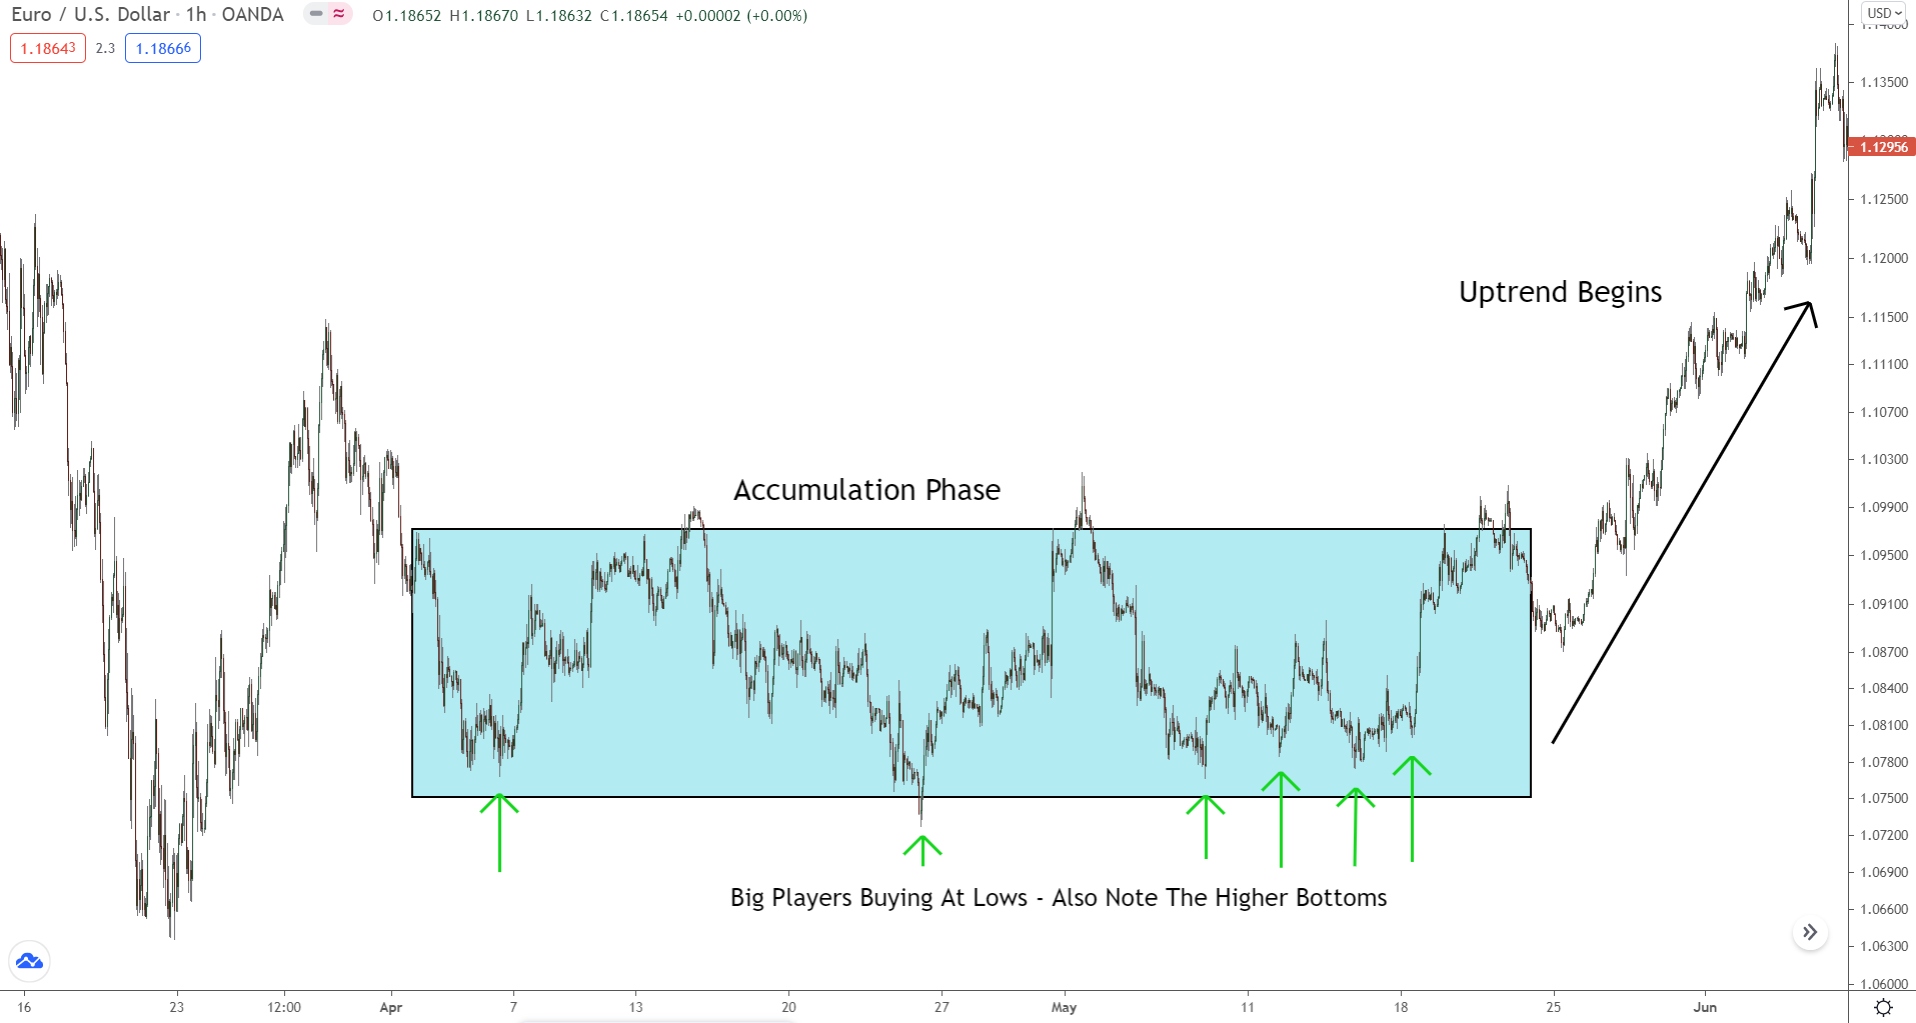
After the accumulation phase, price breaks higher.
The uptrend is now underway, and we see smaller accumulation phases.
With forex being fractal, the Wyckoff cycle occurs on all timeframes simultaneously.
In other words, the overall cycle seen above consists of smaller cycles on the lower timeframes. Together, the cycles create each other, leading to the uptrend we see. That’s what the tiny accumulation phases are – the smaller cycles completing.
During the markup phase, we also see a shift in psychology…
The breakout signals to normal traders a new trend may be beginning.
Many begin jumping in long, which pushes price higher.
The banks start to profit, and more traders enter long.
As the new uptrend continues, more traders become aware of its existence. For the big players, this creates a problem because they can only profit if most other traders are losing – as forex is zero-sum; the losers pay the winners.
This is where we sometimes see the re-accumulation phase.
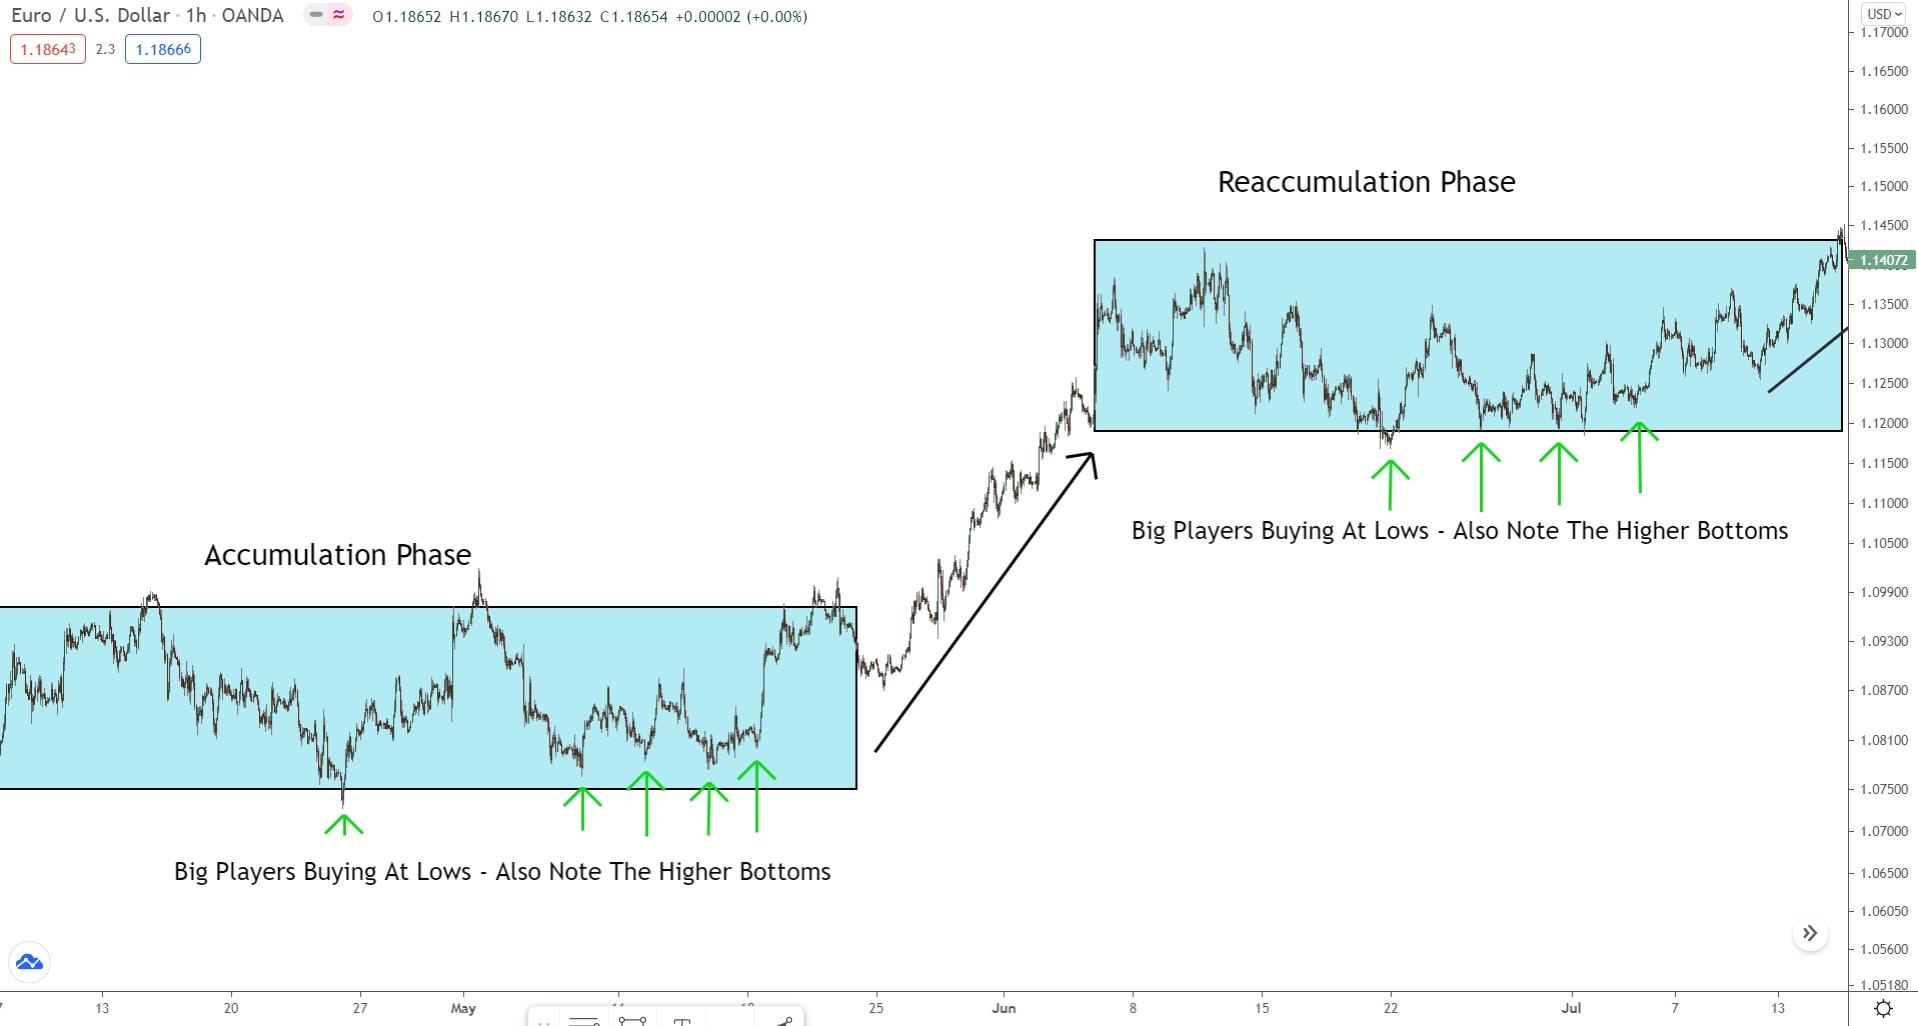
In this phase, the big players cause another accumulation phase to #1 confuse the market, and #2 add more buy positions for the next phase of the trend.
They take profits; price begins to consolidate.
The longs begin to close; price isn’t heading higher anymore.
When the longs close, they use sell orders. The banks use these sells to gradually place their own buys until eventually, price breaks higher, and the new uptrend begins.
Now the process repeats itself all over again.
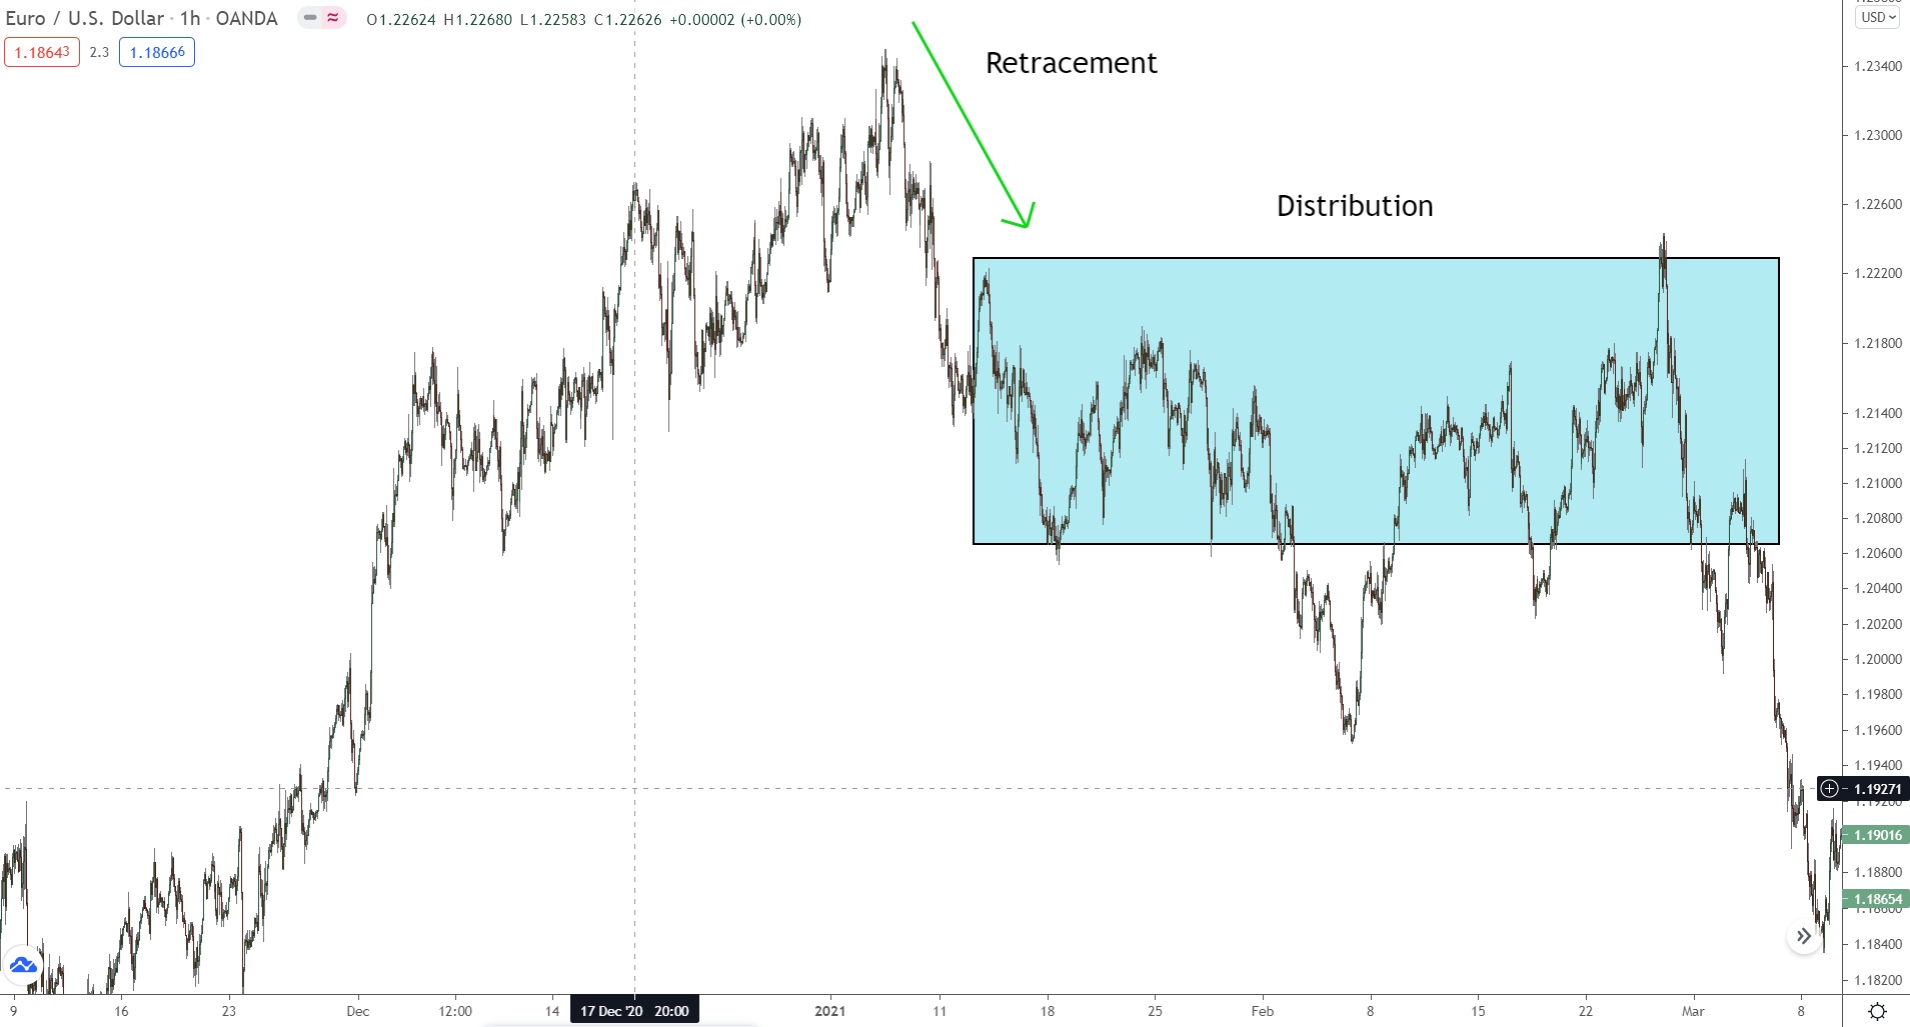
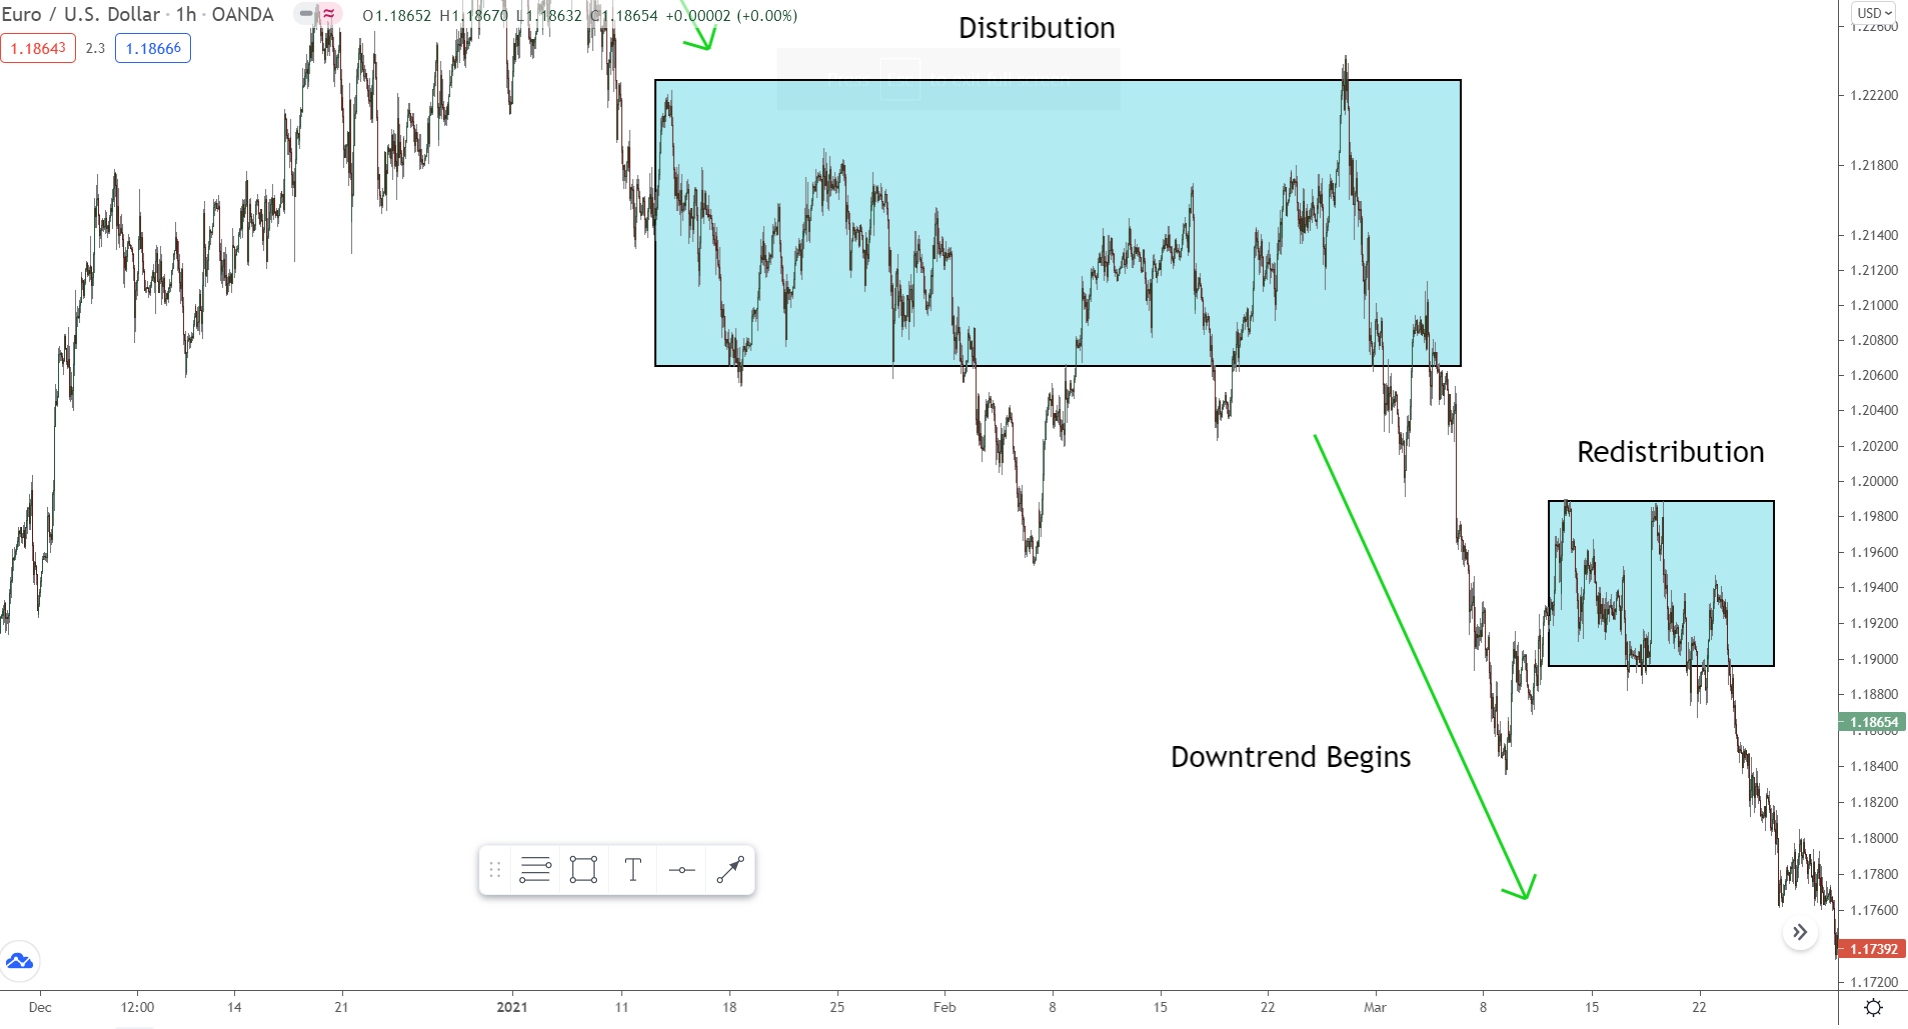
Stage #3: Distribution Phase
Okay, here’s where things get tricky…
After the markup phase (uptrend), we always see a distribution phase. This is where the big players distribute (take significant profits) off their trades, causing a consolidation to form.
Here’s an example…
Now, since the banks are taking profits, the distribution phase can lead to two different cycle outcomes:
#1 A Markdown Phase
#2 Another Markup Phase
We don’t know why the banks are taking profits; maybe they don’t think the trend will continue, or maybe they expect price to retrace slightly. So, we can never say for sure which cycle outcome will follow the distribution phase.
That said, there are signs…
For one, the big players will only initiate a trend reversal if they can no longer profit.
Remember, the longer a trend exists, the more traders who catch on and enter the same way.
That’s a problem, because…
If everyone trades in the same direction, the banks can’t profit anymore; they need losers!
Being zero sum, the only way to profit in forex is from others losing. When everyone trades the same way, most aren’t losing anymore, so the banks can’t profit. They must end the trend and take price the other way.
With that in mind, we know if a distribution phase begins after a long uptrend, chances are a trend reversal could be near.
Rather than see a continuation (markup phase).
We’ll instead see a downtrend begin (markdown phase).
And usually, this is the case…
The distribution phases often results in a new downtrend.
We see a trend reversal rather than a trend continuation.
The distribution structure can also provide clues:
Normally, the consolidation will fail to create higher bottoms, with lower tops also appearing – both tell-tale signs a sell-off is taking place.
Stage #4: Markdown Phase (Downtrend)
And finally, we come to the last stage of the Wyckoff cycle: Markdown.
Beginning immediately after the distribution phase, during markdown, we see price reverse and set off a new downtrend. The big players couldn’t profit from the prior trend continuing, so they took price the other way.
Like all downtrends, the mark-down phase is characterized by consistent lower highs and lower lows, showing a gradual decline in price over time.
Here’s how it looks…
Again, see how more mini consolidations appear during the trend?
These are tiny accumulation/distribution periods on a smaller scale.
The Wyckoff cycle is factual; the cycle on one scale (timeframe) forms due to the same cycle on a lower scale (smaller timeframe). The downswing marked with an arrow, for example, forms due to the stages occurring on a lower TF.
Eventually, the markdown phase ends…
Now, we see the entire 5 stage process begin again:
Accumulation (consolidation)
Markup (uptrend)
Distribution (consolidation)
Markdown (downtrend)
Understanding Wyckoff’s Schematics
To accompany his method, Wyckoff came up with accumulation and distribution schematics, which break down the accumulation/distribution phases into smaller mini phases. You can use these to better understand the two states and time when to enter.
5 mini phases exist, beginning with A and ending with E.
Each occurs one after the other, part of the cause-and-effect law.
Alongside these, we also see Wyckoff events – price movements designed to achieve a specific goal within the accumulation/distribution phase.
Let’s look at the schematics now…
Important Note:
Wyckoff’s schematics come in many forms and guises.
Below are the two most popular and common schematics. While most accumulation/distribution stages will follow the basic structure seen in these, no two will ever look alike; some features may appear at different times or not show at all.
In these cases, use the elements present in schematics to track price and understand what’s happening during the stage.
For example:
During all accumulation/distribution stages, you’ll usually see a buying climax (BC).
Usually, that’s followed by an automatic rally/decline depending on the stage type.
Now, the buying climax may not happen in the same spot every time.
However, by understanding what it looks like and the effect it produces – a sharp rise – you know the expected result when it forms and can determine what’s currently happening in that accumulation or distribution stage.
Accumulation Schematic Breakdown
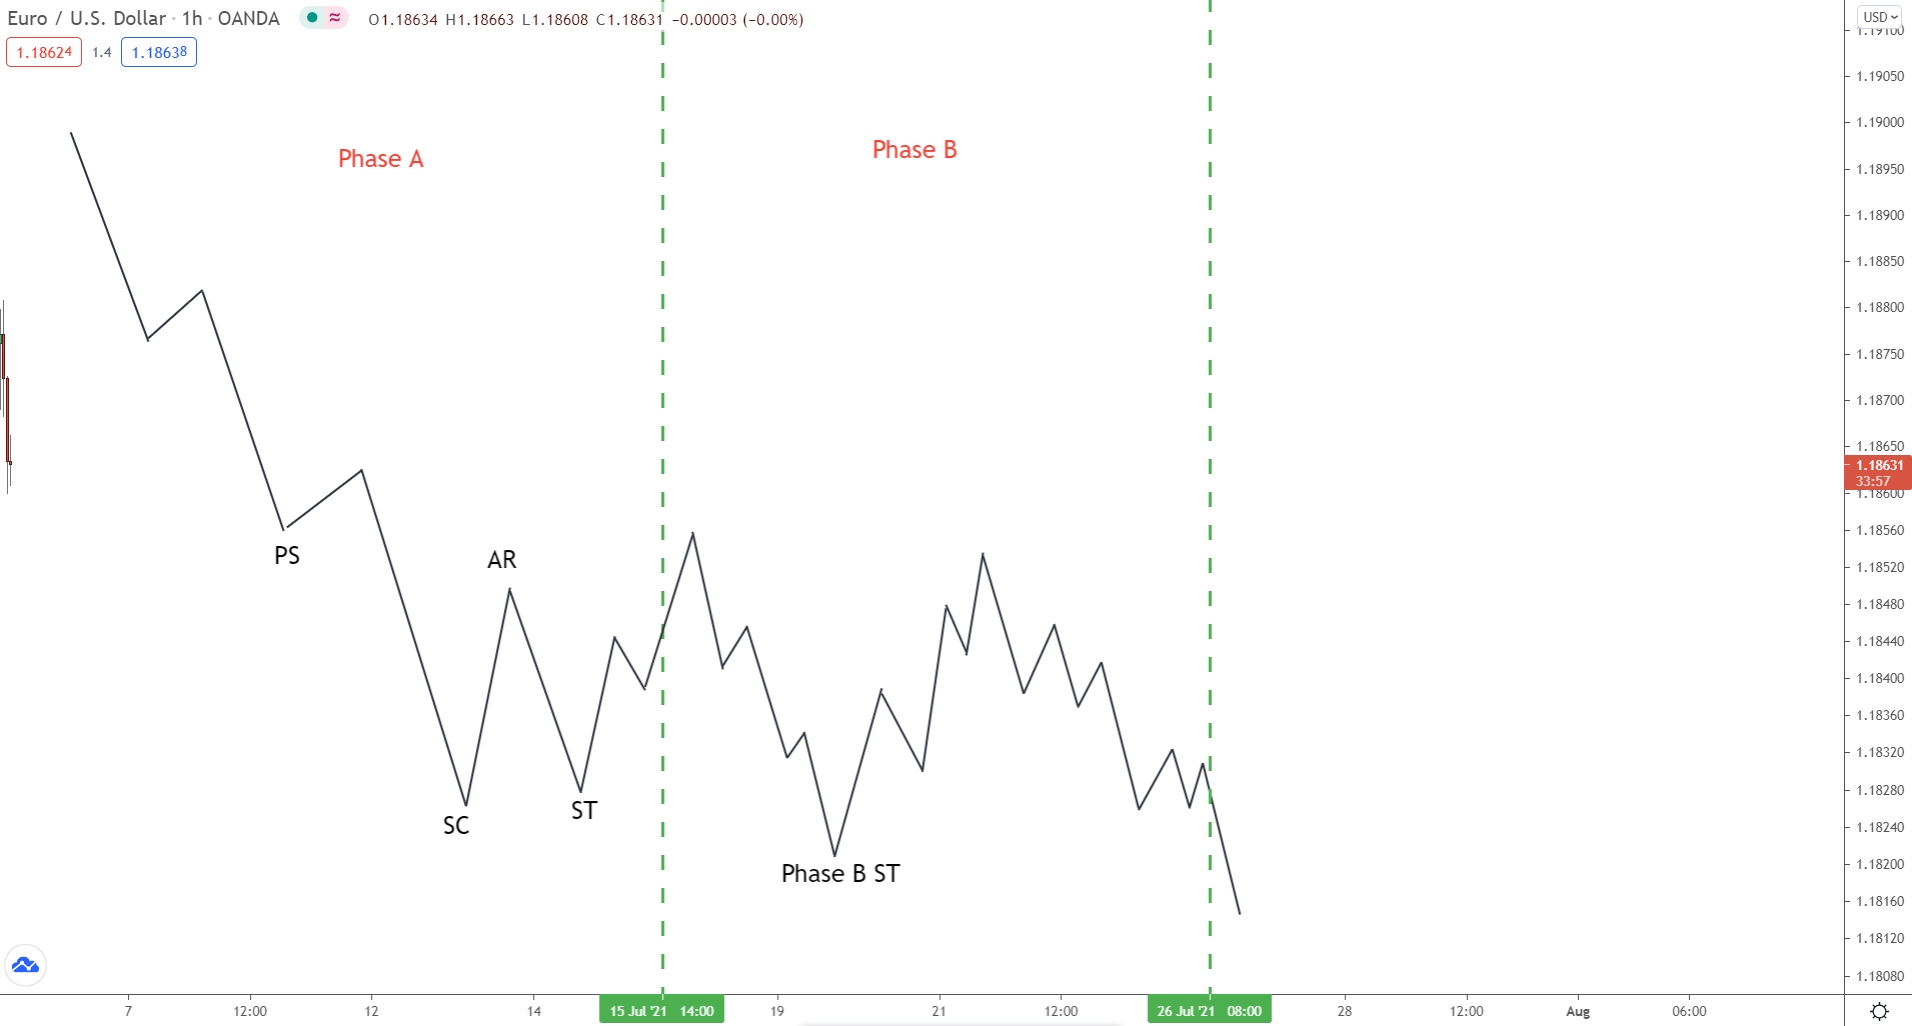
Phase A
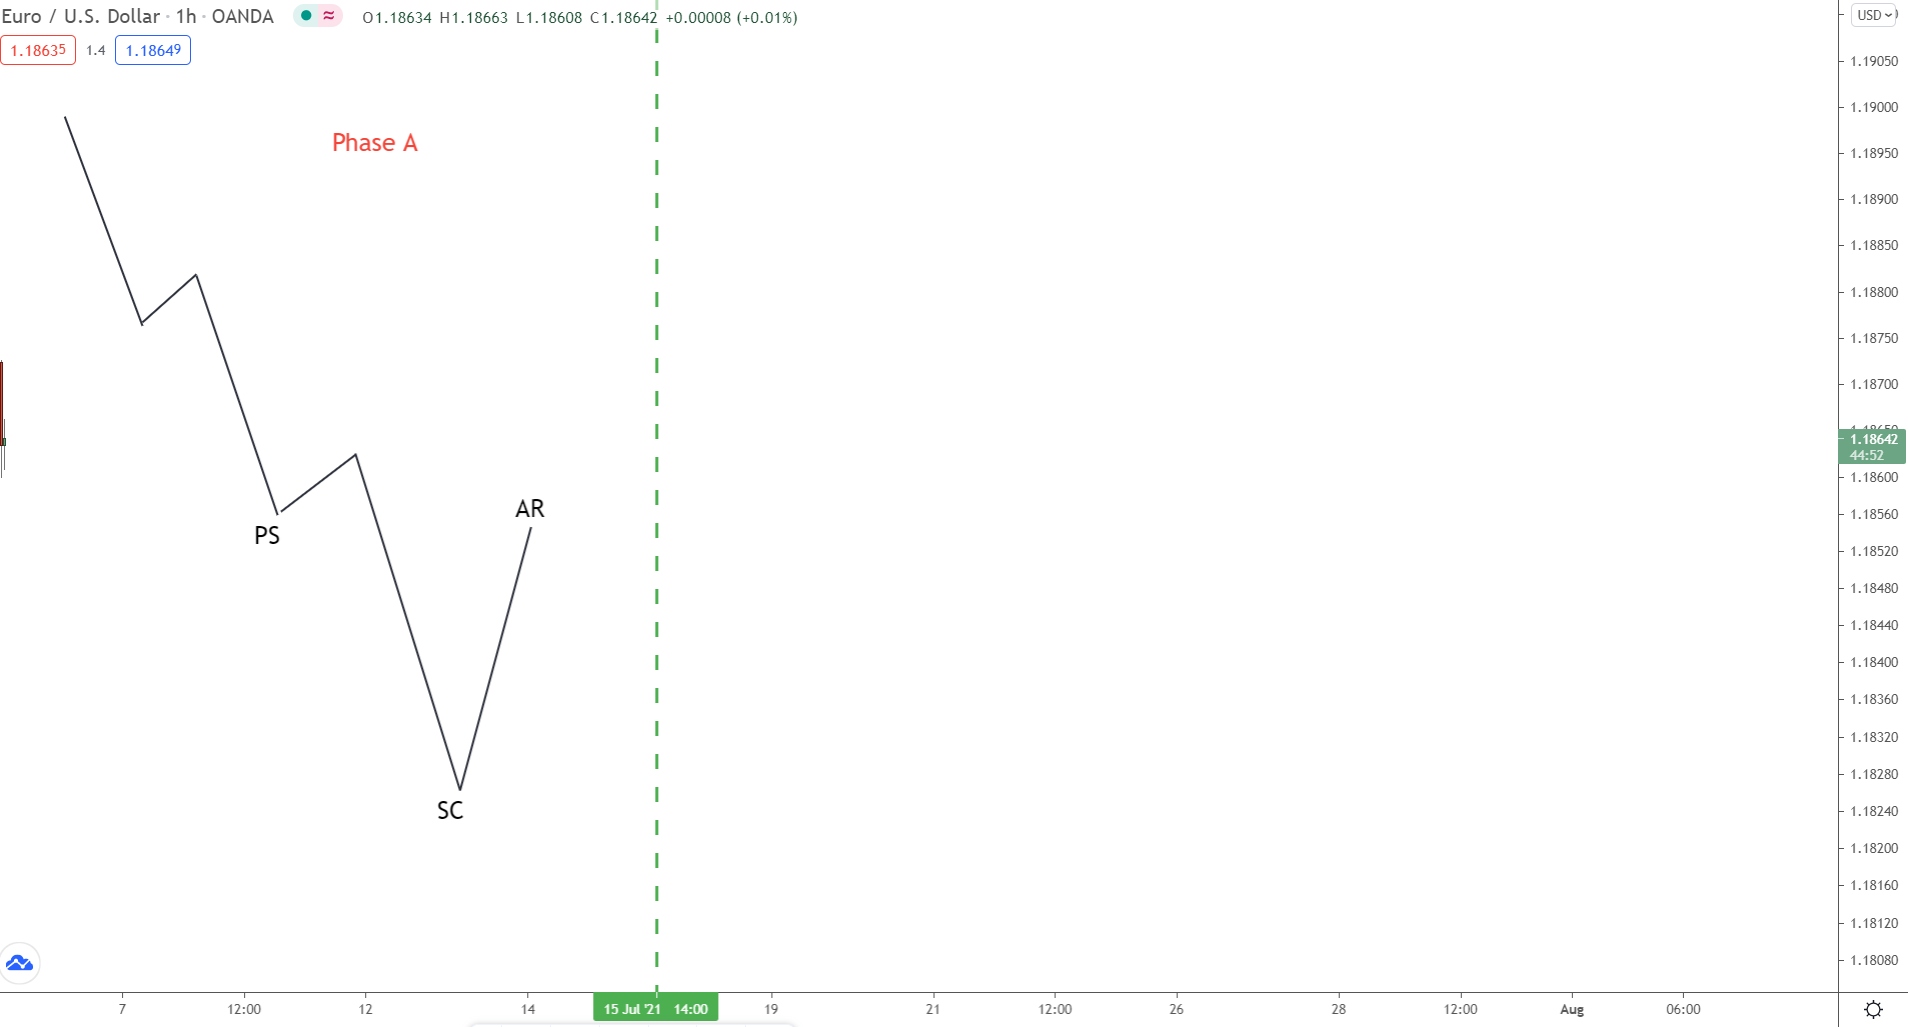
During phase A, we see the selling pressure decrease. Price, which has been in a long downtrend, starts to slow, with more buyers now entering. Evidence for this appears at preliminary support (PS) – a small retracement created by buyers jumping in.
To most traders, the trend looks set to continue.
But some clues are starting to appear that suggest a reversal.
After another swing lower, price reverses.
This creates a low called the selling climax (SC).
Marked by intense selling activity, the selling climax shows the sellers pushed price lower but came up against inspired buyers. During the whole move, the buyers and sellers battle for control.
The result being especially high volatility – big candles/wicks and high volume.
Ultimately, price does fall…
However, it took so many sellers that none are around to sustain the move.
That’s why we see the SC form followed by an accelerated move higher (AR).
The AR begins because the buyers bought up all the sellers during the climax. The sellers thought they were winning, but they weren’t!
The buyers (big players) were just using their sell orders to buy for their own purposes.
Once the sellers were bought up, price could only rise – no sellers were around!
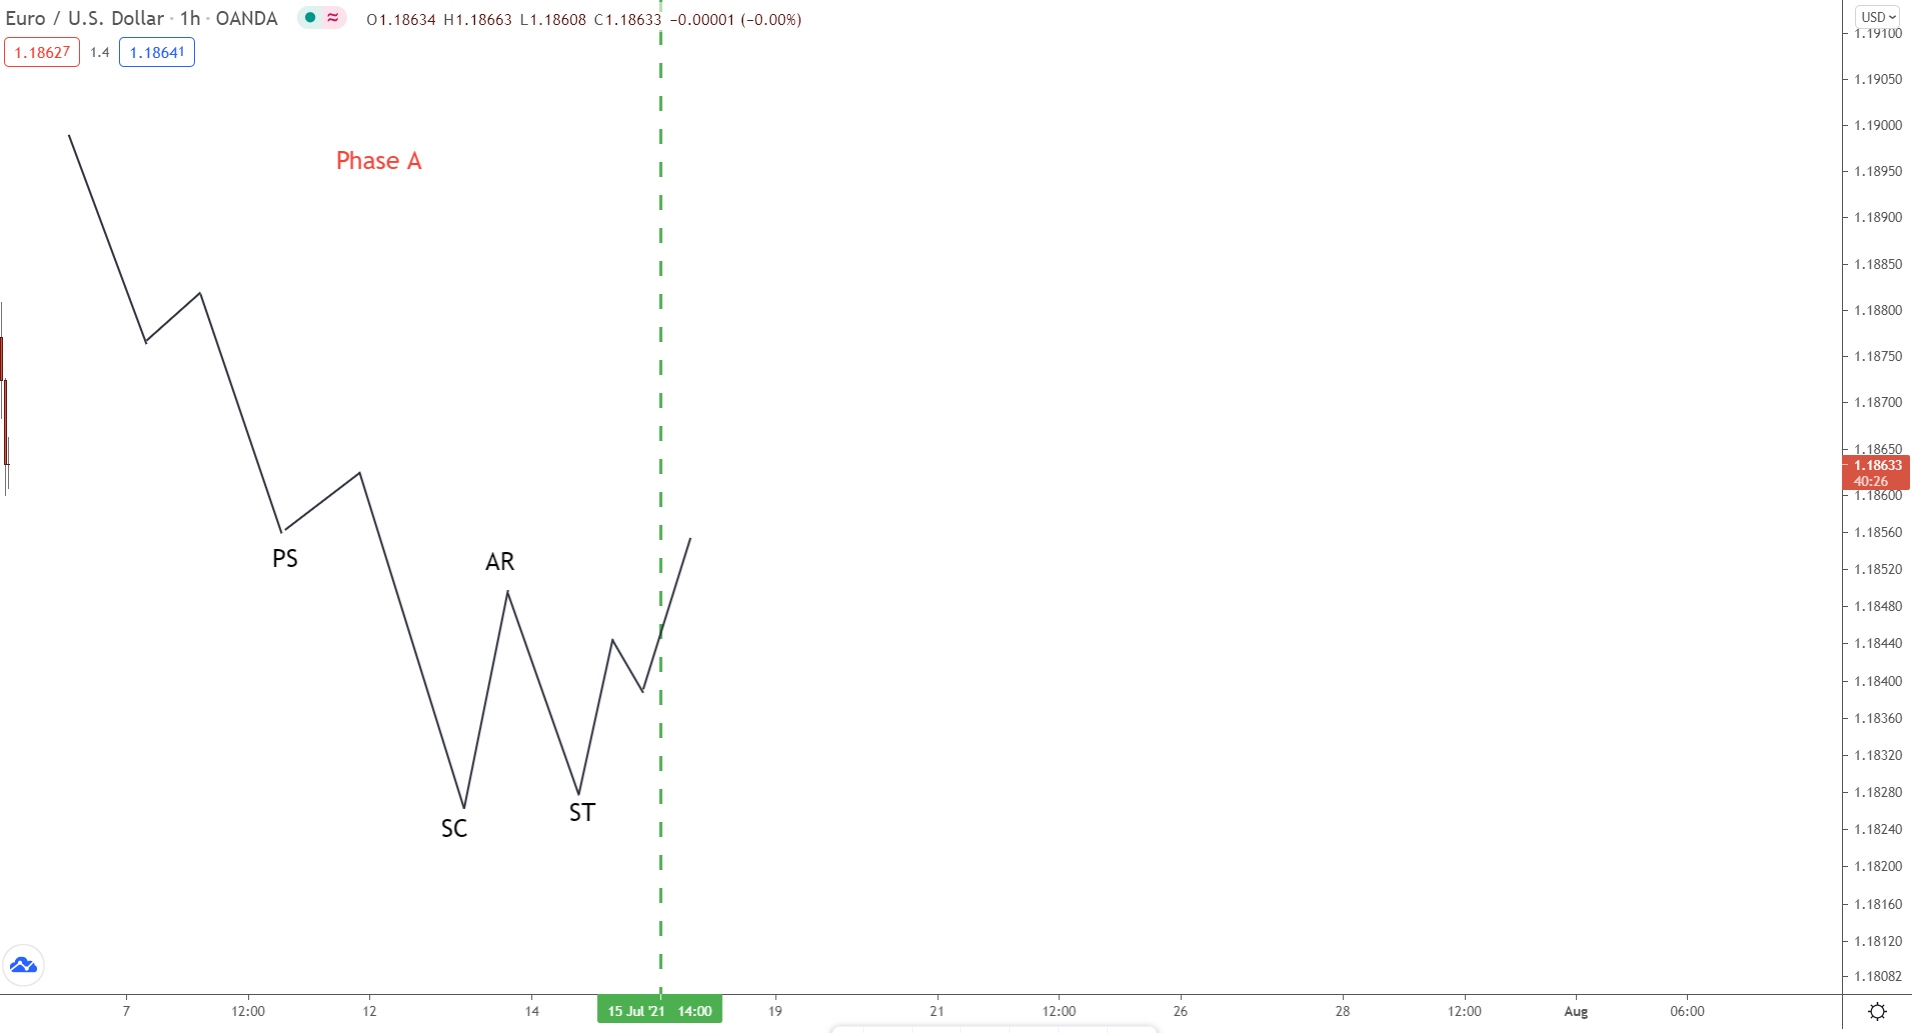
After the automatic reaction (AR), we see another decline.
Known as the secondary test (ST), this decline probes how many sellers still exist and, by extension, if the downtrend could continue.
Compared to the (SC), the secondary test will usually (but not always) form a higher low. The volume and general volatility will also be lower, with smaller candlesticks appearing and lower volume on bearish candles.
Onto phase B now…
Phase B
In phase B, we see the consolidation begin.
Now the accumulation gets underway, and the big players start gradually building a large buy position to initiate the mark-up phase later. In Wyckoff’s laws, the consolidation (accumulation) is the cause that leads to the effect (markup).
Key Point…
During phase B, multiple secondary tests (ST) will take place – they must!
The big players can only buy when others are selling, i.e when the tests occur.
Each test represents them entering another small trade for the mark-up phase.
These tests come in many varieties; some create higher lows, others lower lows.
However, the one constant between them…
ALL will form at similar prices.
This is so the big players can replicate entering one trade at a single price.
Most of the time, that’s not possible – they never have enough sellers free.
To compensate, they enter multiple small trades at similar prices – that simulates entering one big trade at a single price.
Phase C
Phase C is where we see the initial signs a markup phase could be near, owing to the fact a spring usually pushes price below the consolidation low.
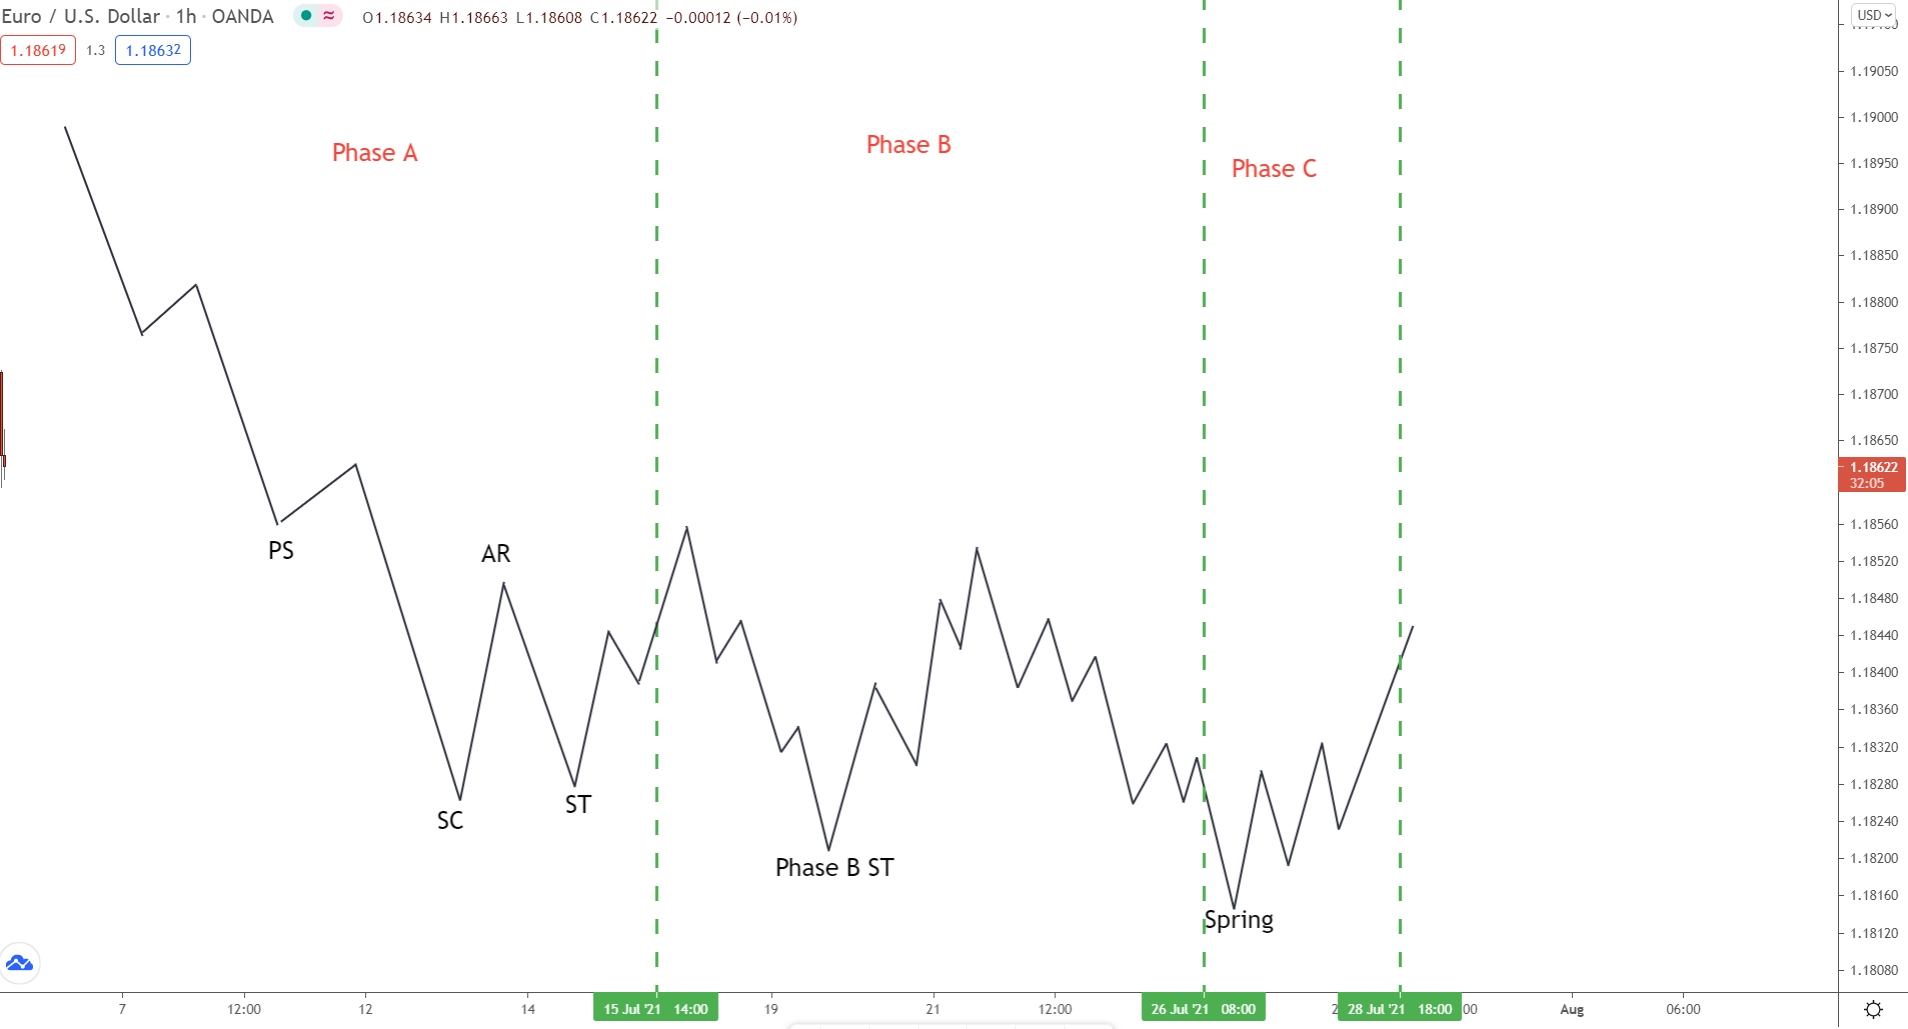
In Wyckoff’s studies, the spring is basically a bear trap designed to shake out any leftover shorts and trap them into fueling the incoming markup phase. When price breaks lower, the shorts jump in – they think the downtrend is resuming.
The big players then buy, causing price to rise.
The shorts are now trapped in losing sell trades.
The only way they can exit these trades is by closing, which means they must buy.
If thousands of traders unknowingly buy, what happens to price?
It rises! Price drives higher!
That’s what happens after the spring completes – the trapped shorts close via buying, resulting in a sharp move higher.
The whole point of the spring is to trap, stop out, and mislead traders.
The big players use the opportunity to enter massive buy trades. The shorts jumping in and longs being stopped out provides them with masses of sell orders, which they use to buy with. It is a final way to flush out any weak holders before the new uptrend begins (markup phase).
Keep in mind:
Even though the spring is important, it’s not essential…
Sometimes, price will continue to consolidate, and no spring will form.
In these cases, another accumulation schematic could be underway. The spring might not feature, but the phases and order they occur will be identical.
Phase D
Phase D is where we see really see the ball get rolling.
Here, the transition between the accumulation and mark up phase begins.
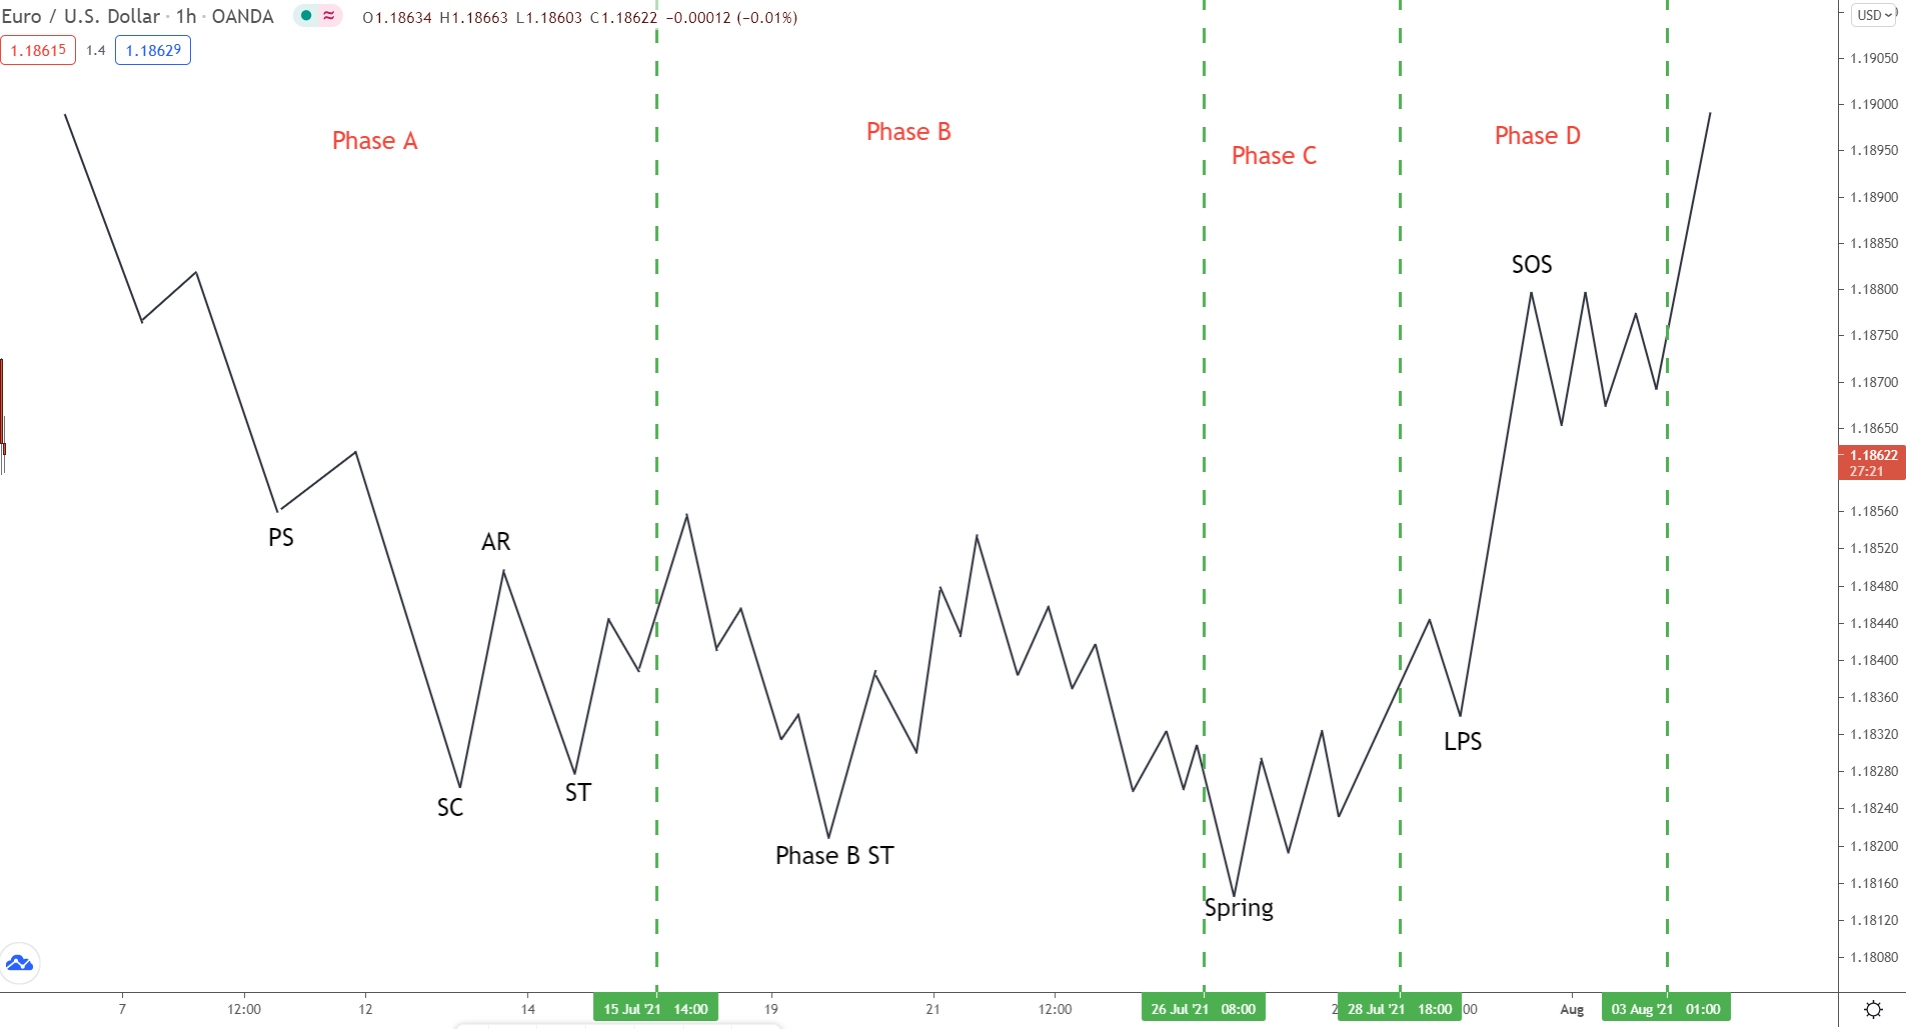
We see a sharp rise from the spring, usually accompanied by a notable increase in volume. Big candlesticks start to appear, with wicks forming underneath – a sign bulls are eager to buy whenever lower prices are present.
Last point support (LPS) will form some way into the move, confirming upside strength and providing support if price falls lower.
Multiple last point support levels can (and will) form during the rise.
These normally appear right before price breaks a resistance level, acting as support.
The break of these levels creates higher highs, further signs of strength (SOS) for the move.
Phase E (Final Phase)
And finally, phase E.
Here we see the full transition from the accumulation phase (consolidation) to the markup phase (new uptrend).
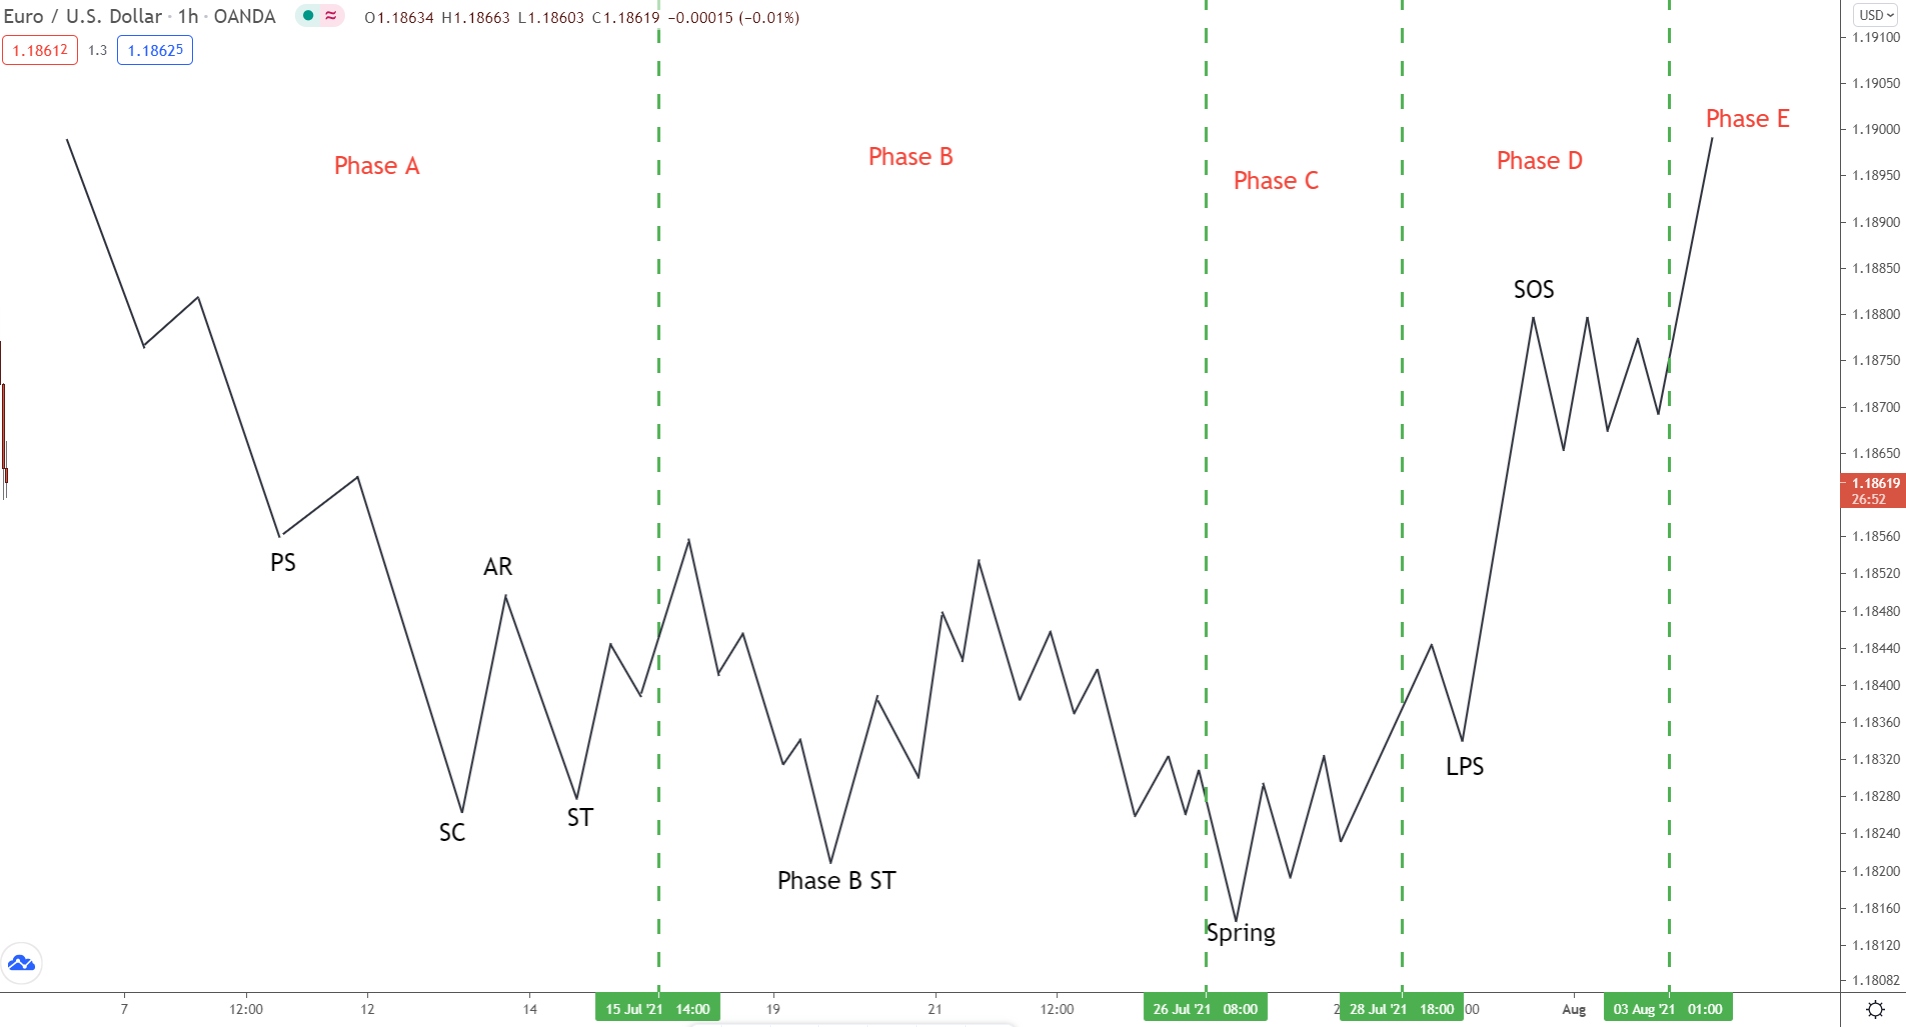
Once price breaks out of the consolidation, the markup stage is considered underway, and higher highs and higher lows should begin forming.
Now the new uptrend is confirmed, you can begin watching for long entries.
Distribution Schematic
The accumulation and distribution phases are really two sides of the same coin.
Structurally, they are the same, only upside down. Each schematic phase completes the same way but with slightly different terms – rather than beginning with a downtrend, phase A starts with an uptrend, for example.
Here’s a quick breakdown of the phases…
Phase A
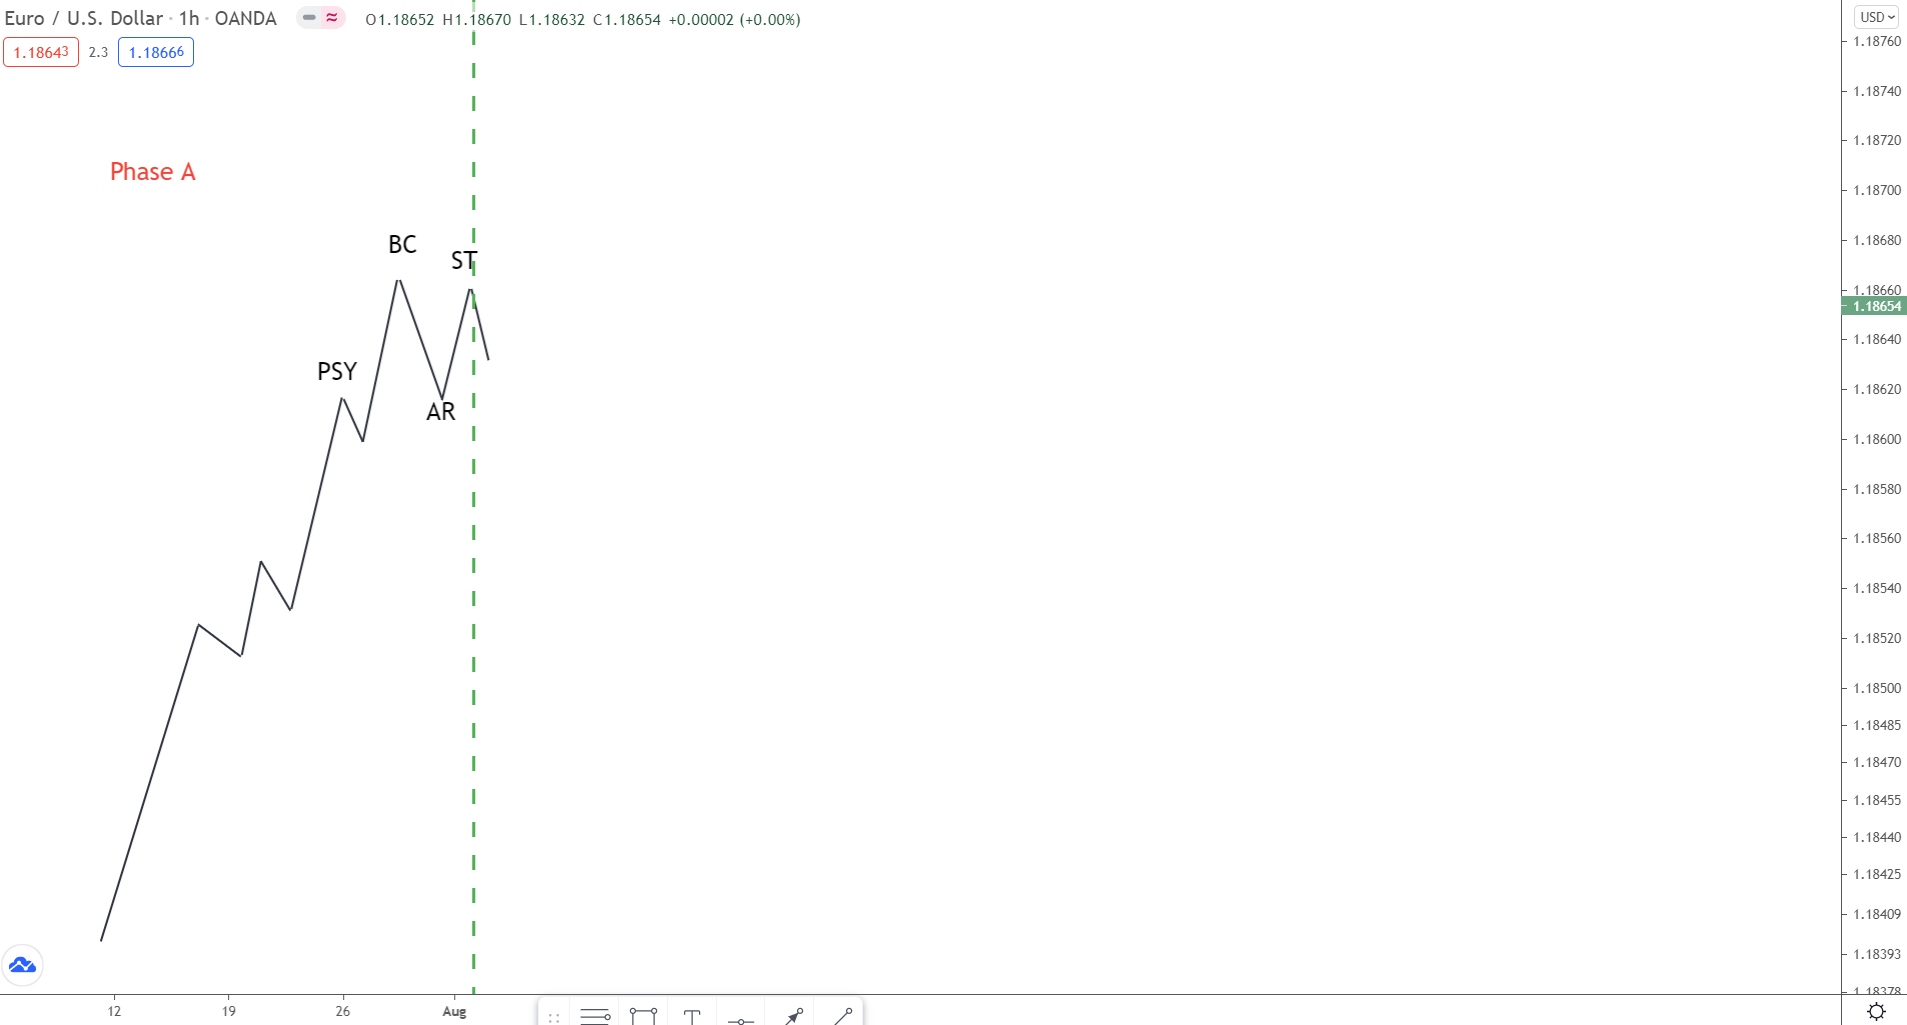
Always coming off the back of a long uptrend, Phase A begins when buying pressure decreases, usually accompanied by a drop in both volume and volatility. Evidence of sellers entering appears at preliminary supply (PSY), but again, this isn’t enough to indicate the uptrend is over.
During the next move higher, we see the buying climax (BC) established.
Here the buyers battle the sellers to push price higher one last time before running out of steam.
The sellers then take control, causing price to fall, resulting in the buying climax.
Volatility and volume will usually increase here.
After the buying climax, price falls sharply.
We call this the automatic reaction.
The huge demand from buyers has been absorbed by the sellers. Not enough buy pressure exists to push price higher anymore. As a result, price must fall to find more willing buyers.
After falling slightly, buyers jump in again.
Now we see a secondary test (ST), culminating around the buying climax.
Again, the sellers absorb the buyers, resulting in price falling.
This is when phase B begins…
Phase B
In Phase B, we see price consolidate as the big players slowly sell their holdings to initiate the markdown (downtrend) phase later on.
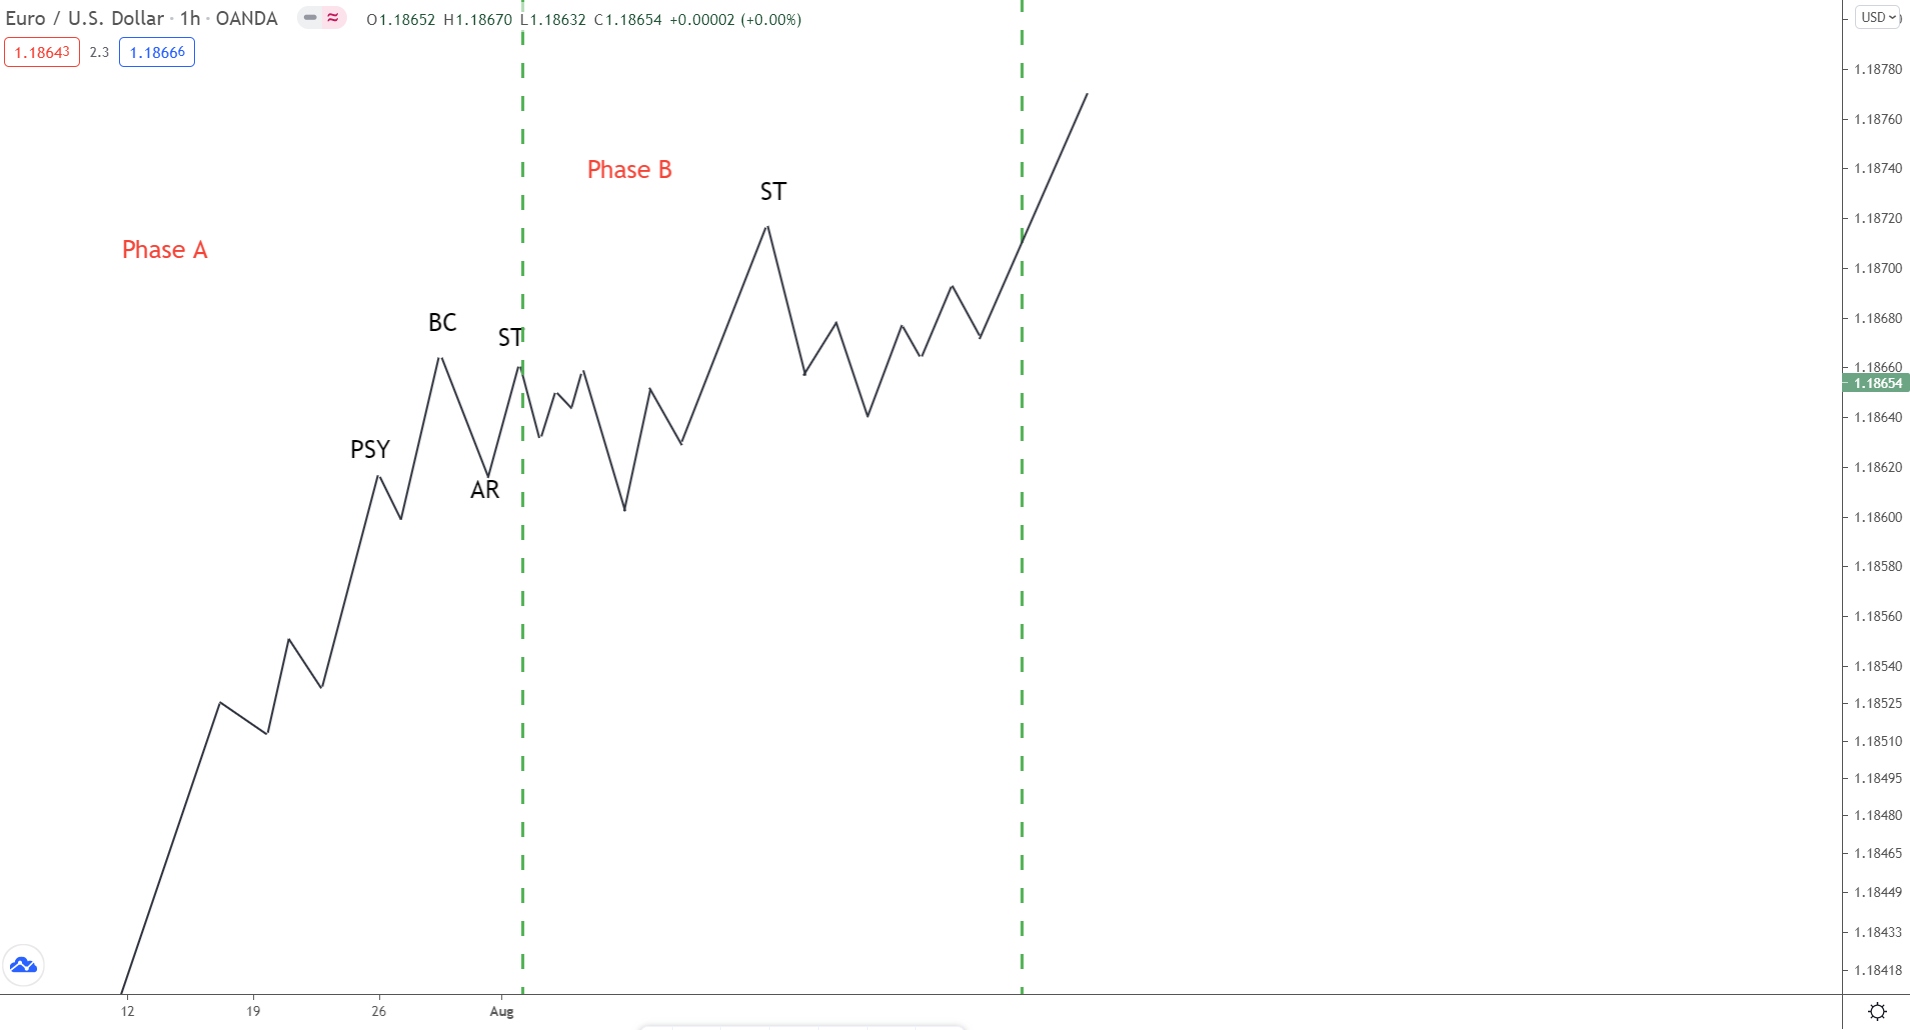
Multiple secondary tests and false breakouts can occur here, with many usually spiking above or below the upper/lower bands of the consolidation. Like all schematics, the structure of these phases will never appear the same but will always follow the same order.
Sometimes, price will spike above the resistance level formed by the BC.
Here, you’ll see an ST form which can also be called an upthrust (UT).
Occasionally, price will also form a supply zone at the secondary test (ST), which can provide a nice short entry into the final phases.
Phase C
Like the accumulation phase, the big players will often initiate one last trap before the final phases get underway. These shake out any last remaining weak holders and allow the big players to enter more sell trades before markdown.
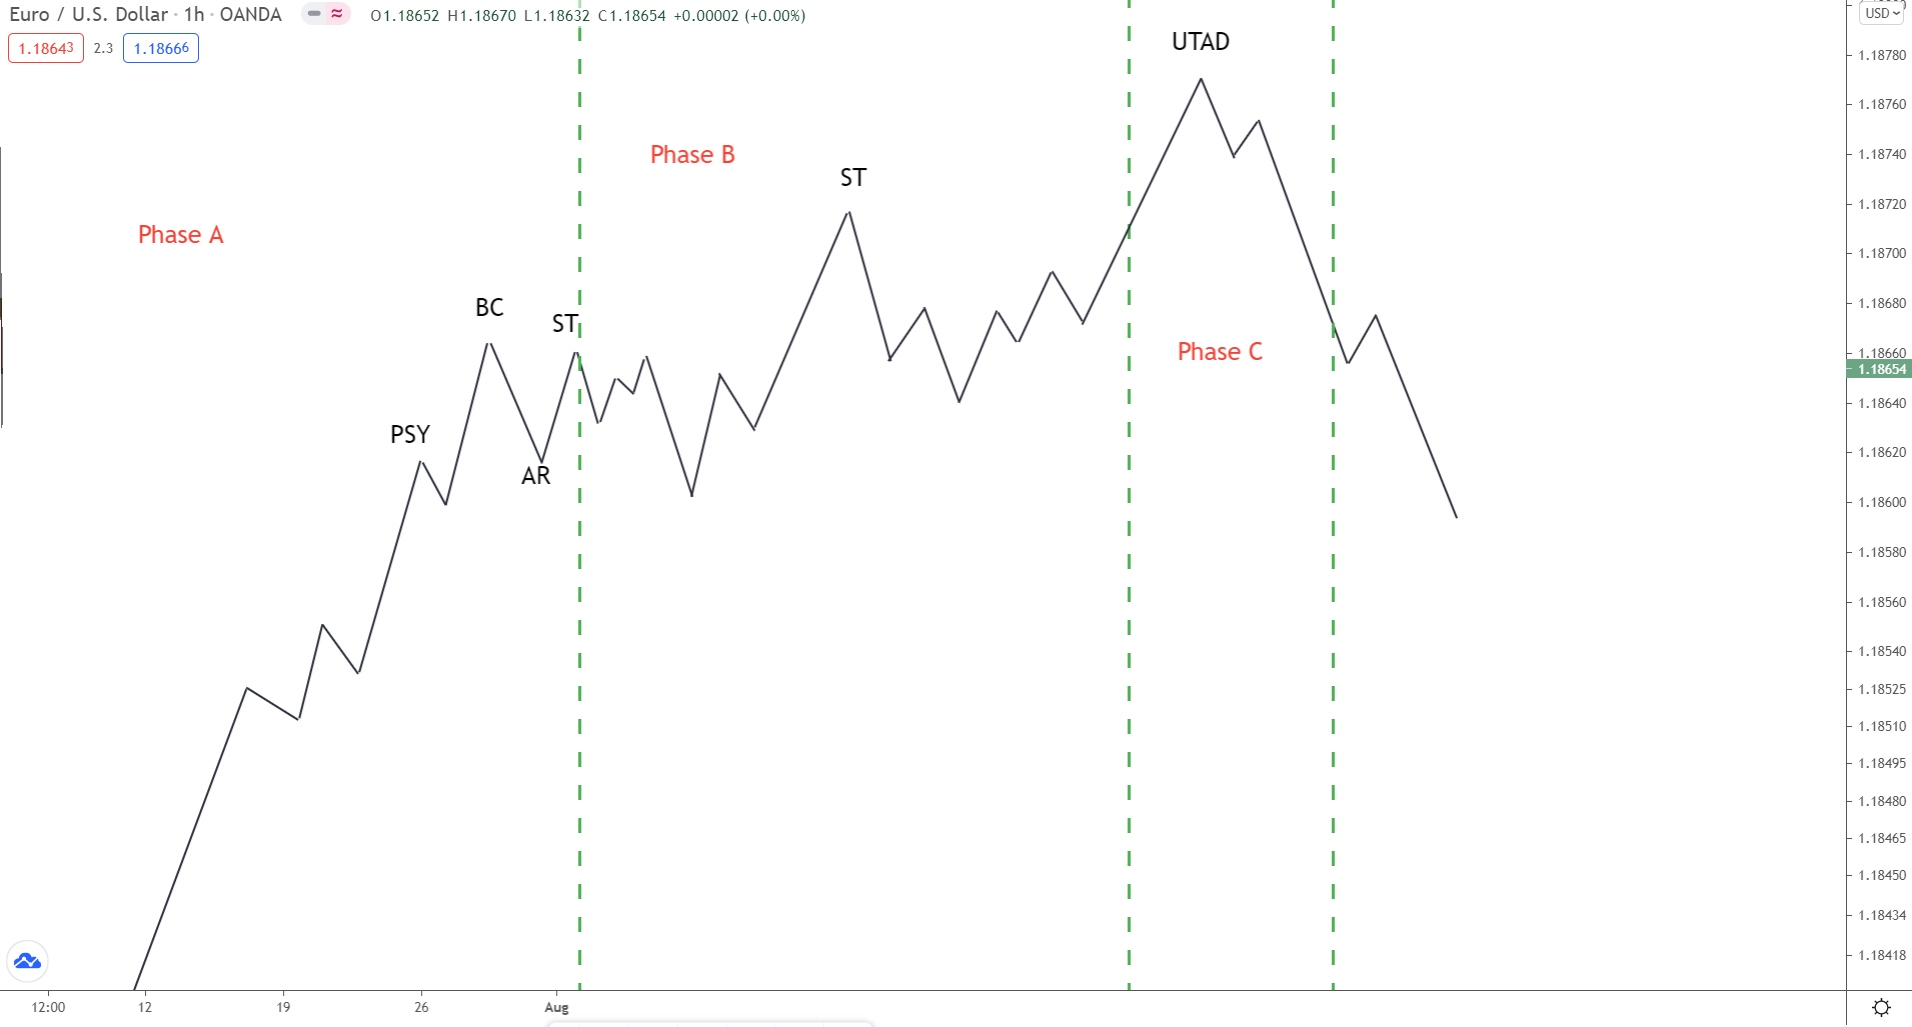
This trap is referred to as UTAD or Upthrust after distribution.
It is the opposite of the spring we see during the accumulation phase.
Phase D
Phase D marks the point where the consolidation ends, and the markdown phase begins.
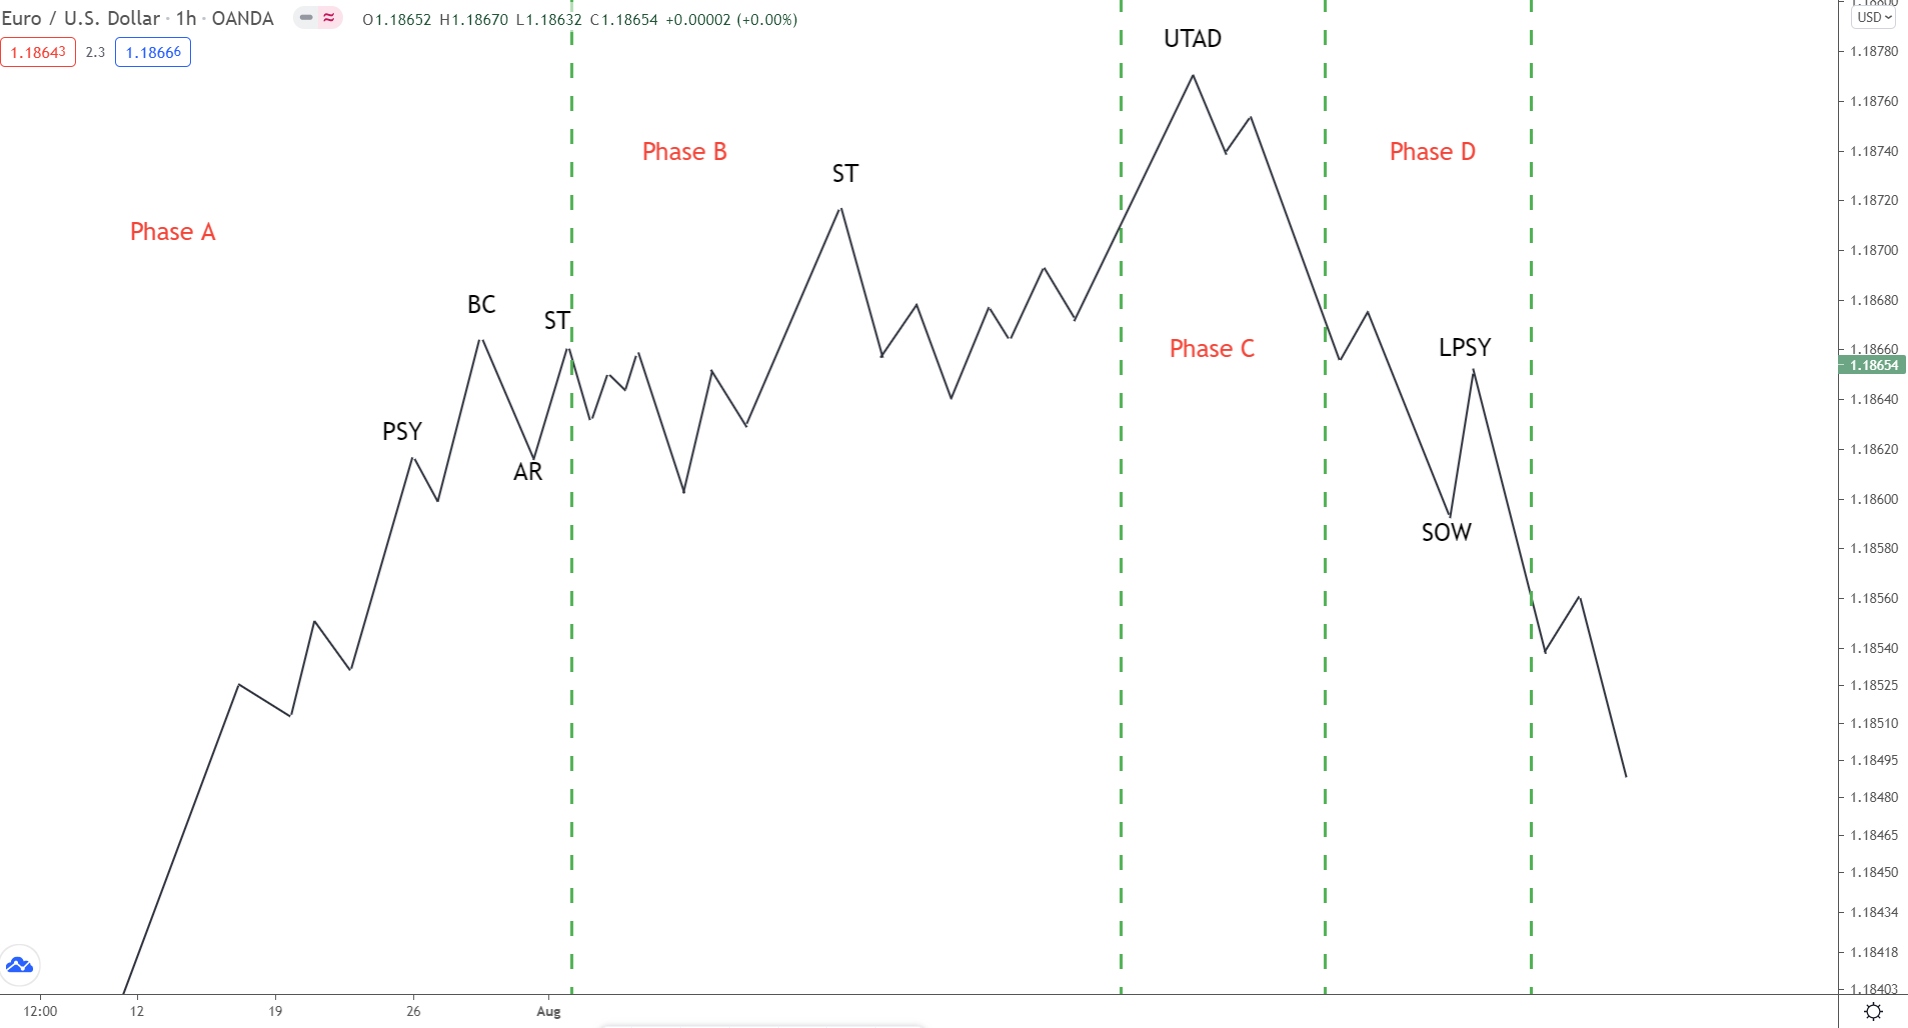
After we see the bull trap (phase C), price starts to fall. Around moving back to the halfway point of the consolidation, the last point of supply forms (LPSY), creating a lower high.
If price rises, this provides resistance to the move higher.
When price moves lower, the move should break the support levels formed by the automatic reaction rises we saw during phase A. This is considered a sign of weakness (SOW) and indicates the markdown phase is likely underway.
Phase E
And finally, we see phase E – the beginning of the markdown phase (downtrend).
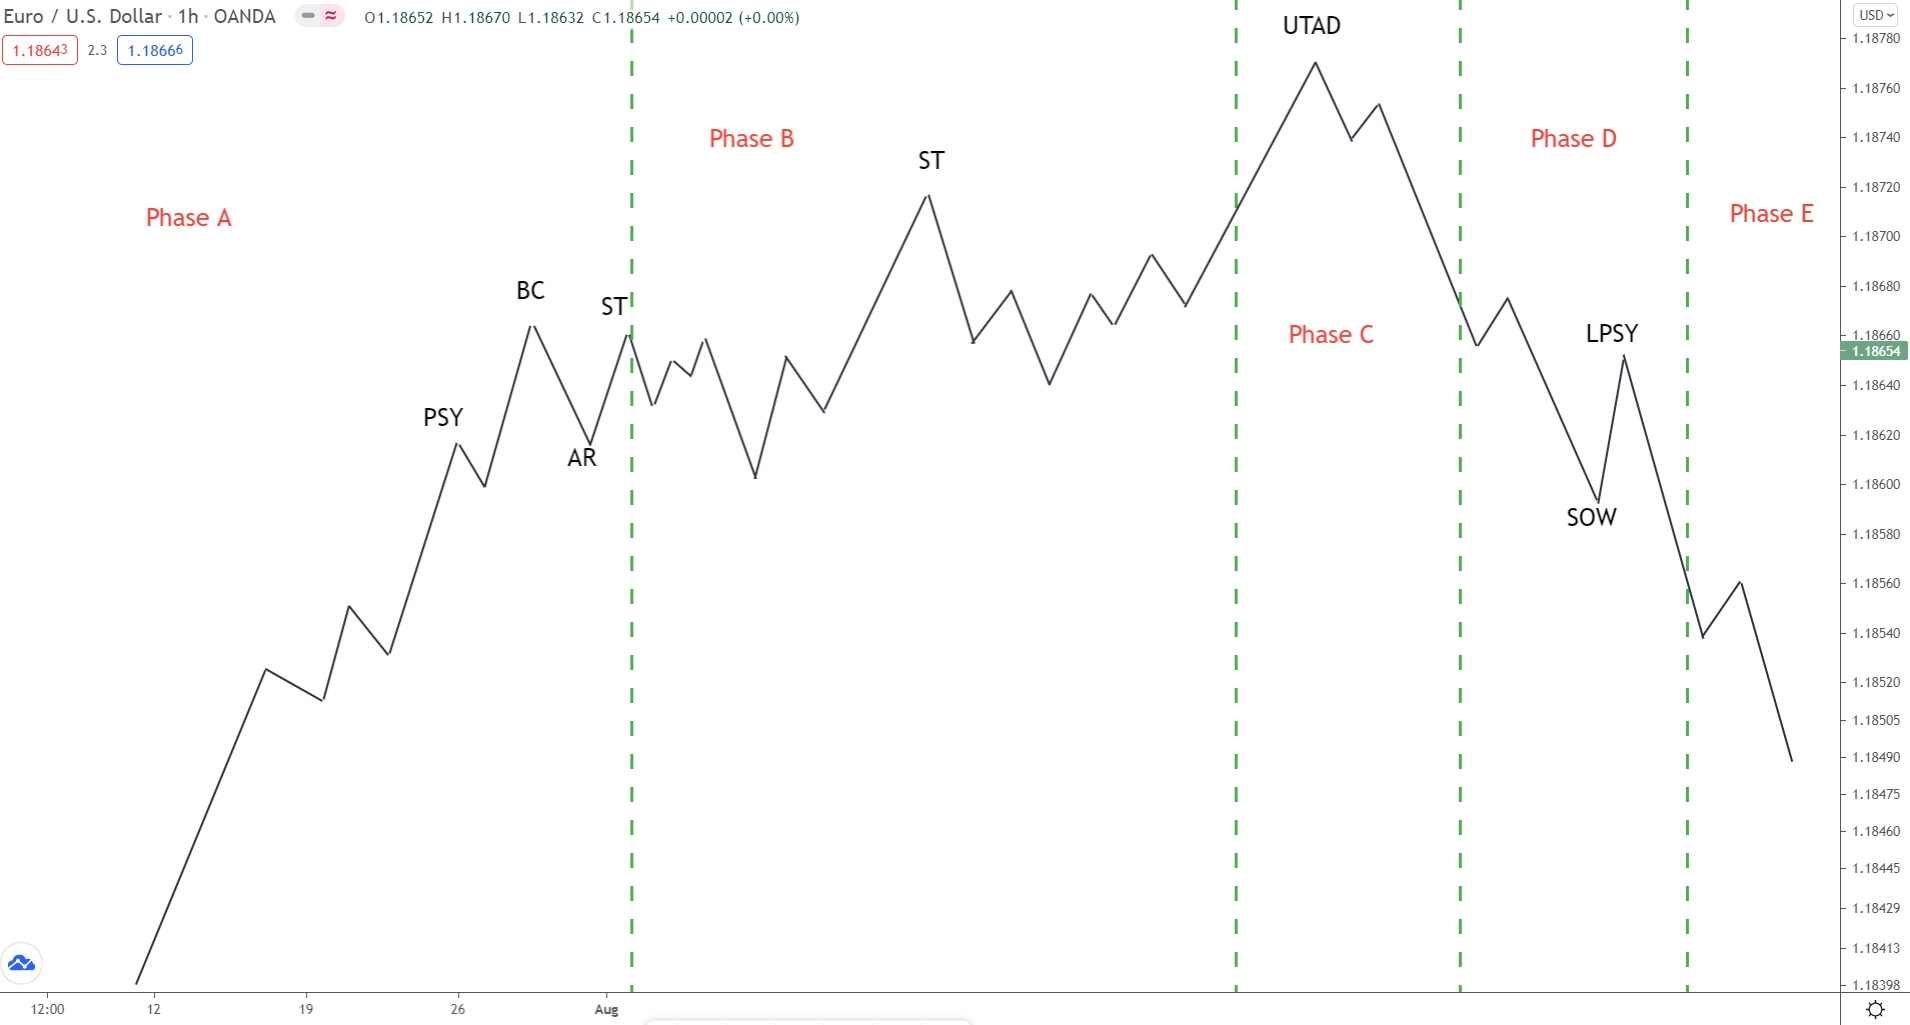
Here, price breaks below the trading range, confirming the new downtrend is underway.
Supply now totally outweighs demand; the big players have entered short and want price to continue falling going forward.
Wyckoff’s 5-Step Trading Approach
Alongside his many principles and ideas, Wyckoff also developed a 5-step approach for trading the markets using his concepts.
These steps provide clear guidelines on analysis, asset selection, risk vs reward ratio, and entry. Combined with the market cycle and accumulation/distribution schematics we looked at earlier, these steps can help you implement Wyckoff in your own trading.
Now, keep in mind…
Nowadays, many of these steps are outdated.
And some don’t really apply to forex trading.
However, to help you out, I’ve left my own translation of each step below, so you know what they really mean and how to use them in your own trading.
Here’s each step in detail…
Step 1: Determine the trend (on your trade timeframe)
Translation: Determine the trend on your trade/analysis timeframe.
We all know to determine the trend – it’s price action 101.
But you should only follow and determine the trend on your trade/analysis timeframe… NOT the overall trend the market has been in over the long term. Because in many cases, the long-term trend will be totally different to the short-term trend.
For example:
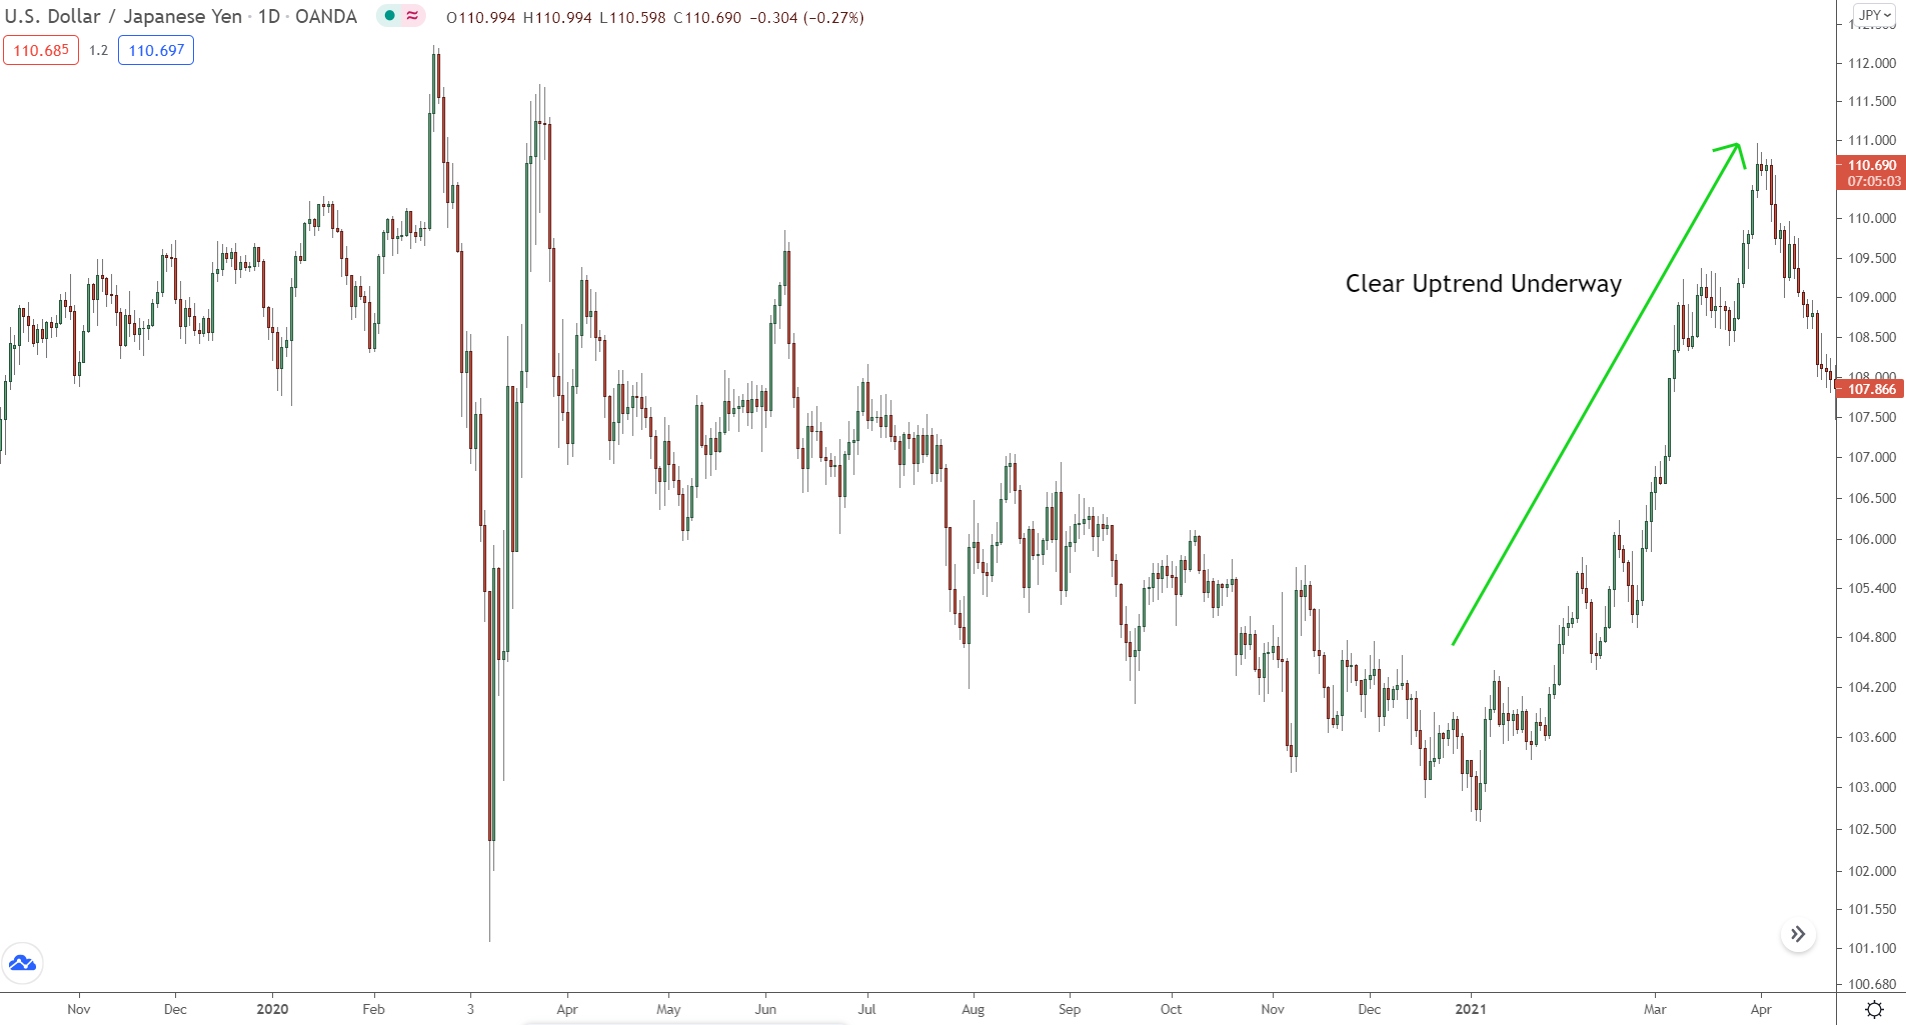
On the daily, the overall trend might be up.
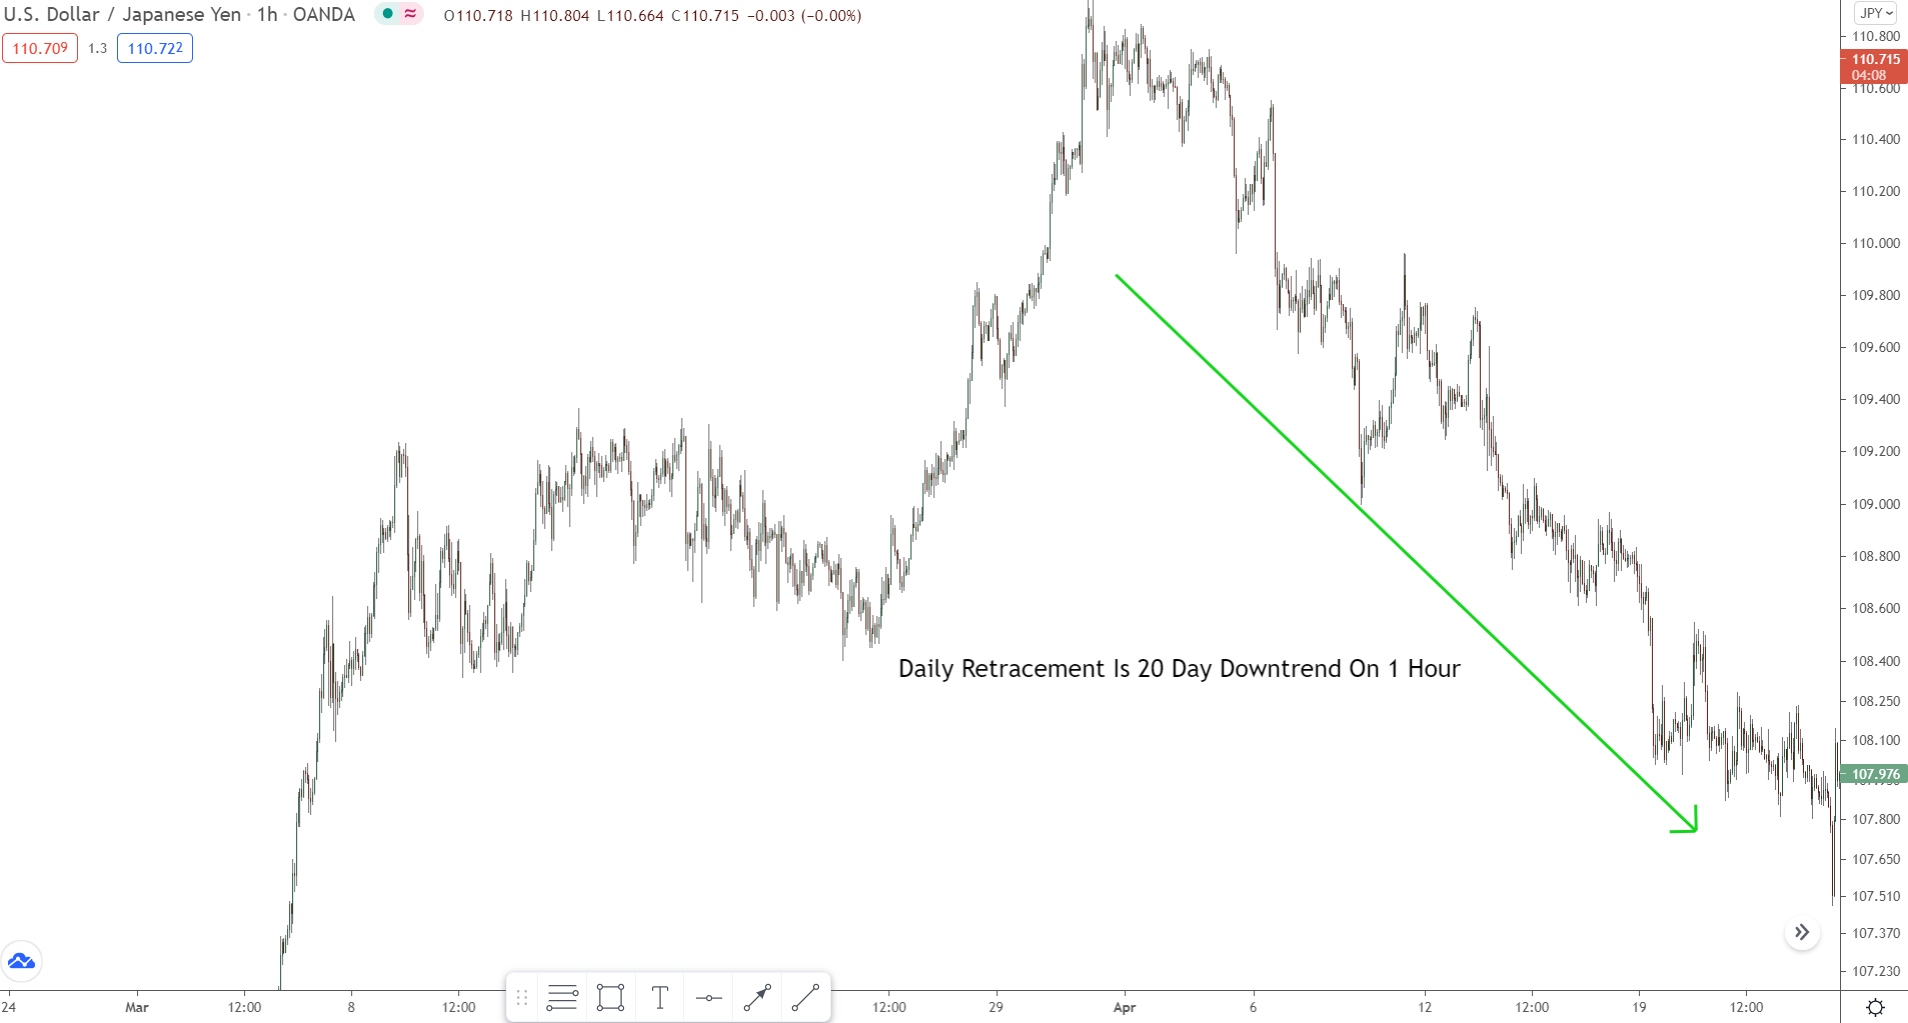
But on the 1 hour, price could be in a large retracement.
In that case, the daily (long term) trend is up while the 1-hour (short term) trend is down.
If you trade with the daily trend now, you’ll be trading against the 1-hour trend.
The result most likely being a string of losses.
Remember: always trade with the trend on your trade/analysis timeframe.
Keep the long-term trend in mind but pay more attention to your trade/analysis timeframe trend. Being recent, the data is more up-to-date, and so gives you closer a look at what’s really going on in the market.
Step 2: Determine the asset’s strength.
Translation: how strong is one pair compared to another.
More of a guideline than a cold hard rule, check how strong the currencies in your selected pair are against one another before trading.
Strong currency vs weak currency = strong uptrend.
Weak currency vs strong currency = strong downtrend.
Personally, I don’t follow this rule myself…
It’s more applicable to stocks than forex, which is what Wyckoff initially created his method for.
Nonetheless, it can give you some nice insights into trend strength, so you know which pairs to trade.
Step 3: Look for assets with sufficient Cause.
Translation: is the risk/reward ratio favourable?
When weighing up any potential trade entry, always analyse the risk vs reward ratio.
Will you generate a large profit if price moves as expected?
Does the reward justify the risk?
It’s all too easy to get sucked into a trade idea because it looks good even though the risk far outweighs the potential reward.
For me, a trade idea must generate at least 3 times my risk.
Any lower than that, I pass… too risky!
At a 1-3 ratio, I make 3 times my risk. Over many trades, that allows me to withstand multiple mistakes and losses, providing me with more safety and decreasing my risk significantly.
All major benefits that improve my trading.
Step 4: Determine how likely is the move.
Translation: what are the odds of price doing as you expect?
If the risk vs reward ratio checks out, the next step is to gauge how likely it is for price to actually do as you expect. You want the highest odds that price will move in your favor and generate a profit for your trade.
That means…
Checking for confluence,
Analyzing the current trend, and,
Seeing if your trade idea generally makes sense.
If everything aligns, price probably has a strong chance of acting as expected. You can enter your trade with the knowledge that price has a high probability of moving in your favor.
Step 5: Time your entry.
Translation: has the right entry signal formed?
The entry can make or break a trade idea, which is why you must always time your trade correctly by waiting for the right entry signal to form.
Far too many traders rush their entry… they’re too eager to get in!
Rather than wait for the right signal, they enter way too quickly.
The result usually being drawdown or a small loss.
Before you enter, always WAIT for the right signal. Whether that’s a pin bar, engulfing pattern, or some other technical analysis signal, it doesn’t matter.
You MUST wait for the right signal to appear.
DO NOT enter out of boredom or hastiness.
Much better to miss a signal than enter too soon and end up with a losing trade. Or suffer massive drawdown before the trade eventually becomes successful.
Summary
Overall, Wyckoff’s method provides an amazing framework for analyzing the market and understanding the schemes of the big players behind the scenes.
The principles and concepts Wyckoff promotes can help you make more logical and informed trading decisions. Understanding the market cycle gives you a major advantage in knowing where (and when) reversals and new trends could begin.
Together, these should give you a handy leg up in tackling the markets, which should help improve your profitability, not to mention analysis skills.