
One of the toughest tasks we face as traders is timing when and where large reversals will begin.
We all want to get into those massive trends that last for weeks and months, of course we do we. But accomplishing that is easier said than done, especially for new traders who lack time and experience in the markets.
Luckily, I’m here to help…
In this post, I’m going to teach you 5 powerful reversal patterns.
These 5 patterns will help you spot when and where a reversal could take place, both in the short term (i.e small reversals) and the huge long-term trend reversals that last for days, weeks, or months.
Ready to get started?
Let’s jump in…
Overview – What Are Reversal Patterns?
In Forex, reversal patterns serve as vital chart formations. These pop up when the market’s underlying psychology hints at price moving in the opposite direction.
Here’s an example:
Imagine price is on an upward trend, but traders anticipate it moving lower. In such a scenario, a reversal pattern might form. The traders selling creates a pattern, signalling a downside reversal – a pattern you can utilize to enter the reversal.
So, what does this pattern look like?
Well, it could take on a large structure (like a triangle), or it might show up as a sequence of one to four candlesticks.
Forex is teeming with an array of reversal patterns, each coming with its own set of trading rules and guidelines. As I mentioned, it could mirror a basic structure or present itself as a series of candlesticks.
Now, let’s dive deeper into the types of reversal patterns.
Two Types Of Reversal Patterns
Reversal patterns can take on all sorts of intriguing shapes and structures – ever heard of the railroad tracks pattern? However, no matter how they look, ALL patterns can be categorized into one of two types based on their formation in the market.
We’re talking about…
Chart Patterns,
And Candlestick Patterns.
Candlestick patterns are the more common type – you’ve likely encountered these before.
These patterns make their appearance when one to four candlesticks form in a specific sequence, thus creating a mini pattern. They’re best utilized as entry signals combined with other technical techniques or as early warning signals indicating a potential price reversal.
The second type, chart patterns, are relatively rare compared to their candlestick counterparts. But here’s the catch: they usually trigger substantially larger reversals.
These patterns surface when multiple candlesticks form a basic shape or structure. Think along the lines of the head and shoulders pattern, triangle pattern, and double bottoms and tops.
Strongest Candlestick Reversal Patterns
In the realm of forex, a multitude of candlestick patterns form…
Faced with such a vast array, you might be left wondering: which ones should I keep an eye on and trade?
Well, don’t fret…
I’m about to delve into the only two candlestick reversal patterns you need to lookout for.
These patterns offer awesome reversal signals on their own but when combined with other technical points – such as supply and demand zones, support and resistance levels, and big round numbers – their power can be increased tenfold.
So, let’s kick off with pattern #1…
Bullish/Bearish Engulfing Patterns
What better way to begin than with engulfing patterns?
Arguably the most critical pattern (be it chart or candlestick) in forex, these patterns trigger some of the most significant reversals around.
This makes them a useful entry signals for reversal trades.
Engulfing patterns appear when two candlesticks form one after the other, where the second candle wraps around, or ‘engulfs’, the first one.
There are two variations of engulfing patterns:
- Bullish engulfing patterns.
- Bearish engulfing patterns.
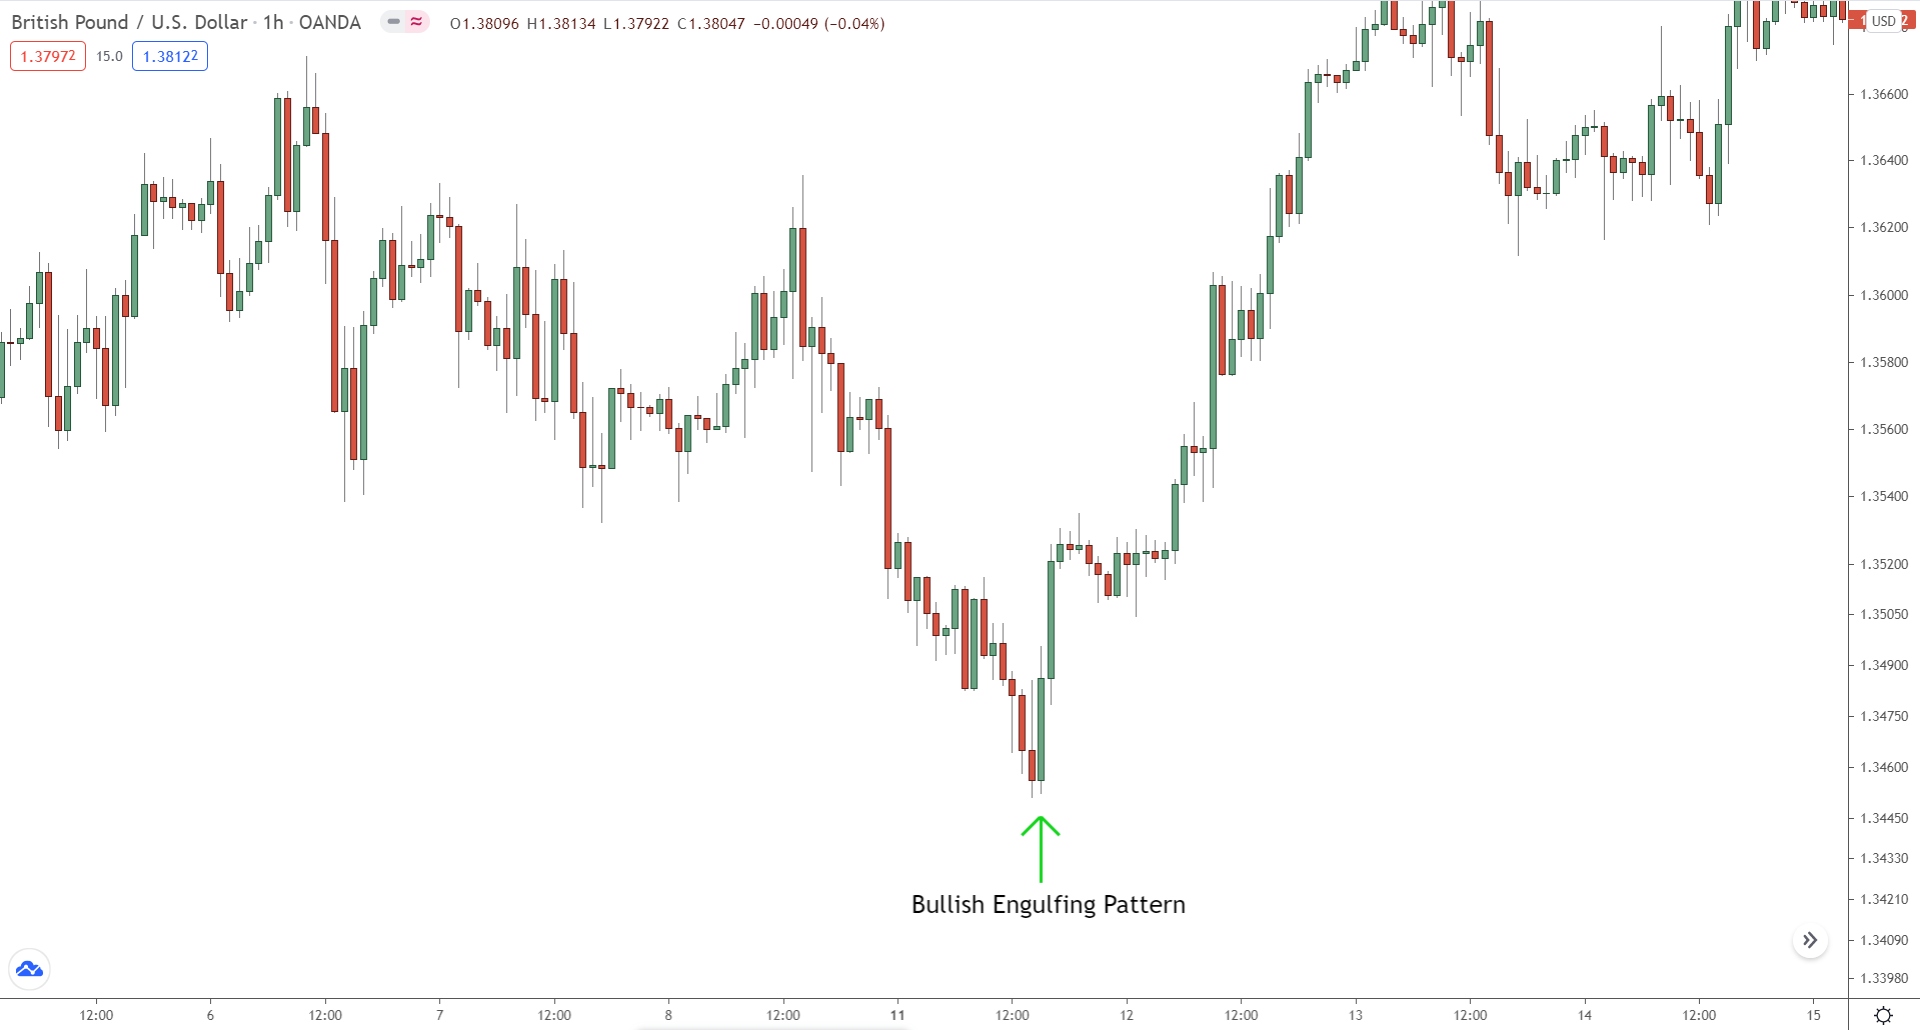
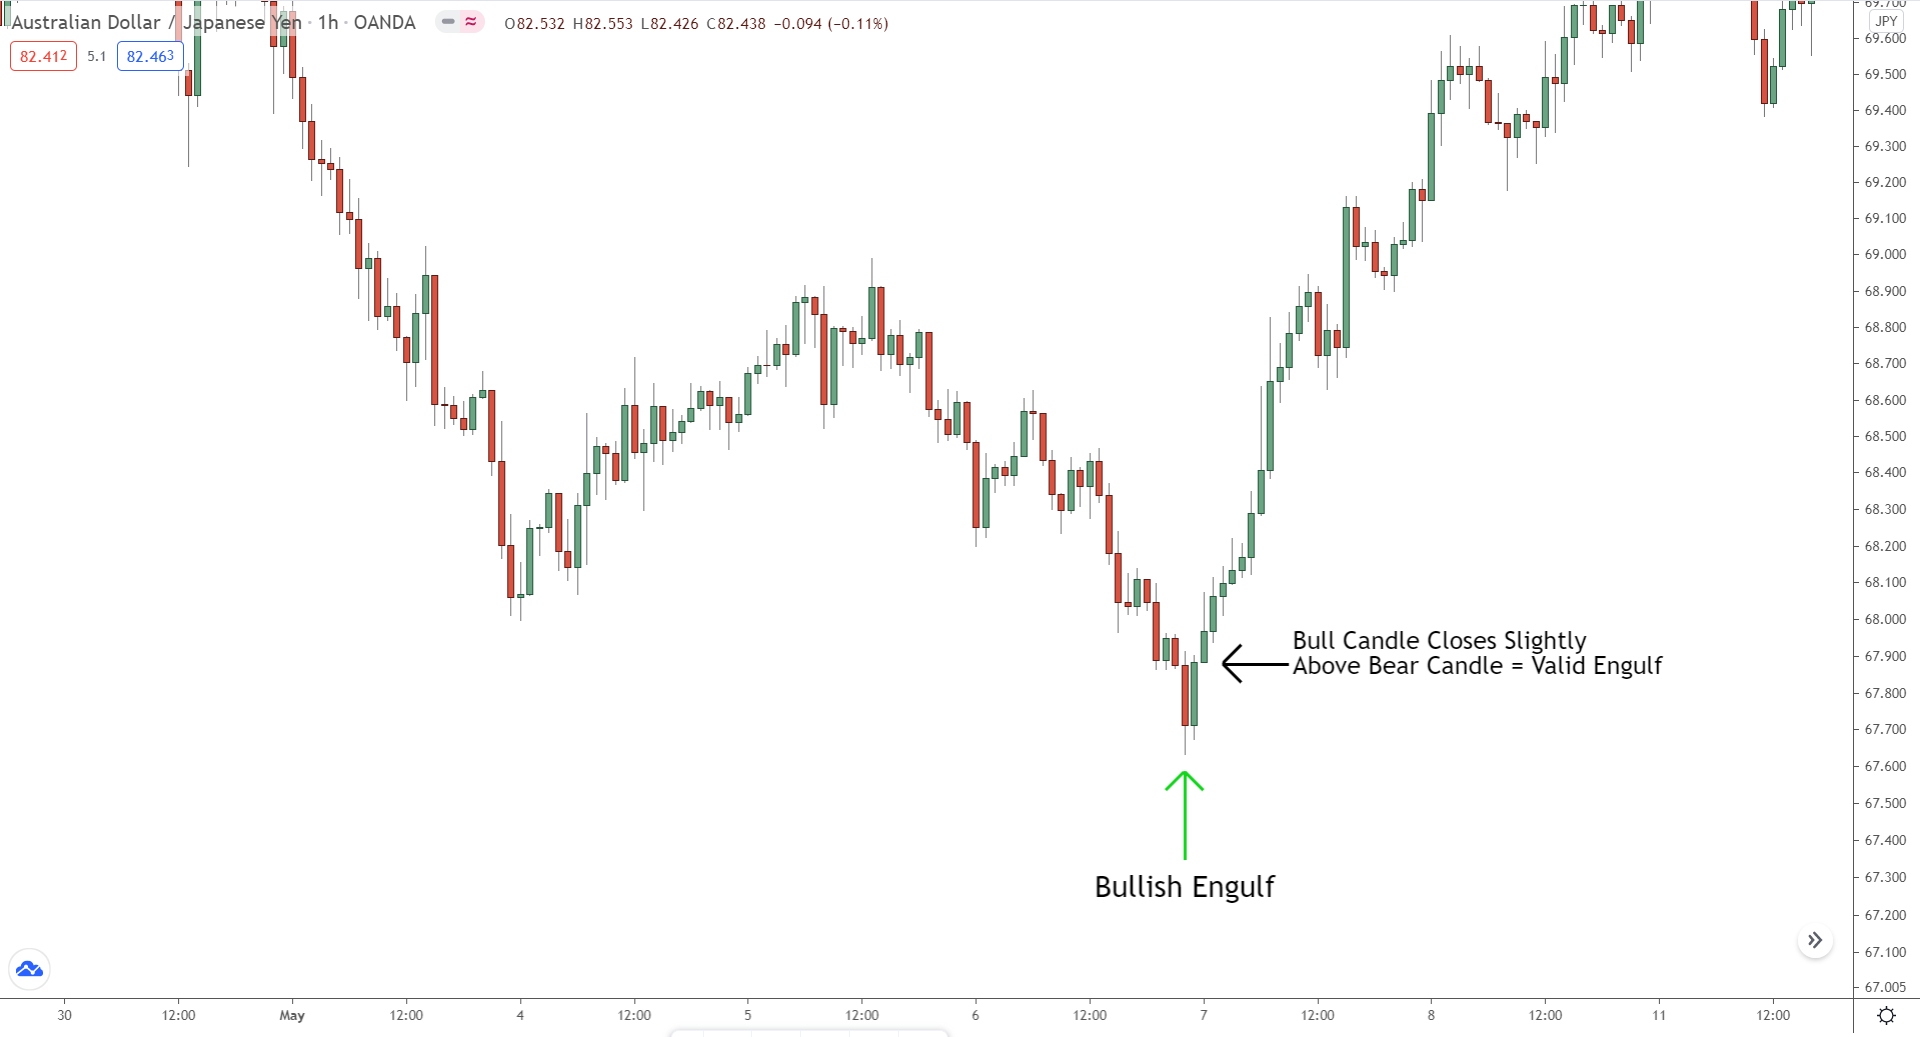
Bullish engulfing patterns: These always signal a reversal to the upside.
So, during down-moves, keep an eye out for these.
The pattern forms when a large bullish candle follows a small bearish candle and, importantly, always closes higher.
No higher close means no bullish engulf.
It’s as simple as that.
Next, let’s look at Bearish engulfing patterns…
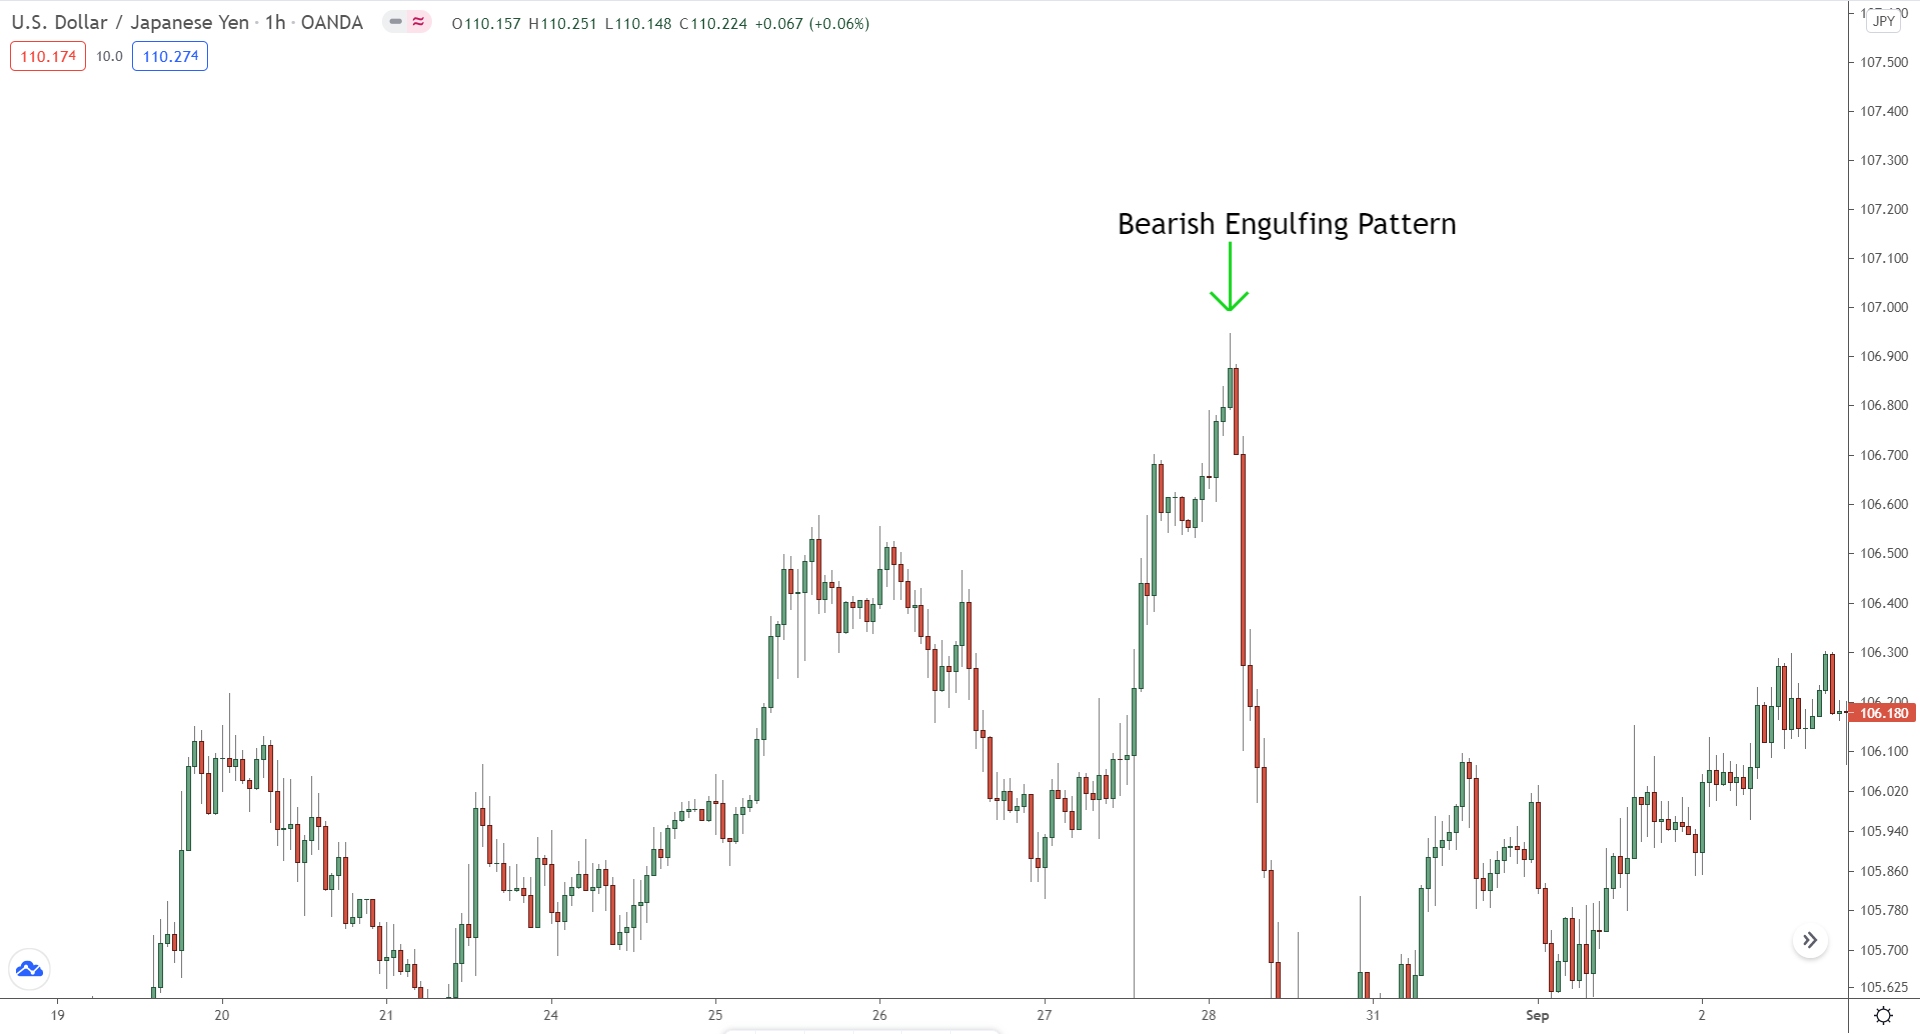
Bearish engulfing patterns: These always signal a reversal to the downside.
Much like the bullish engulf, it forms with two candlesticks. However, there’s a key difference: the first candle is always bullish, while the second is bearish. For a valid pattern, the bearish candle MUST close lower than the bullish candle.
No lower close, no bearish engulf.
Trading Bullish And Bearish Engulfing Patterns
Engulfing patterns offer swift entries into major reversals. They can be used independently or in conjunction with other significant technical points (recommended).
Here’s how to trade the patterns in three easy steps:
Step 1: Wait for the engulf to form.
Sounds simple, right?
However, you’d be surprised by how many traders miss this step.
Before executing any trade based on an engulfing pattern, verify it’s indeed an engulfing pattern. This step seems obvious but is critical. Does the subsequent candle engulf the preceding one? Does it close lower (or higher for bullish engulfing patterns) than the prior candlestick?
If yes, that’s your valid engulfing pattern.
If no, move along…
It’s likely a different pattern altogether.
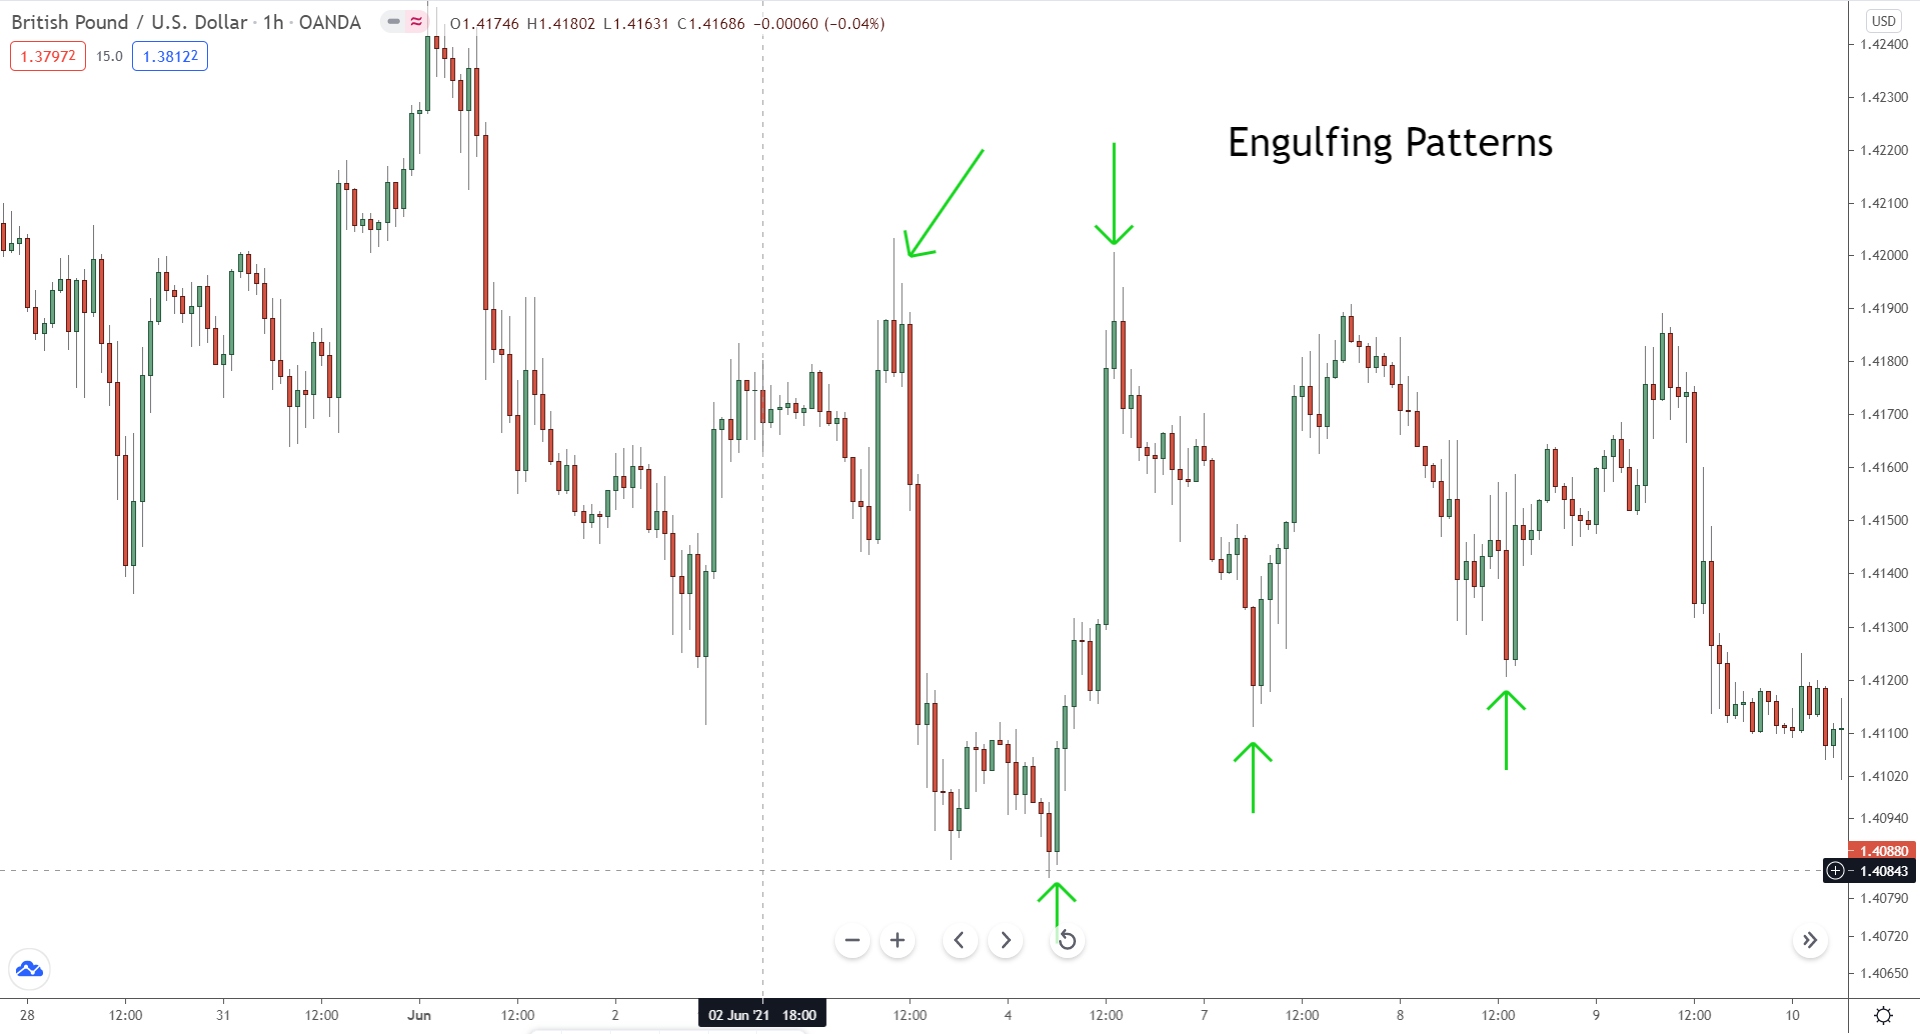
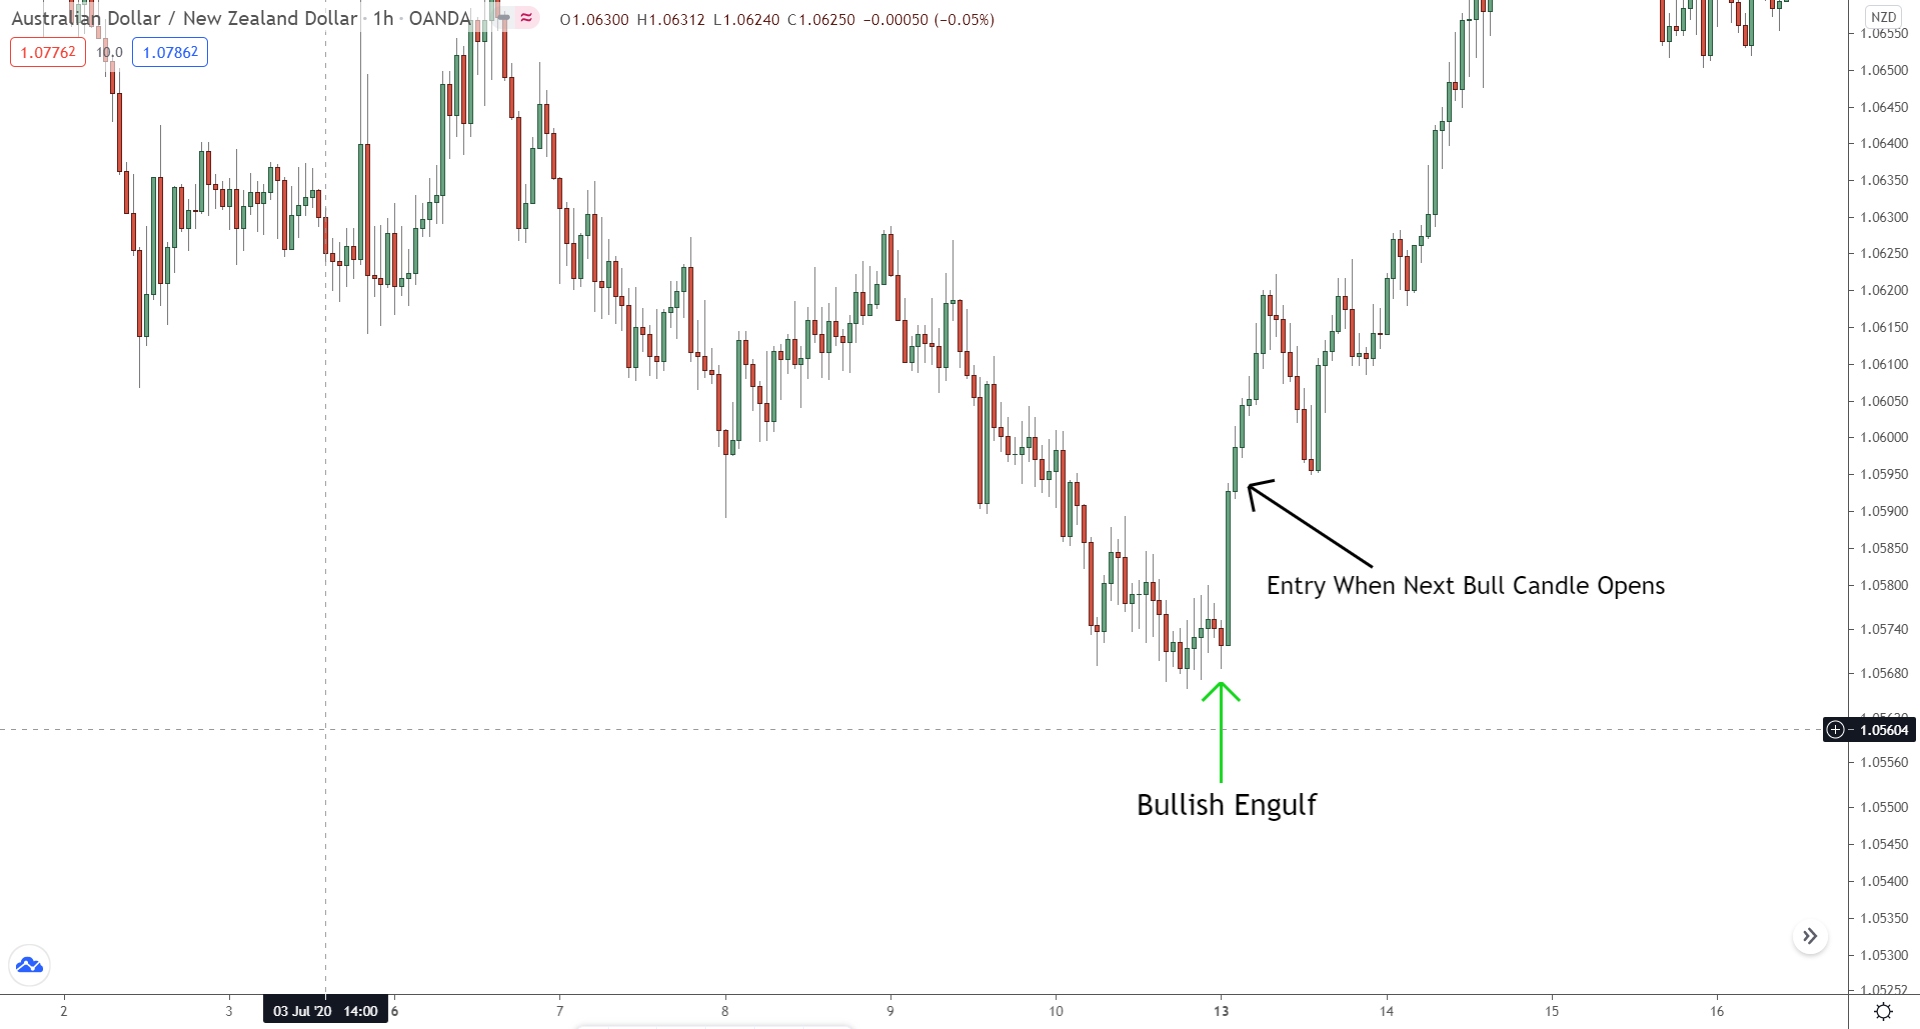
Below is an example of a correctly identified engulfing pattern…
Step 2: Wait for the engulf to close.
One of the most common mistakes traders make with engulfing patterns – and candlestick patterns generally – is jumping in while the pattern is still in formation.
Before trading an engulfing pattern, WAIT for the pattern to finalize.
DO NOT enter when the pattern is still evolving; hold on for the next candle to open.
Traders often underestimate how volatile prices can be. One moment, an engulfing pattern may be forming, and the very next, it can transform into something completely different. If you prematurely commit and the pattern changes, most likely, you’ll have a losing trade.
The only foolproof method to confirm a pattern is by allowing it to close – i.e., waiting for the subsequent candle to open.
The image below offers a clear example of this…
Step 3: Enter a trade and place a stop loss
Time to delve into trade entry and setting up a stop loss.
Entering engulf trades is pretty straightforward… just wait for the pattern to close, and then dive in using a long/short market order. Yes, limit orders can also be an option, but market orders get you in faster. And speed matters because price often takes off after engulfing patterns form.
You want to get in ASAP.
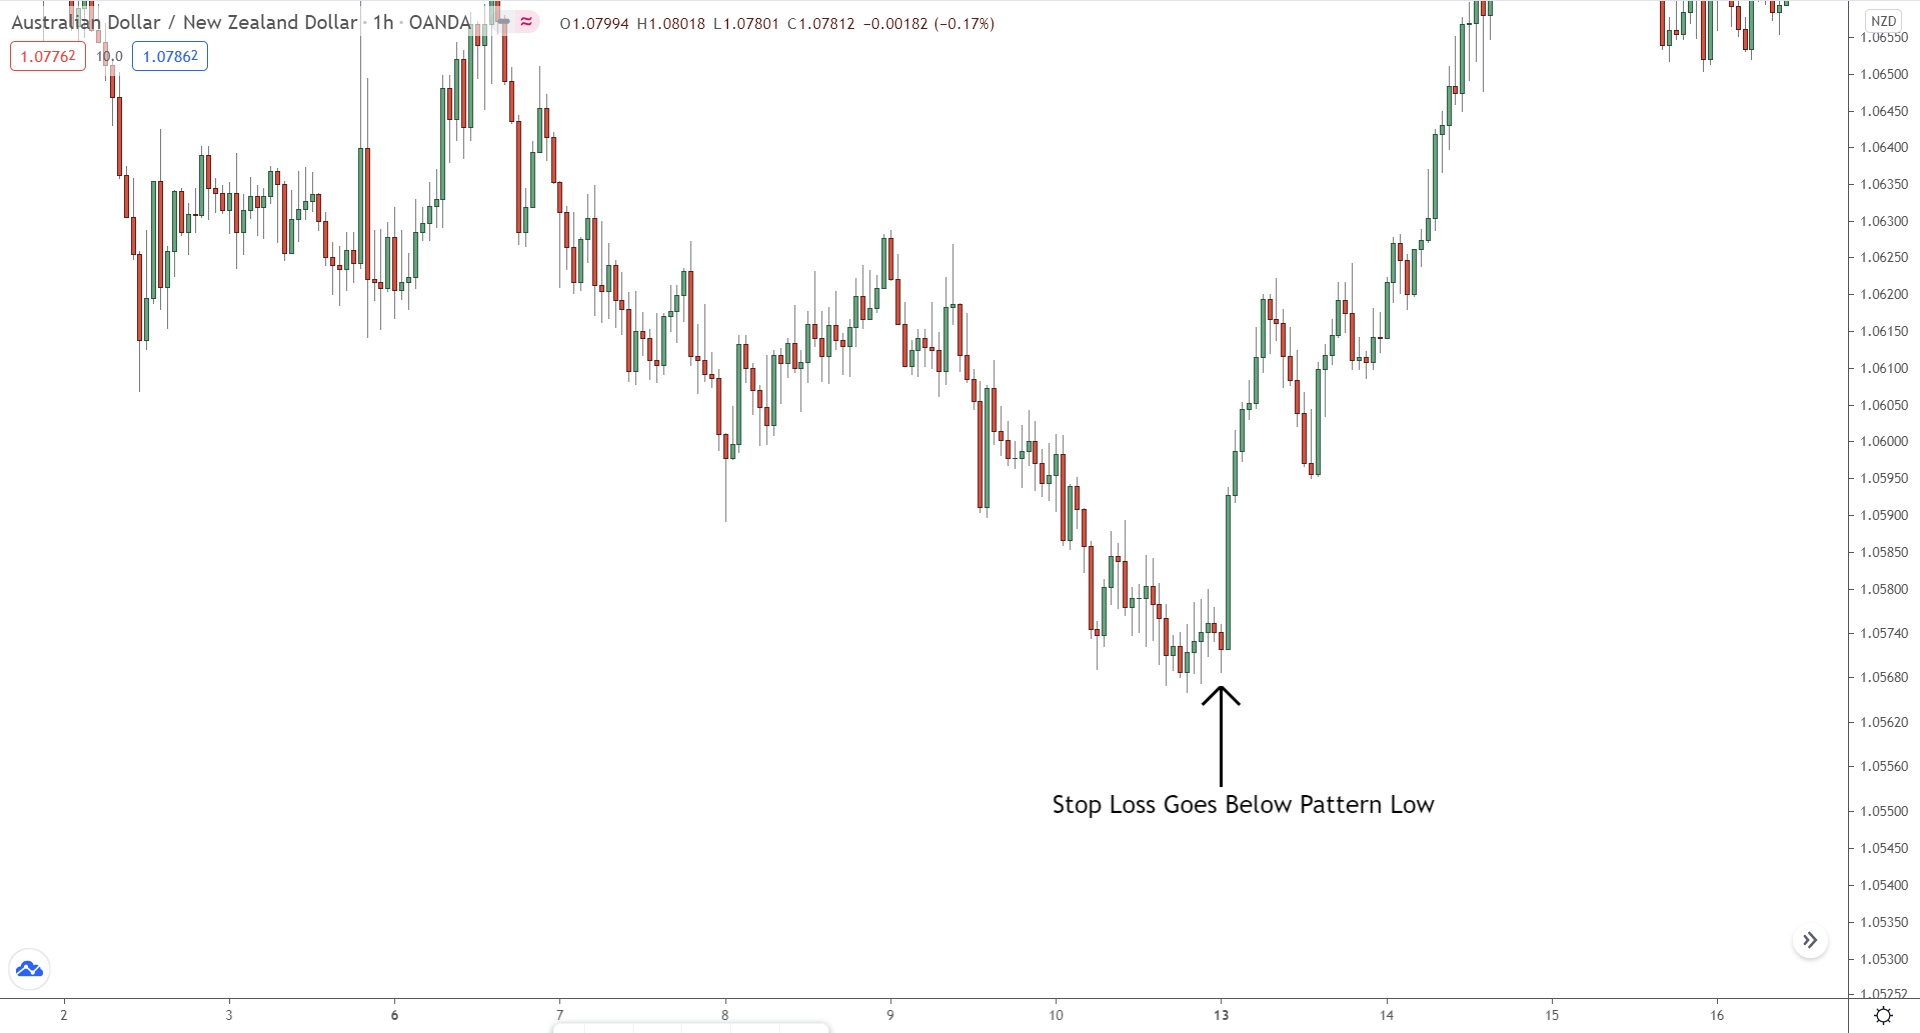
Moving onto the stop loss: place it above or below the high/low of the pattern.
To clarify:
- For bearish engulfing patterns, set it above the high.
- For bullish engulfing patterns, place it below the low.
When it comes to taking profits, it boils down to personal preference. Typically, I take profits whenever a new swing high/low forms.
But really, it’s your call.
Use whatever strategy gels with you.
Key Points To Remember:
1: Engulfing patterns are only valid if the second candle ‘engulfs’ the first.
How does this work?
For bearish engulfing patterns, the second candle MUST close lower than the first… and for bullish ones, it should close higher.
If price doesn’t close lower or higher, don’t forget, it’s NOT an engulfing pattern.
2: Engulfing patterns work best when paired with other technical points.
Just like all patterns, they provide more potent reversal signals when they form at critical technical points… I usually use them alongside supply and demand zones. However, they perform equally well at support and resistance levels and mesh well with other technical analysis points too.
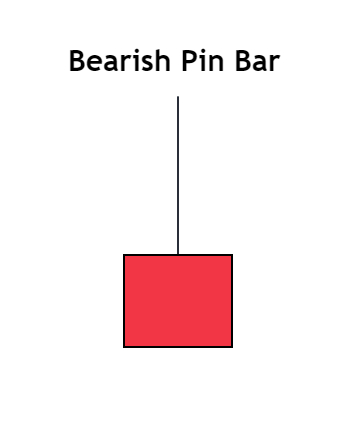
Bullish/Bearish Pin Bars
Ah, the pin bar…
Few patterns can match this little tyke!
The pin bar is easily one of the most important candlestick patterns in forex, and you’ve probably seen them form many times without realizing.
Here’s how it looks…
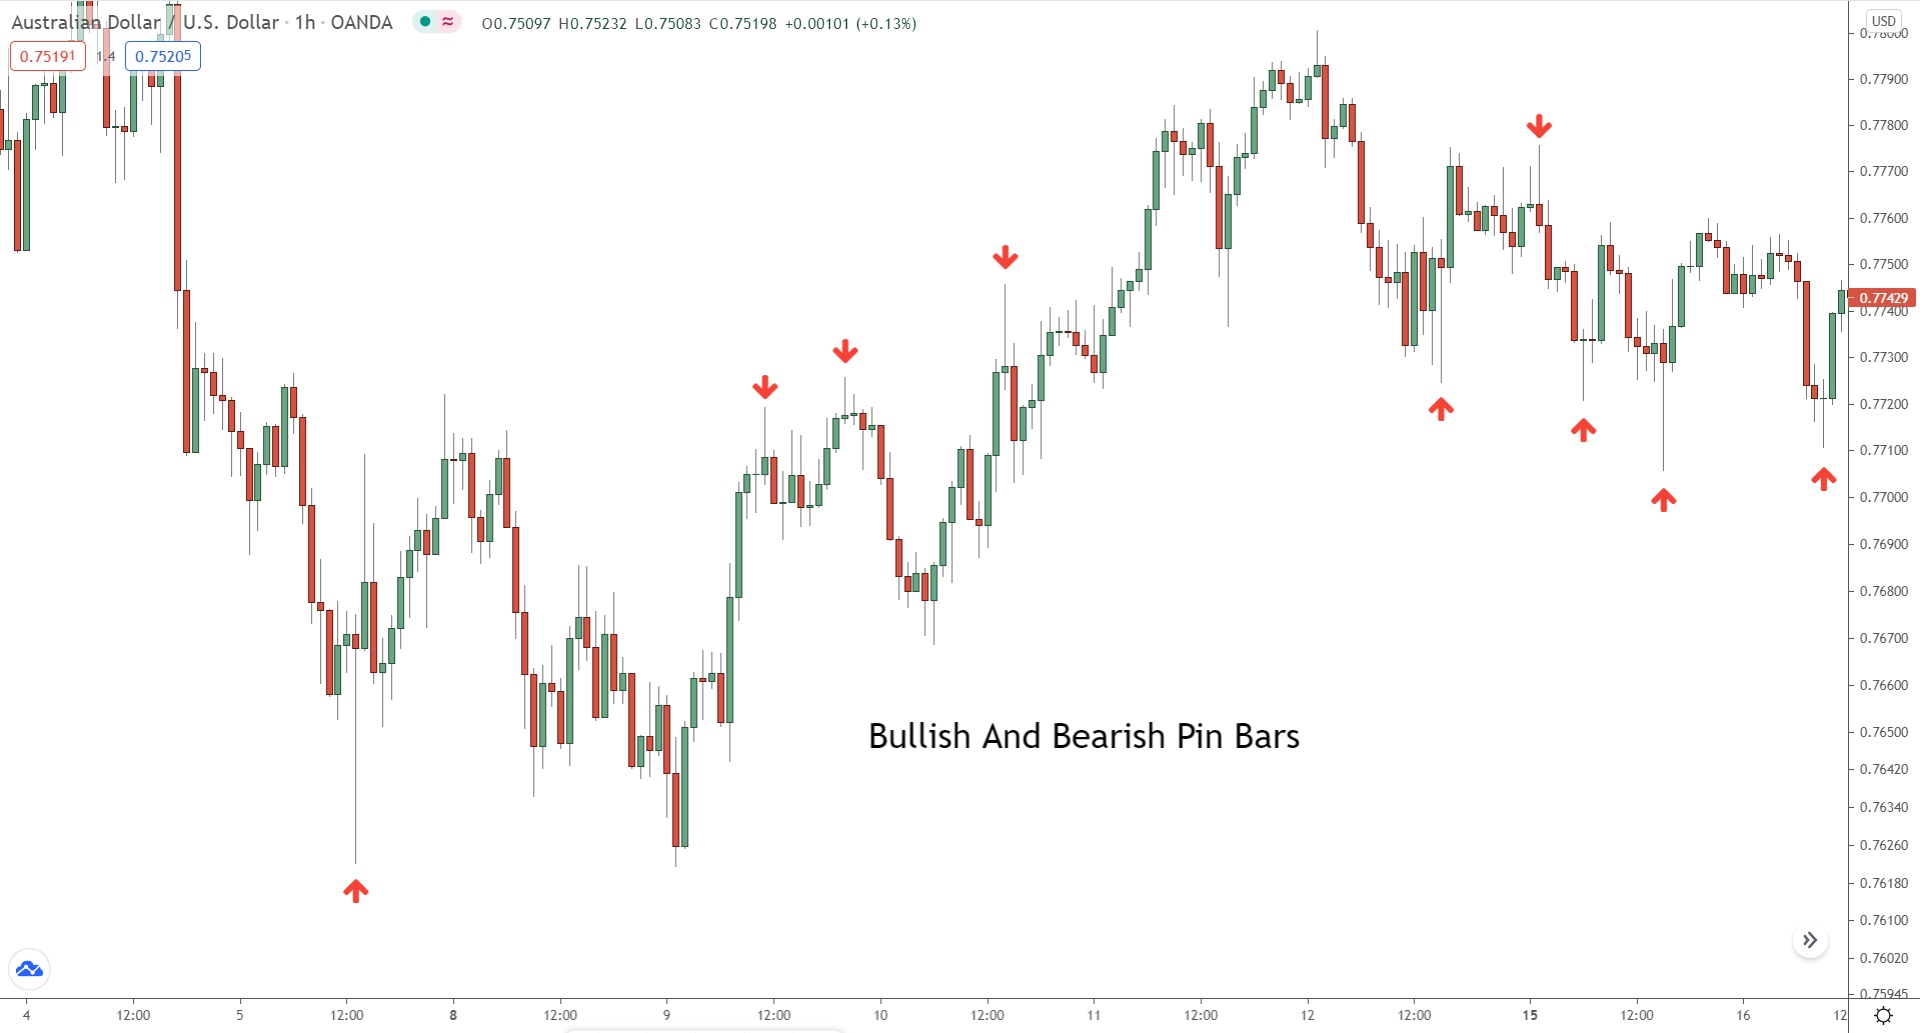
Recognized for its distinct appearance, a pin bar forms when price initially swings one way, only to swiftly reverse. The resulting candlestick displays a long upper or lower wick with a small body, signalling price is likely to continue in the opposite direction.
Diving into the specifics, pin bars have two variants:
- Bullish pin bars: signal a reversal to the upside, these form during downward movements.
- Bearish pin bars: indicate a reversal to the downside, these typically appear during upward movements.
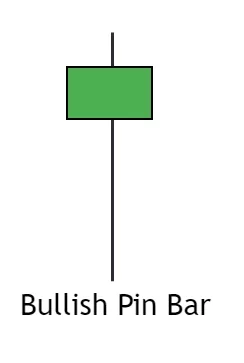
While we’ve identified two variations, there are, in fact, four types of pin bars. Although they may appear identical, their implications for reversals vary depending on where they form.
The two prominent ones are: the shooting star (left) and hammer pin bar (right).
Here’s the key takeaway: Focus on these two pin bar variants…
Avoid trading the inverted hammer or upside-down star – the other types.
These two patterns offer highly inconsistent reversal signals.
Trading them can often lead to losing money or making incorrect trading decisions – such as prematurely taking profits or closing a profitable trade.
Now, let’s discuss how to trade pin bars…
Important: Both bullish and bearish pin bars can have a body showing the opposing colour – e.g a bearish pin bar can have a bullish body and vice versa. The body being the opposite colour does decrease the strength of the pin slightly but doesn’t change what the candle signals.
How To Trade Pin Bars
Pin bars are simple reversal patterns that are easy to spot and trade, making them ideal for beginners seeking a straightforward signal to enter trades.
Let’s go over a quick example…
Step 1: Identify a pin bar.
First things first, you’ll need a pin bar to appear on the charts.
Pin bars form when the price initially moves in one direction and then suddenly moves in the opposite direction. This creates a candlestick with a long wick, either on top or bottom, and a small bullish or bearish body.
To easily identify a pin bar, just look at the wick…
If a candle features a long wick (also known as a tail) and a tiny body, you’ve likely spotted a bullish or bearish pin bar.
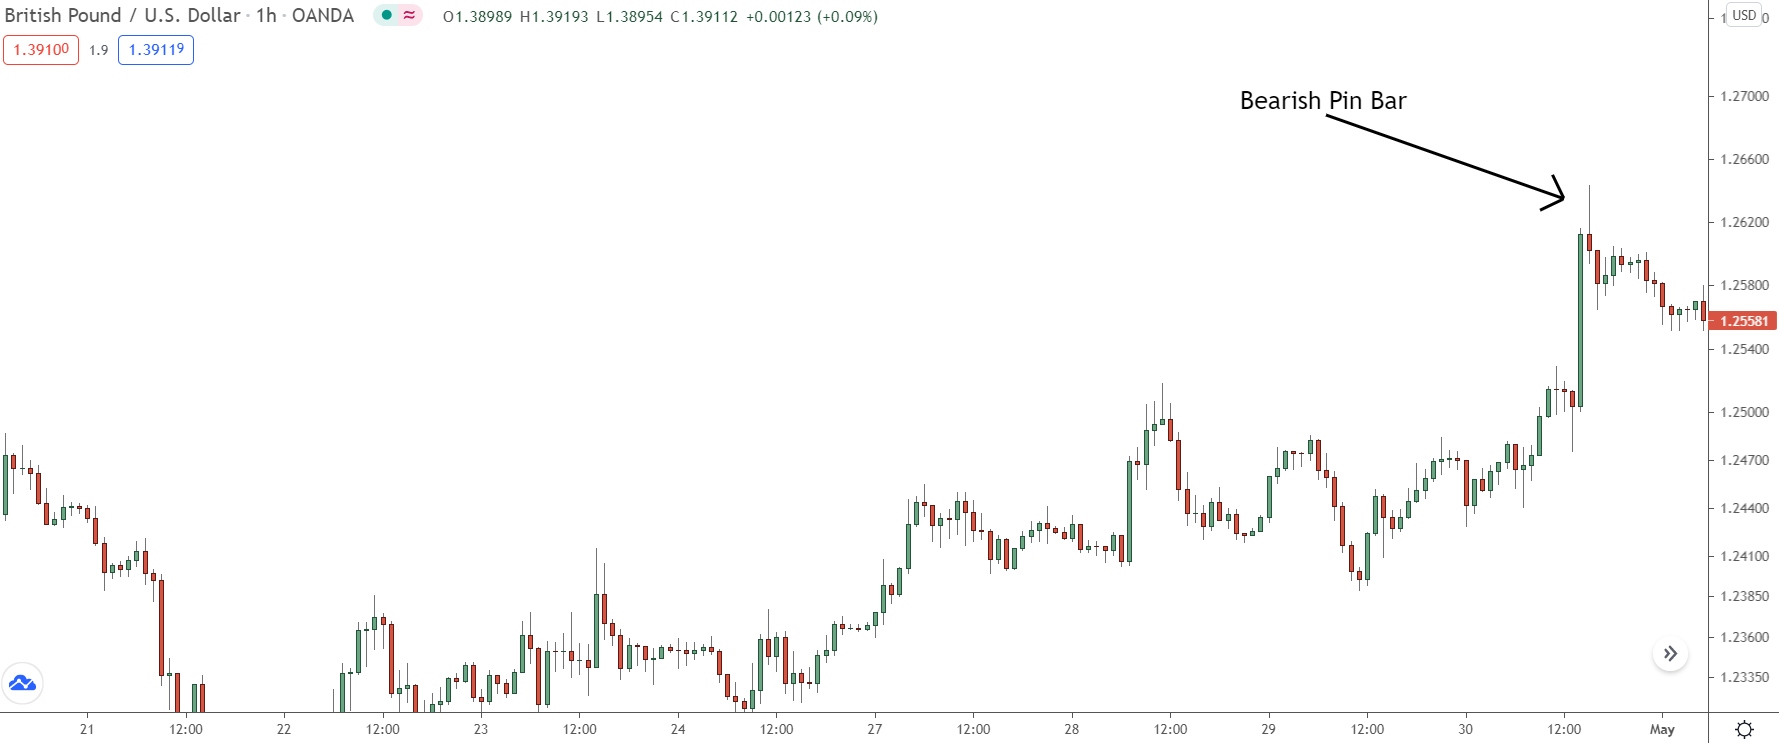
In our example, a bearish pin bar forms – can you see the wick?
This wick forms above the body, and stands out from the adjacent price action. This indicates the existence of a bearish pin bar and signals a price reversal might be imminent.
Now, let’s move onto step 2…
Step 2: Wait for the pin bar to close
Once a pin bar forms, the next step is to wait for price to confirm the pattern.
Despite their power, pin bars DO NOT inherently signal a price reversal is guaranteed. Patience is key: always wait for additional confirmation before entering a trade. Confirmation presents itself once the pin bar closes and the next candlestick opens.
If you enter before the pin closes… it could transform into a different candle. If that happens, you’re likely to lose money.
So, wait before making your move.
Here’s a key point to remember: even with confirmation, pin bars will fail from time to time.
How do you swing the odds in your favor? Keep an eye out for pins at critical technical points, such as supply and demand zones or support and resistance levels. These improve the odds price will reverse after the pin bar forms.
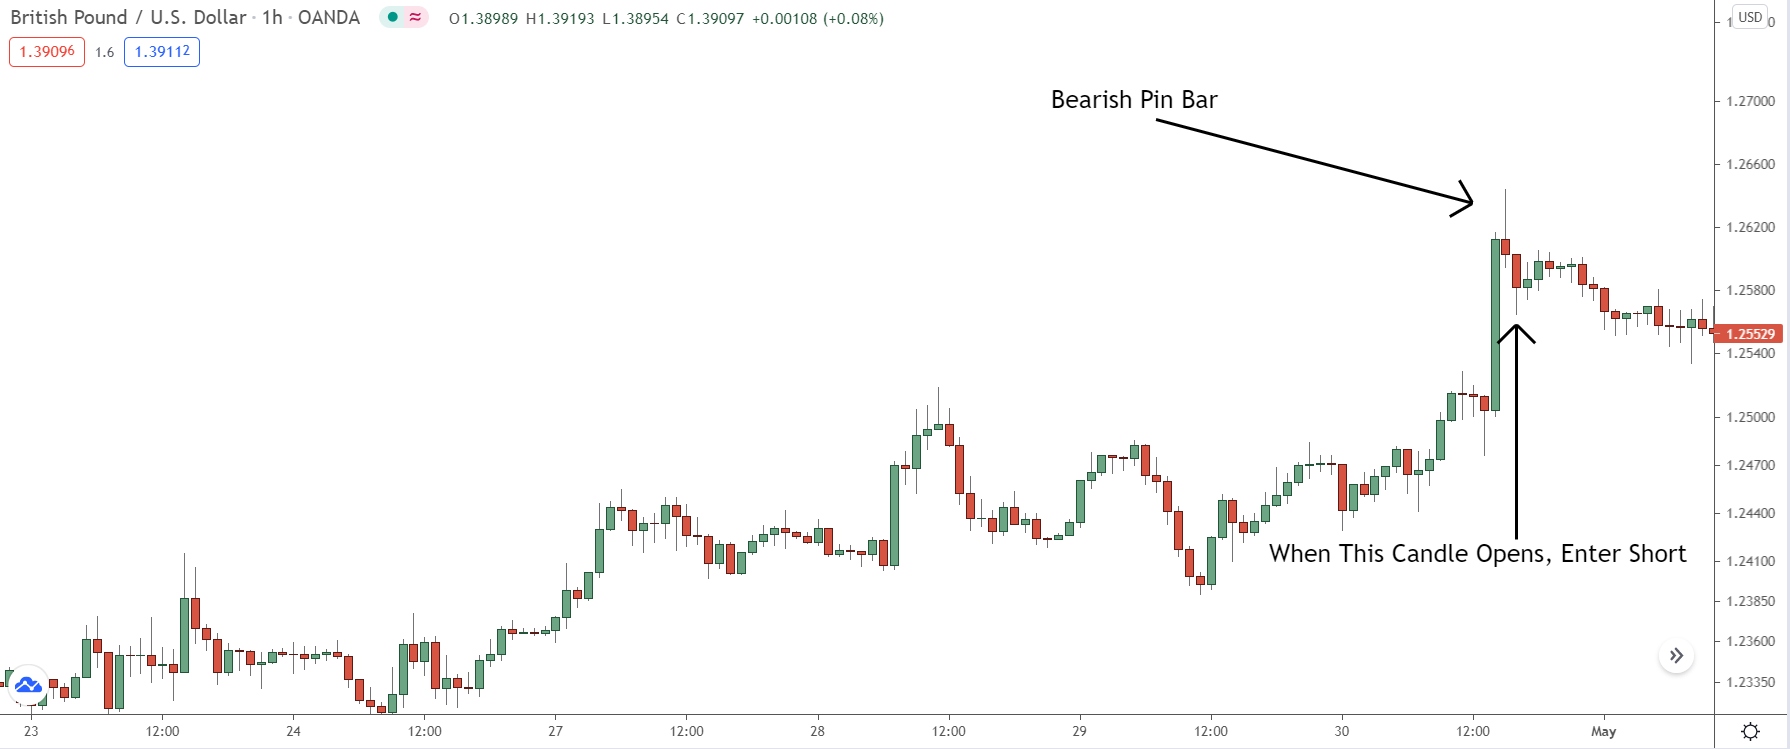
Step 3: Enter a trade and place a stop loss.
If the preceding steps are all ticked off, you’re in a good place to enter a trade and set a stop loss. Remember, entry into a pin bar trade happens only once the pattern has closed, which is marked by the next candle opening – as outlined in Step 2.
Let’s break it down with an example…
We enter only once the pin closes, and the next candle forms.
The stop on a pin bar trade always sits either above or below the wick.
- For bearish pins, it’s positioned ABOVE the wick.
- For bullish pins, it’s positioned BELOW the wick.
When it comes to taking profits and adjusting the stop…well, that’s truly your call.
For me, I shift my stop to breakeven once the price makes a new low or high. By then, the price usually has moved far enough to confirm the reversal.
So, it’s unlikely to retreat back to the entry point – the pin bar itself.
Key Points To Remember:
Before we move on, here’s a few key points to remember when incorporating pin bars into your trading strategy…
Point #1: Seek out pins with long wicks.
To trade the most effective pin bars, hunt for those with long wicks.
These pins frequently trigger large reversals, as the long wick indicates significant buying or selling activity during the pin bar’s formation.
Point #2: Understand why a pin bar formed.
Many traders mistakenly believe that all pin bars develop for the same reasons.
That’s not quite accurate…
Pin bars form due to major players taking profits, closing trades, or entering trades. The specific type of pin that forms greatly impacts whether a price reversal will occur.
Consider this:
Suppose a pin forms as a result of the banks profit-taking.
That’s unlikely to spawn a significant reversal. In this case, the major players will aim to maintain the price direction after securing profits.
The most potent pins form due to the big players initiating – or sometimes closing – trades.
To spot these pins, you need to understand the behavior of other traders and the actions leading to the pin’s formation. Unfortunately, we don’t have the time to delve into this today. However, all this and more can be discovered in my book, “Pin Bars Revealed“.
Strongest Reversal Chart Patterns
Now, let’s shift our focus to chart patterns…
Chart patterns are far less common than candlestick patterns.
While that might sound like a disadvantage, it’s actually a plus! Their rarity, combined with a longer construction time, usually results in large, market-altering reversals, making them fantastic signals to watch for.
So, if you spot one of the following patterns, brace yourself…
A trend change or a major reversal might just be around the corner.
Let’s begin with pattern #1…
Double Bottom & Double Top (Best)
Perhaps the most straightforward choice… the double bottom and double top. These two are among the most potent reversal patterns in forex.
Plus, they appear quite frequently!
These patterns form when price creates two bottoms or two tops at similar prices.
These bottoms/tops usually form at major support or resistance levels or big round numbers and reflects a double rejection of the Support or Resistance level.
Double bottom and double top patterns are created when the big players enter positions at separate but similar prices. Here’s why: in Forex, it’s rare for big players to execute their trades at a single price due to the lack of orders available.
To enter, THOUSANDS of opposing buyers or sellers must be readily available.
However, that’s hardly ever the case.
So, how do the big players adapt?
Well, they divide their trades into smaller bits, executing them at different times but at similar prices. This mimics a scenario where they have one trade entered at a single price, which would be the ideal circumstance, provided enough buyers or sellers were at hand.
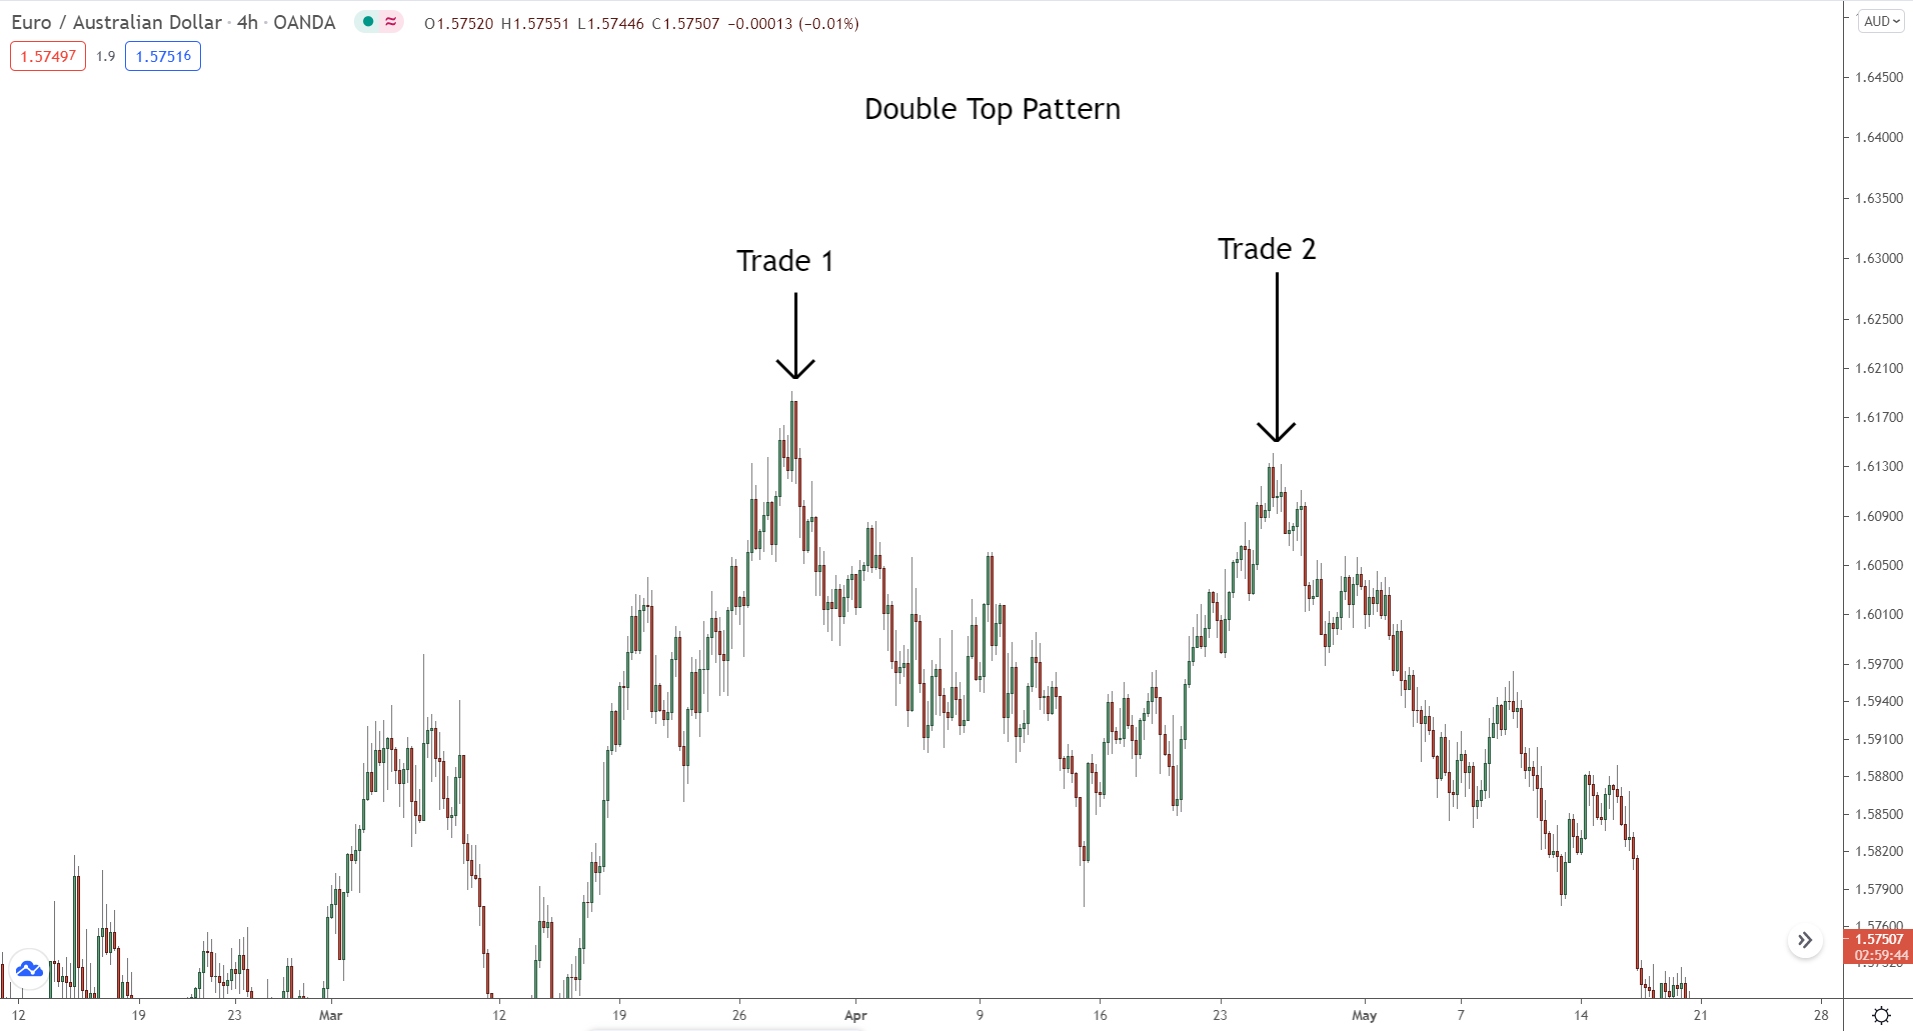
When we look at a chart, this often materializes as a double bottom or double top.
What does this pattern signify?
It shows the big players entering their minor trades. Each bottom/top is a representation of a trade, entered at different, yet similar, price.
Trading The Double Top/Double Bottom Patterns
Trading double tops and double bottoms patterns is relatively easy, especially when compared to other chart patterns.
Here’s how it works:
You…
- Wait for the pattern to form,
- Look out for a price break at the neckline,
- And then, proceed to enter a trade.
That said, trading these patterns correctly requires you to remember a few critical points.
Let’s run through a quick example:
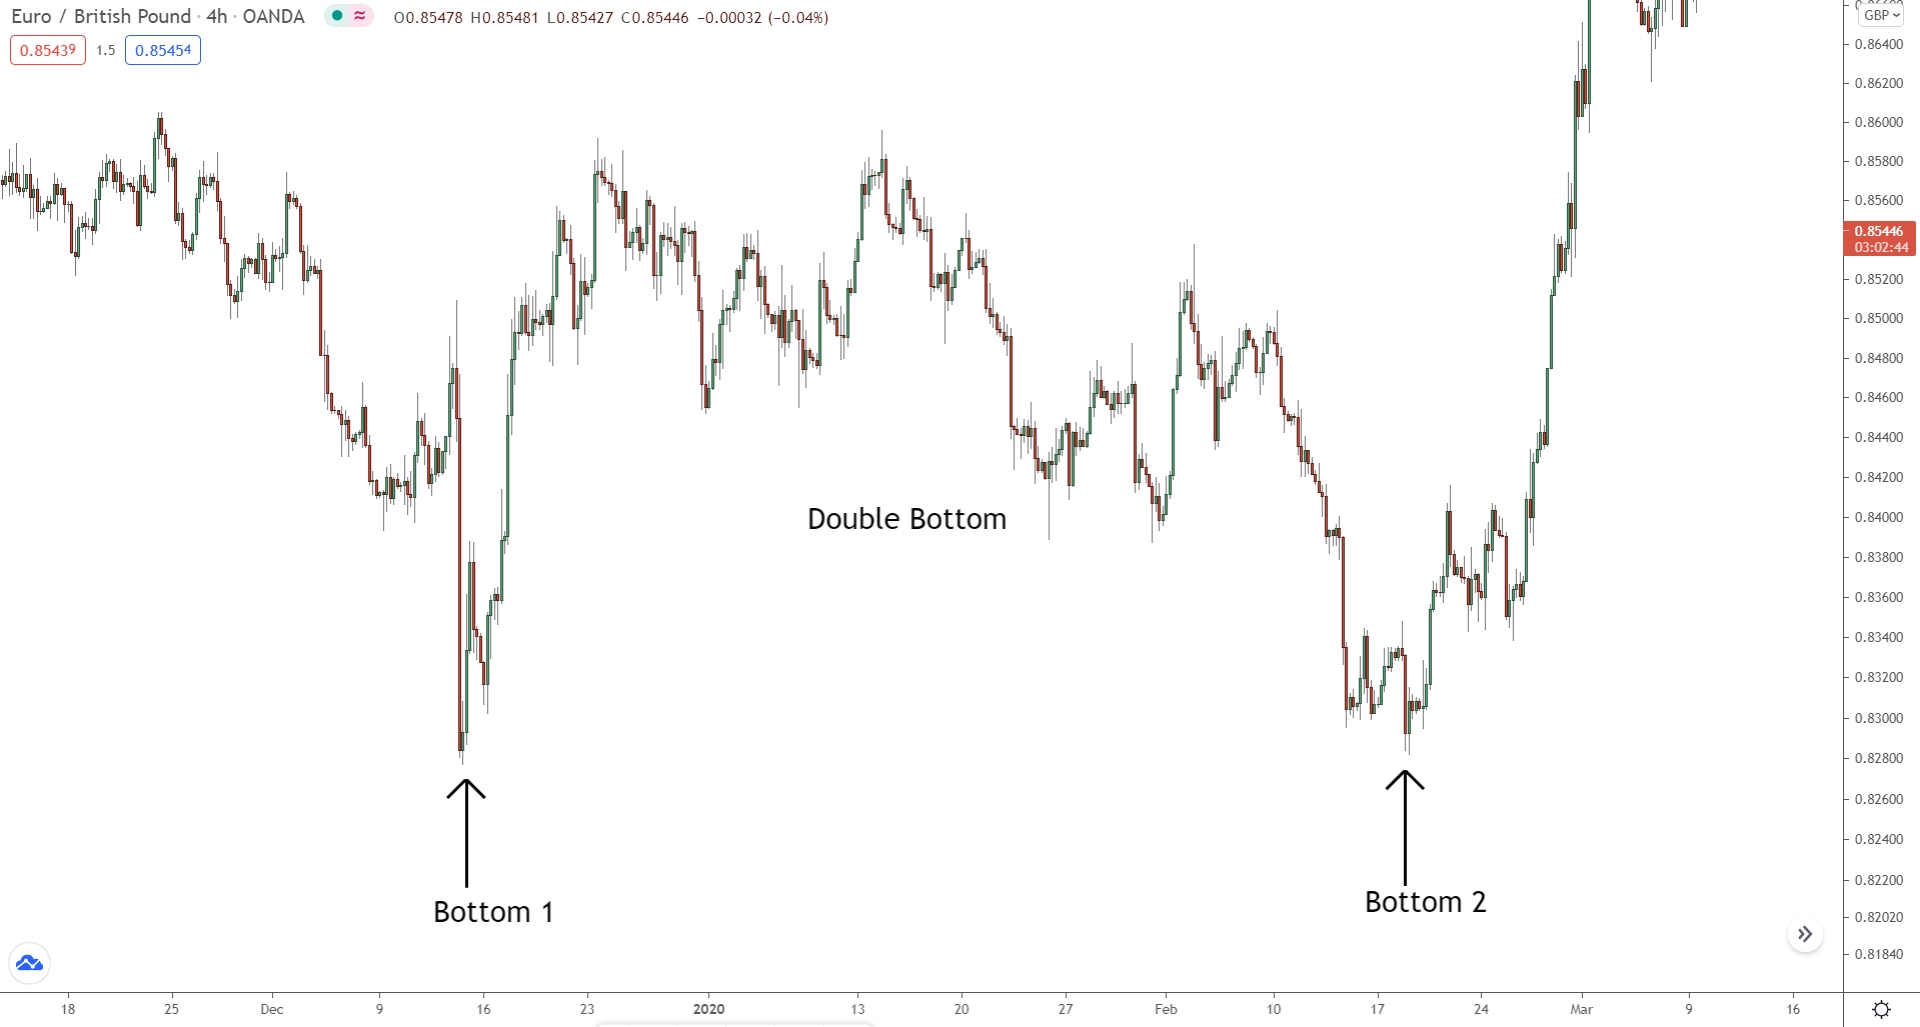
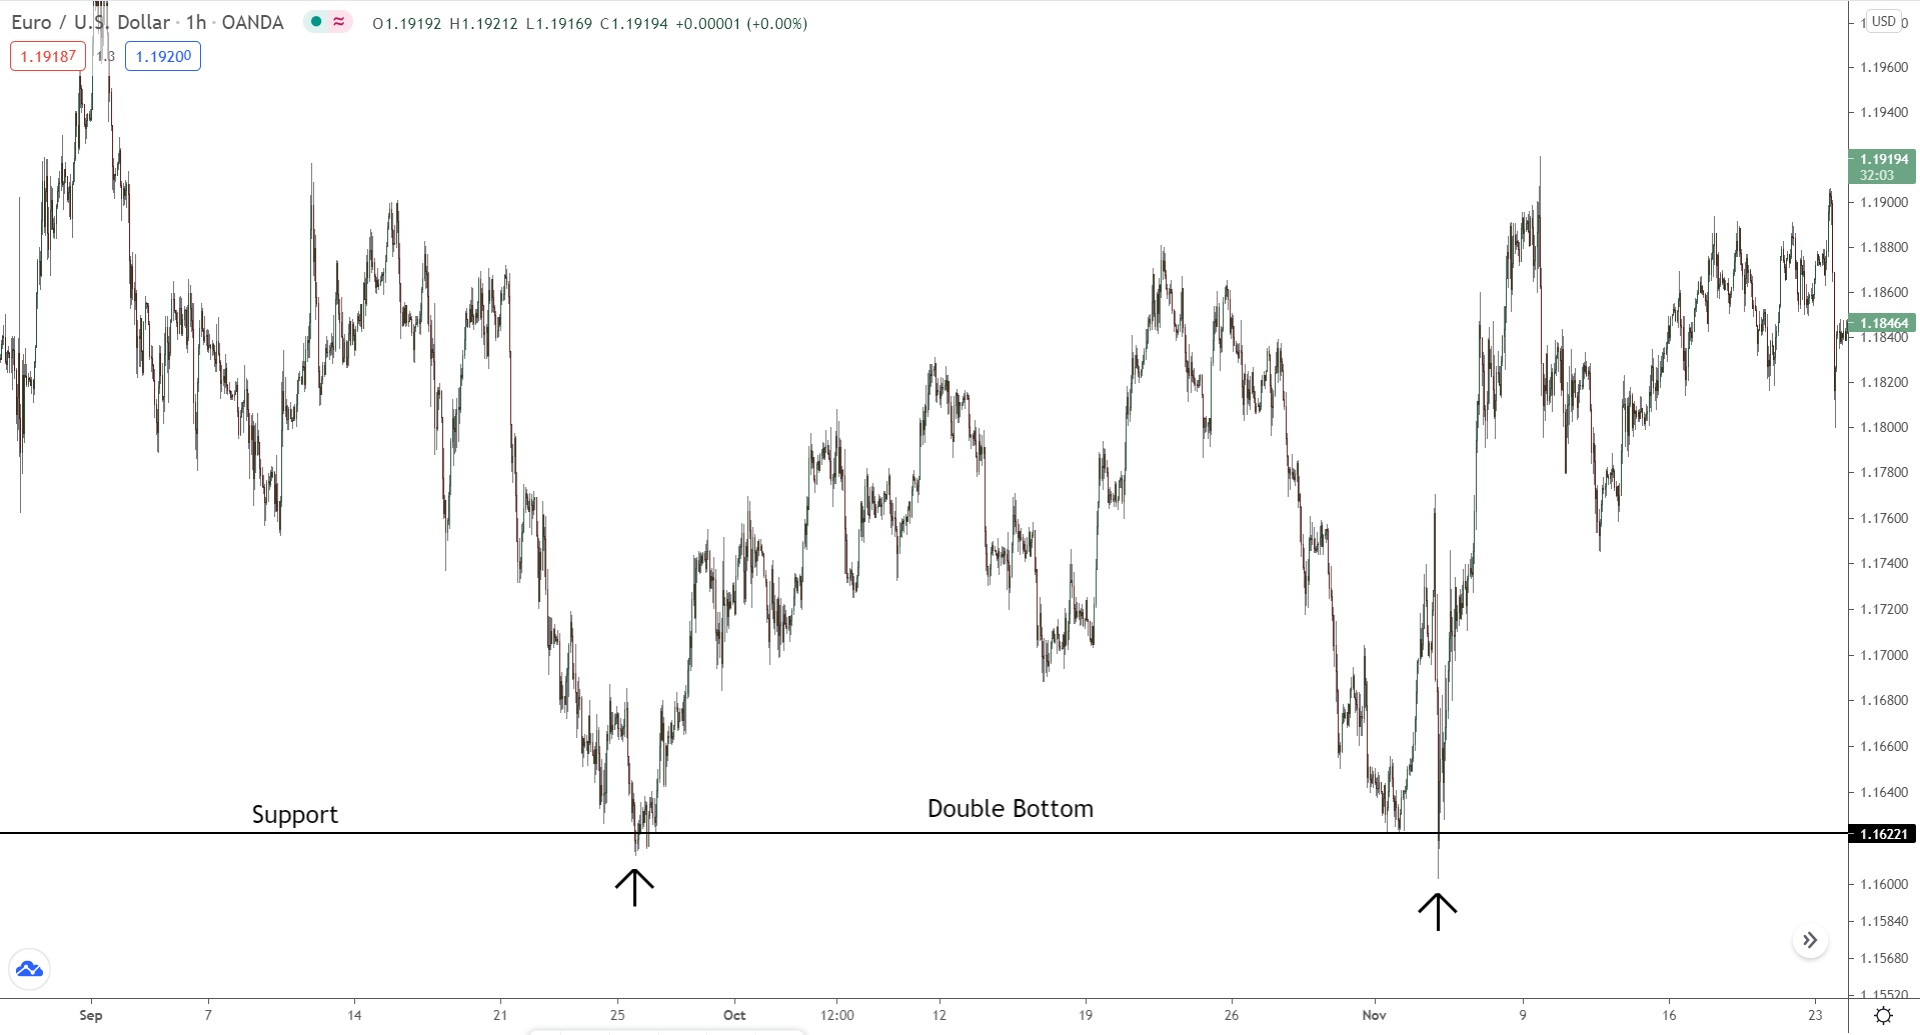
Here’s a double bottom that’s formed on the 1-hour chart of Eur/Usd.
To trade this pattern, let’s follow a few key steps:
FIRST: Wait for the pattern to form…
A double bottom is considered complete once the second bottom has fully formed. What does this mean? It’s when price moves lower, leaving a bottom in its wake. This bottom can be slightly higher or lower than the first bottom but not far away.
NEXT: Pay attention to price breaking the neckline…
On its own, a double bottom doesn’t indicate a reversal. You need to wait for confirmation. This comes when price breaches the neckline of the pattern.
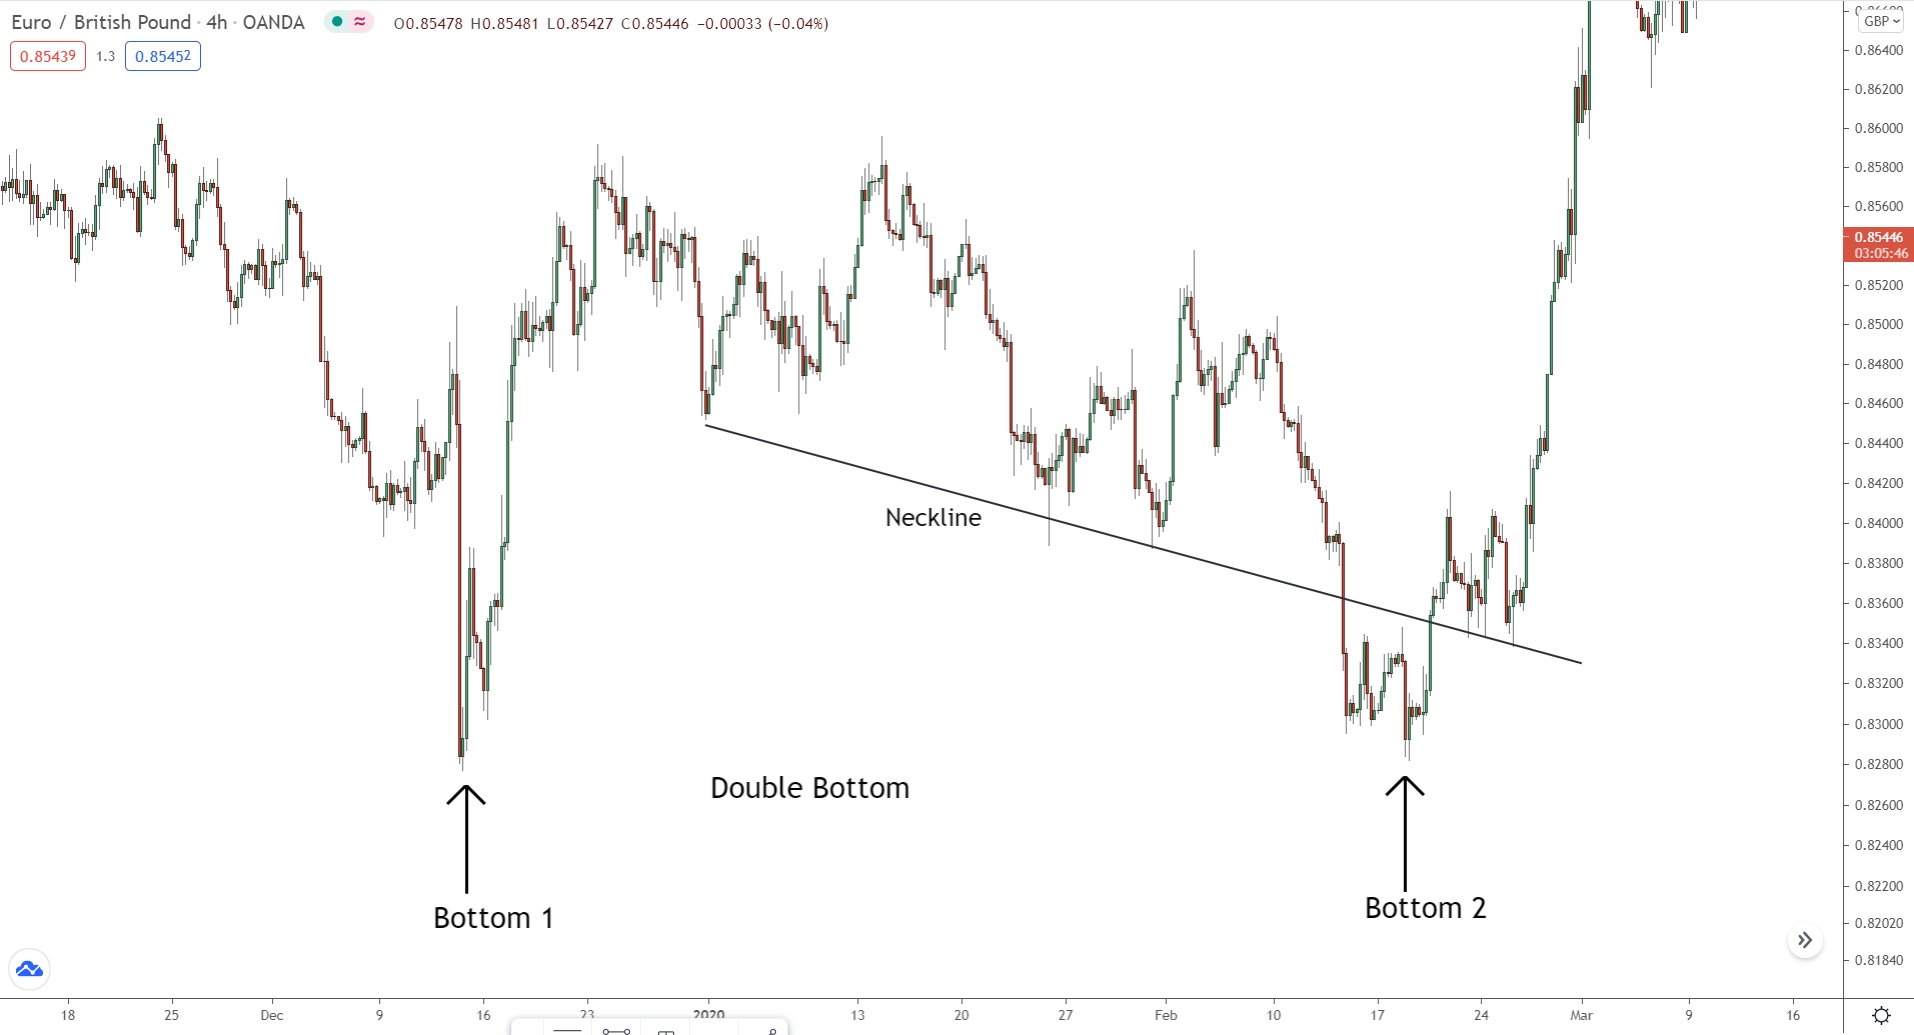
Now, what’s the neckline?
It’s the support level or trendline, created by the swing low before second bottom. The moment price breaches this point, the pattern is confirmed.
The market then stands a high chance (though not a certainty) of continuing to fall.
FINALLY: Wait for the entry signal to appear…
To enter a double top trade, wait until a PA signal pops up when the price retests the neckline break. While some may advise immediate entry post the neckline break, it’s safer to await price action.
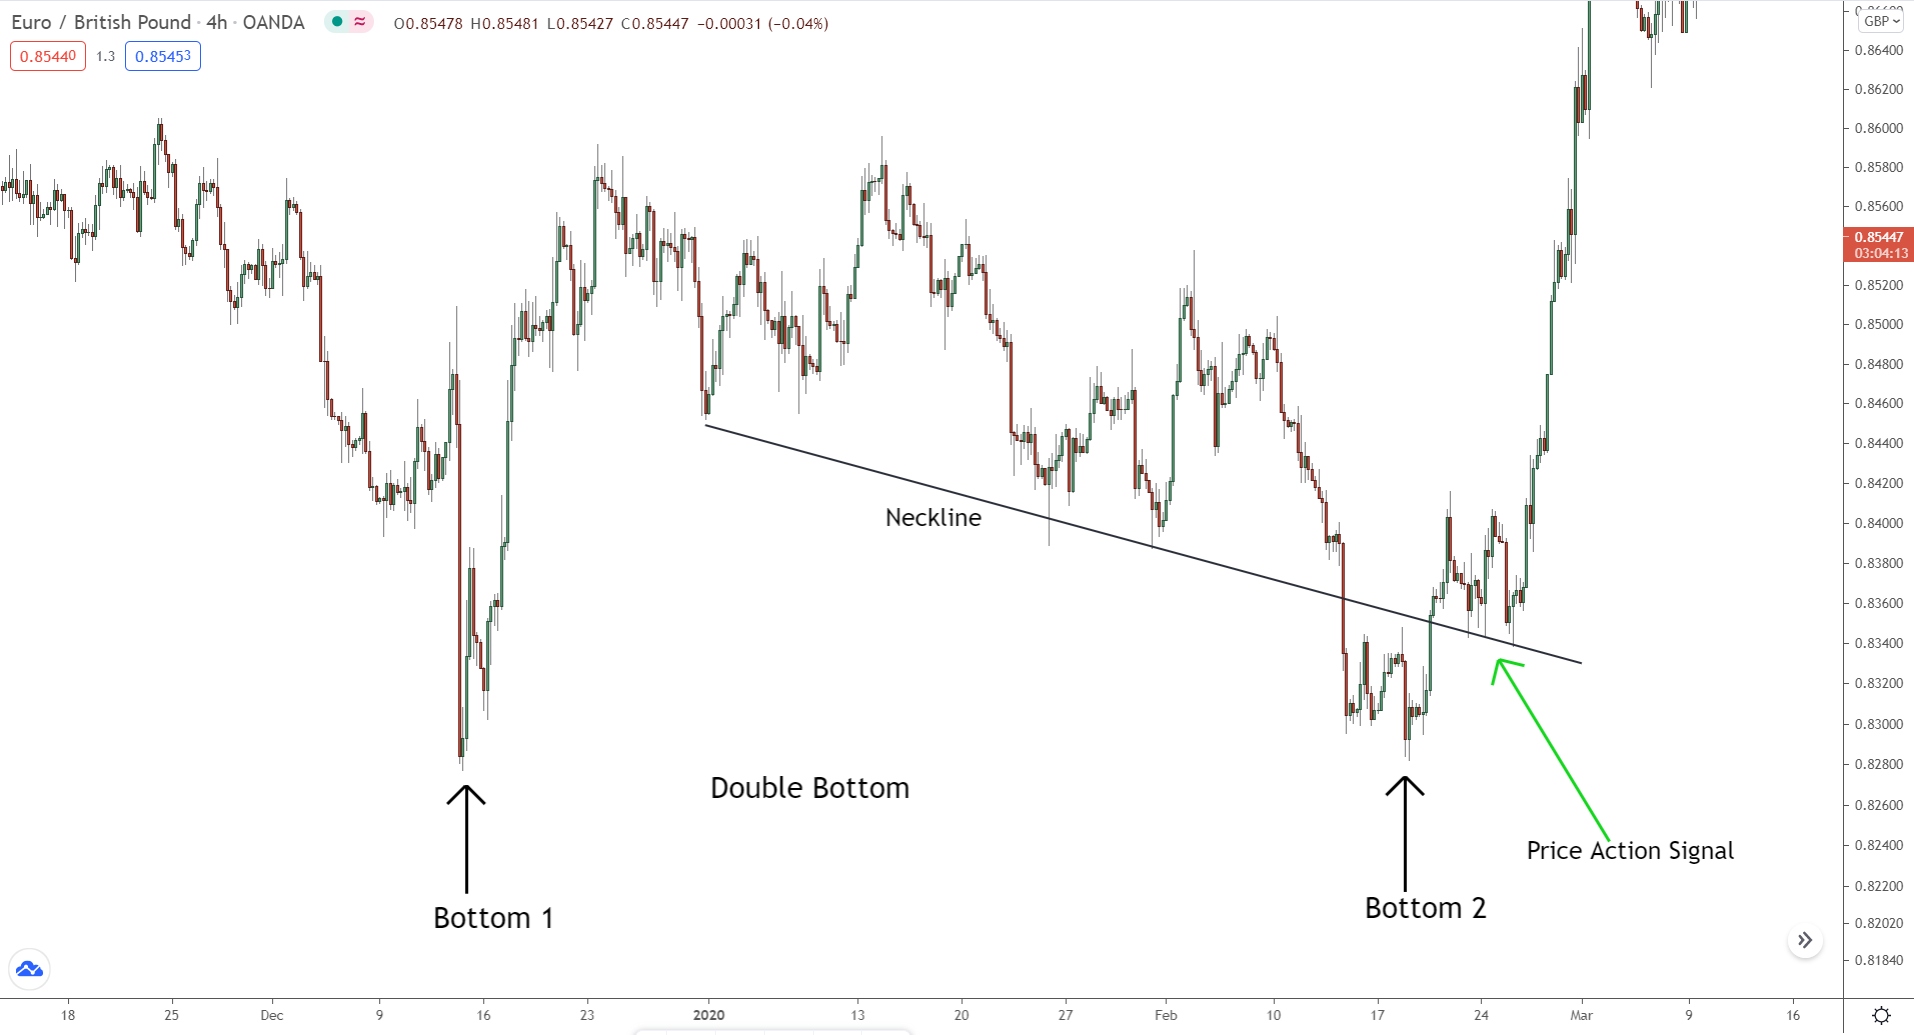
Once you’ve entered a trade, place your stop just BELOW the lowest bottom. Although it’s unlikely for the price to return to this point, as the old saying goes… better safe than sorry.
If the price moves well above the neckline, it’s a great chance to shift your stop to the most recent low to mitigate risk and lock in profits.
If you’re keen on trading the double top, the above steps hold true.
Just swap “top” with “bottom,” and you’re all set!
All other aspects, like entry points, profit-taking, and so forth, remain the same.
Key Points To Remember:
#1. The second bottom or top doesn’t have to line up perfectly.
When it comes to the double top/bottom pattern, the second tops or bottoms need to align reasonably well, but they don’t have to line up perfectly. A slight deviation above or below is acceptable. However, if the second top or bottom forms far away from the first, it invalidates the pattern.
No hard and fast rules guide this, so trust your eyes and experience.
#2. The higher the timeframe, the bigger the reversal.
This isn’t specific to the double top or bottom pattern, but it’s worth noting. Generally, the larger the timeframe in which a chart pattern appears, the more substantial the reversal will be.
Plus, they’re usually more accurate.
Three Drives Higher/Lower
This isn’t exactly a ‘chart pattern’, but it’s a tool that can help you gauge the market better and make more strategic trading decisions.
We’re talking about the ‘three drives lower/high pattern’ here.
The three drives pattern forms when the price makes three swings (or ‘drives’) in the same direction, ultimately leading to a reversal, retracement, or consolidation.
Why does this happen?
It’s all about the herd psychology at play in forex.
Let’s break it down with an example:
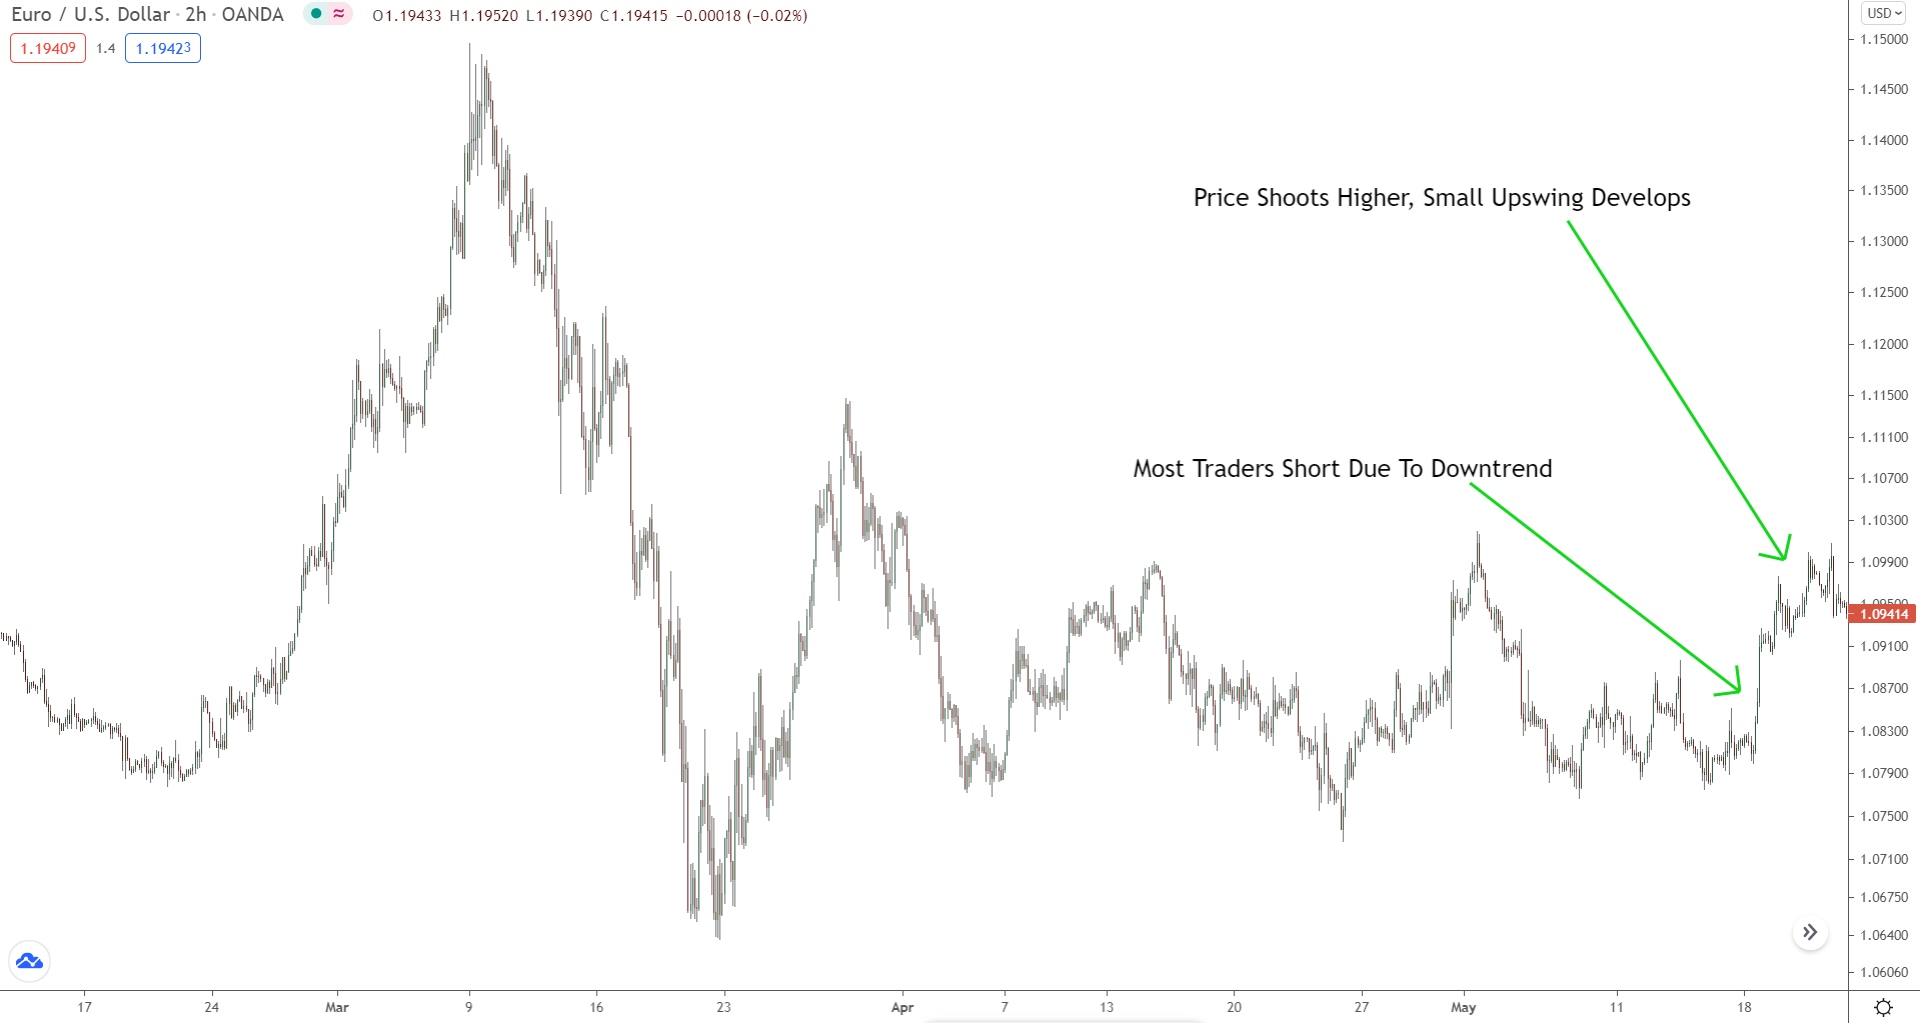
Price is falling, so most traders are shorting at this point.
Then, out of nowhere, price shoots higher, thus creating a new upswing.
What do you think most traders are doing?
Are they maintaining their short positions or entering long?
It’s a toss-up, right?
There’s a good chance it’s a 50/50 split. Many traders might still be shorting due to the previous downtrend. However, the new upswing could have encouraged an equal number of traders to go long, seeing as the price now appears bullish.
And then, just as things are getting interesting, price shoots higher again…
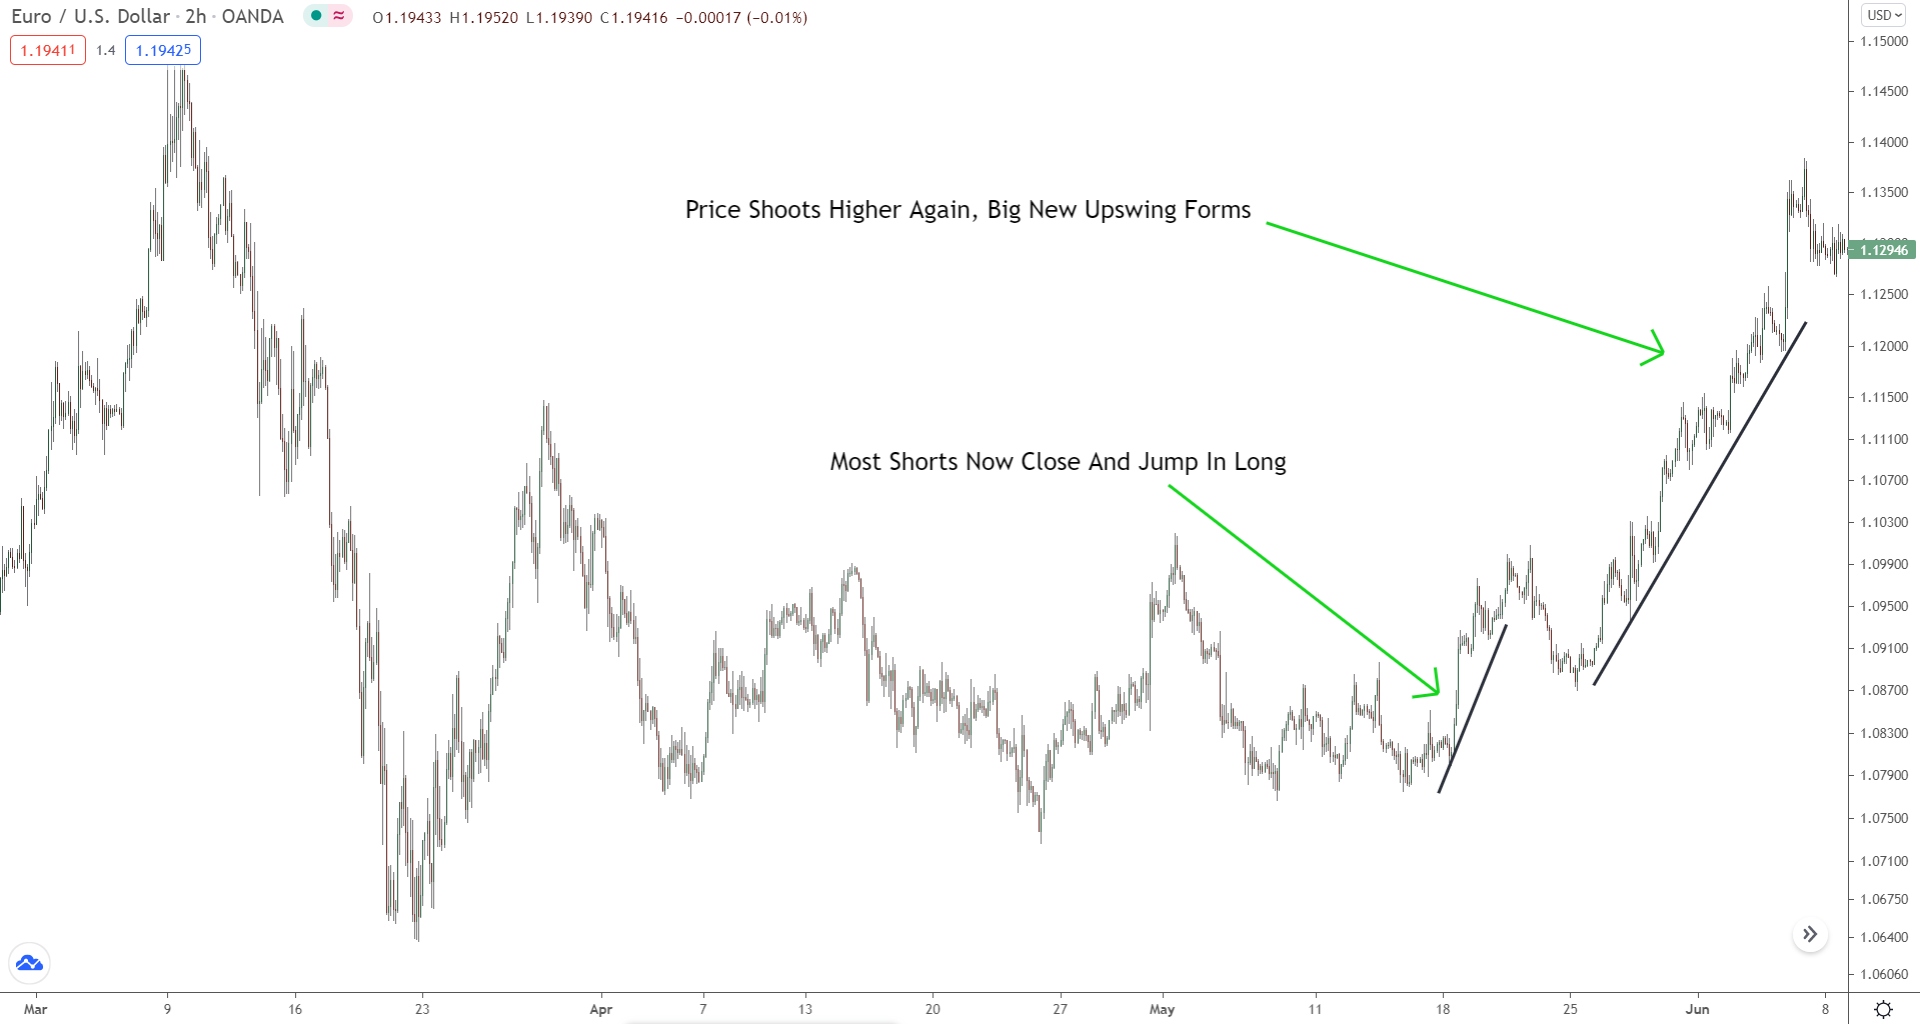
What’s the next move for most traders?
Do they maintain their short positions?
Nope, the majority are now switching gears to go long. Why? Because the market suddenly looks significantly more bullish.
Previously, price appeared bearish due to the preceding downtrend. However, with the fresh upward swing in place, the market appears much more bullish. The previous downward movement is practically invisible now. Hence, it’s no surprise most traders are now entering long positions.
After a period of consolidation, we notice yet another uptick…
So, what’s the move for traders at this point?
You guessed it!
They’re going long!
The market is soaring after all!
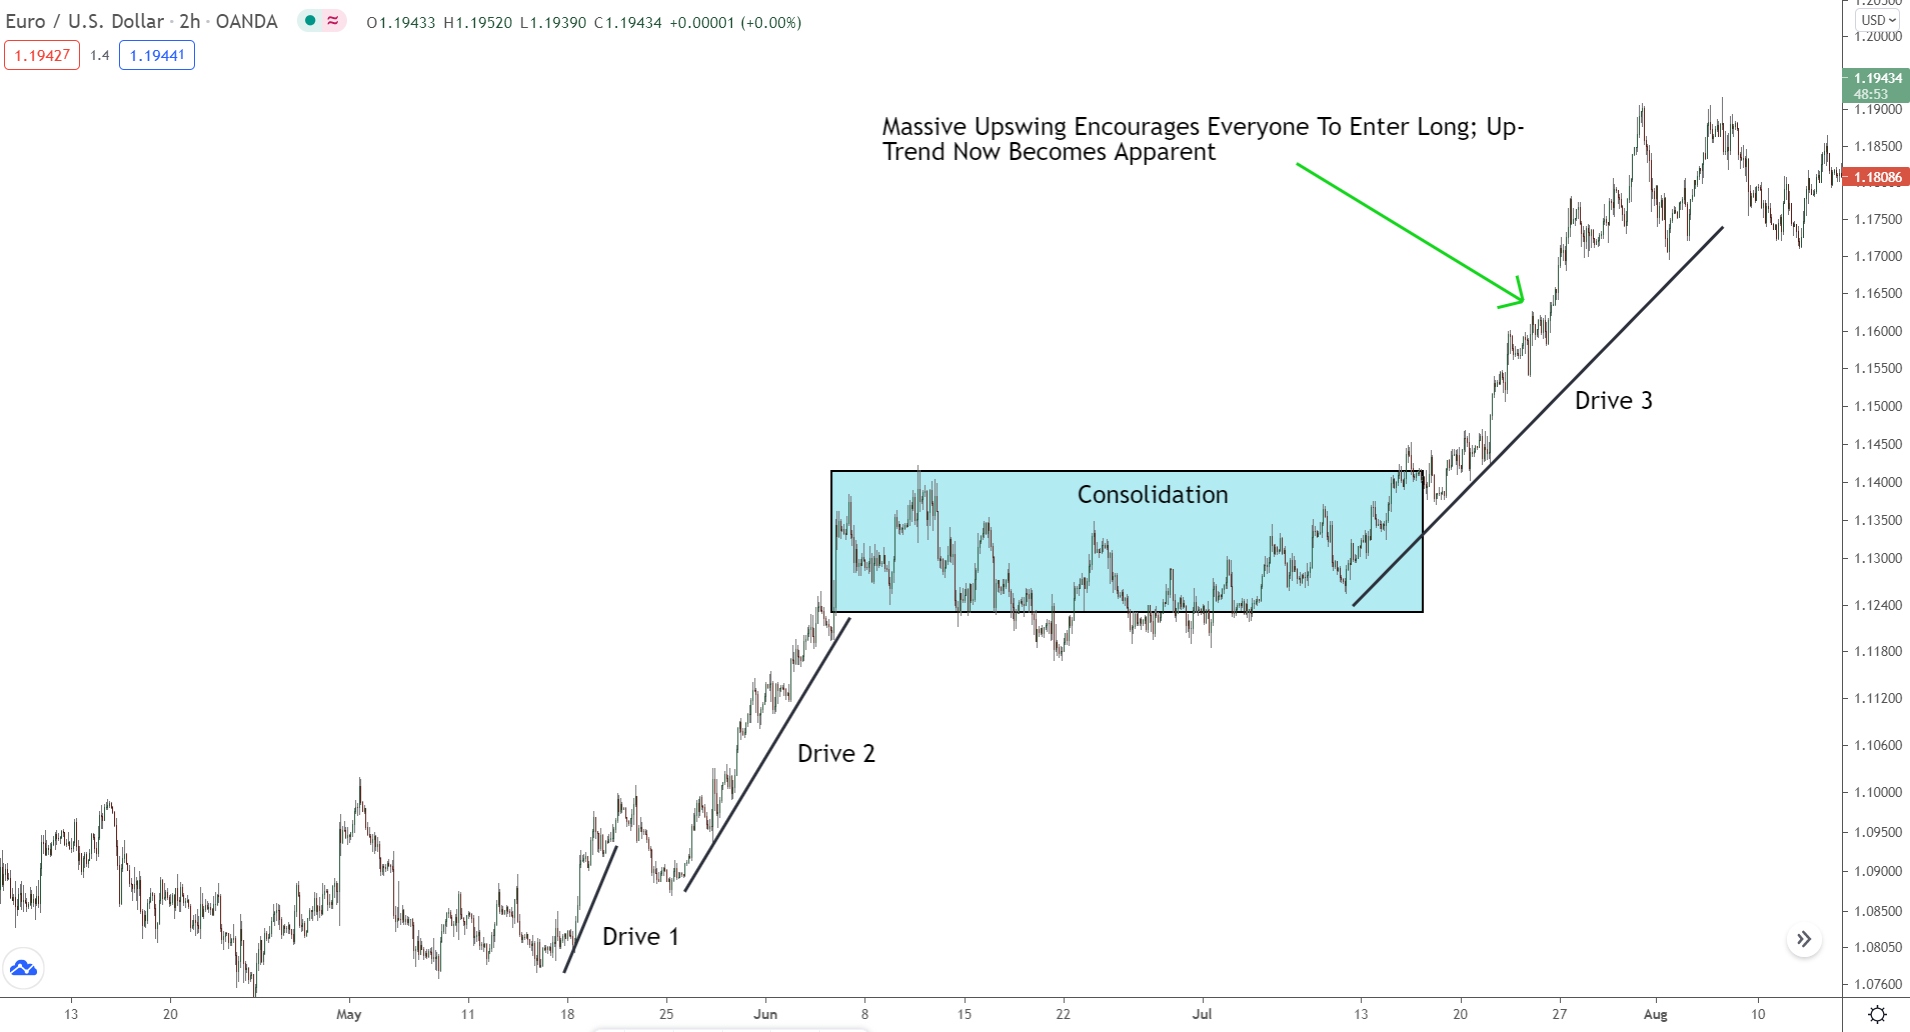
By the time we witness the third swing, price has escalated so substantially that most traders are going long, aiming to capitalize on what they perceive as an imminent continuation. This is when we’re likely to see price either reverse, retrace or begin to consolidate.
At this point, the market’s intentions are blatantly obvious…
Anyone can see price is breaking higher; it’s clear day!
This is when the big players feel compelled to stir things up and create a counter move. This move is designed to create confusion once again, allowing them to recalibrate their positions and/or enter in the opposite direction.
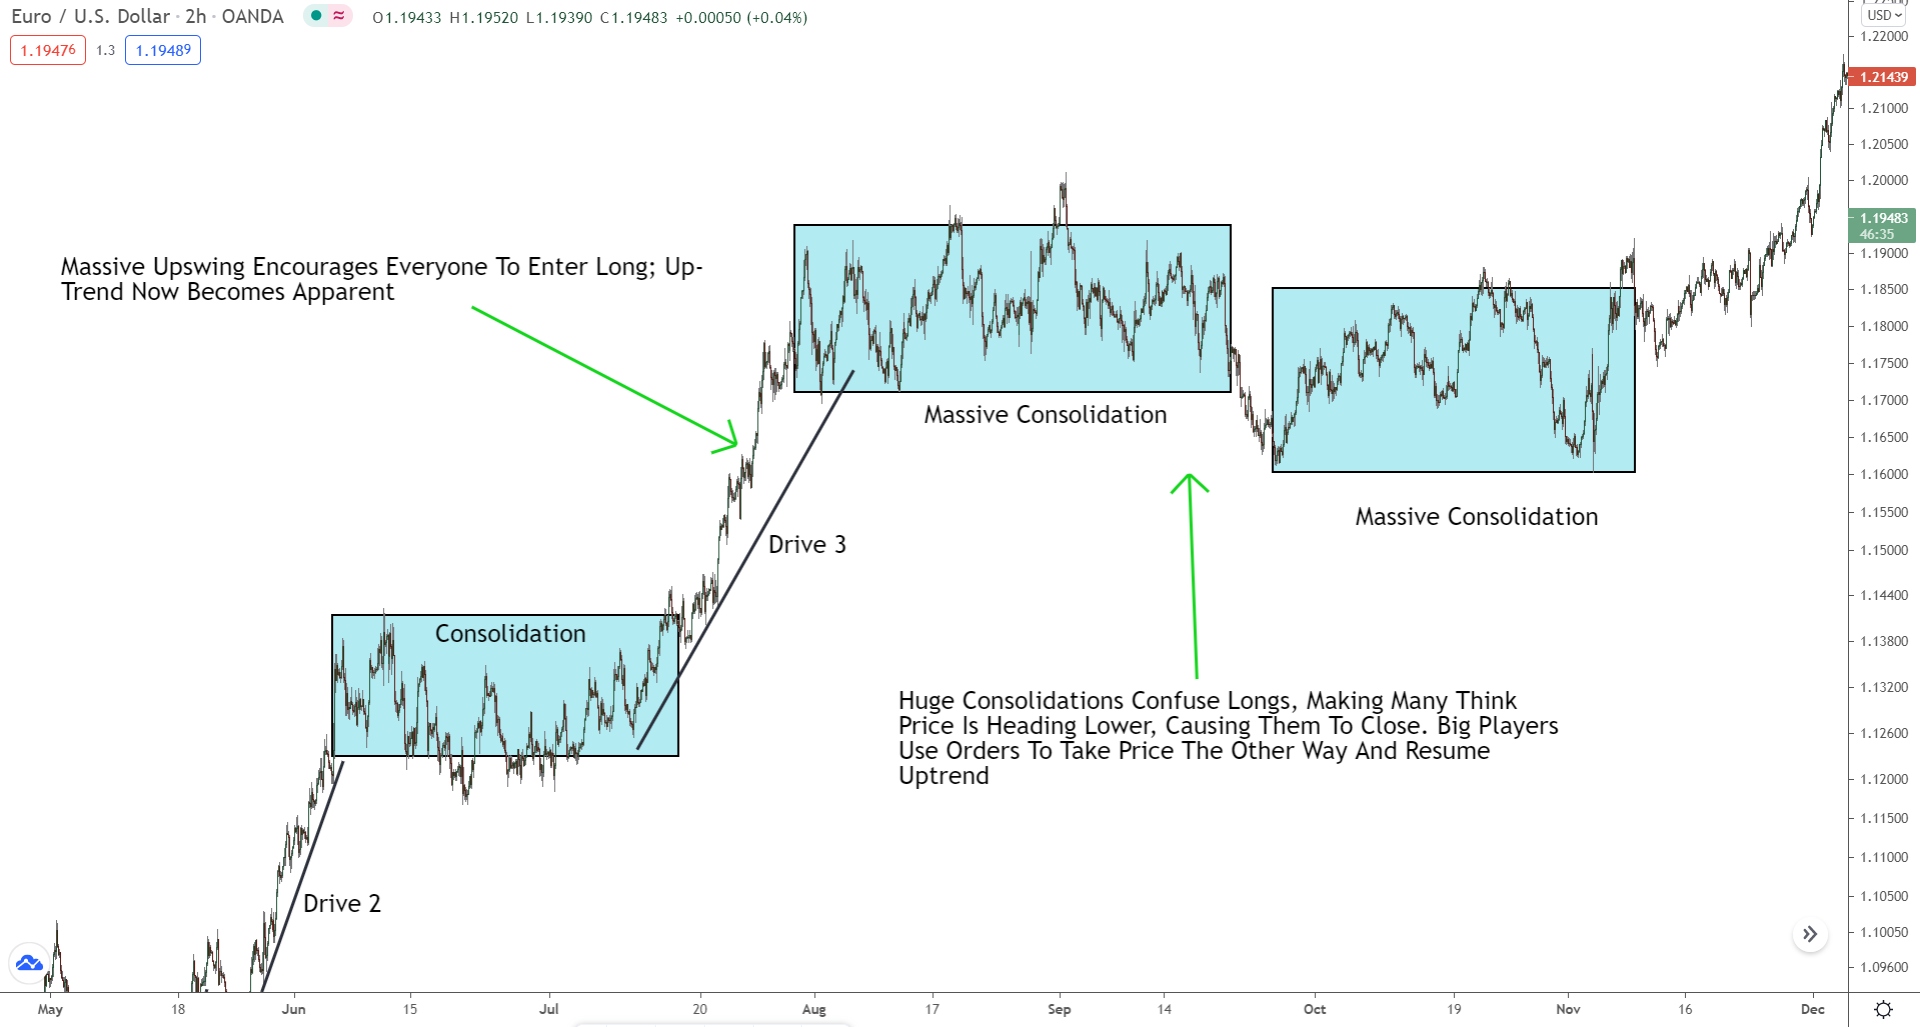
In our case, let’s consider a major consolidation.
The consolidation befuddles those who entered long, compelling many to close their positions! That then paves the way for the big players to buy at better prices, thus sparking the subsequent upward move we see.
Now, the three drives higher/lower isn’t technically a chart pattern, so it’s not something you can trade like the other patterns on this list. But it’s highly useful for estimating when the price might reverse, retrace, or consolidate.
Picture this scenario…
After a period of price rising, you spot the three drives higher pattern. The first drive kickstarts the reversal, with the second propelling the market higher.
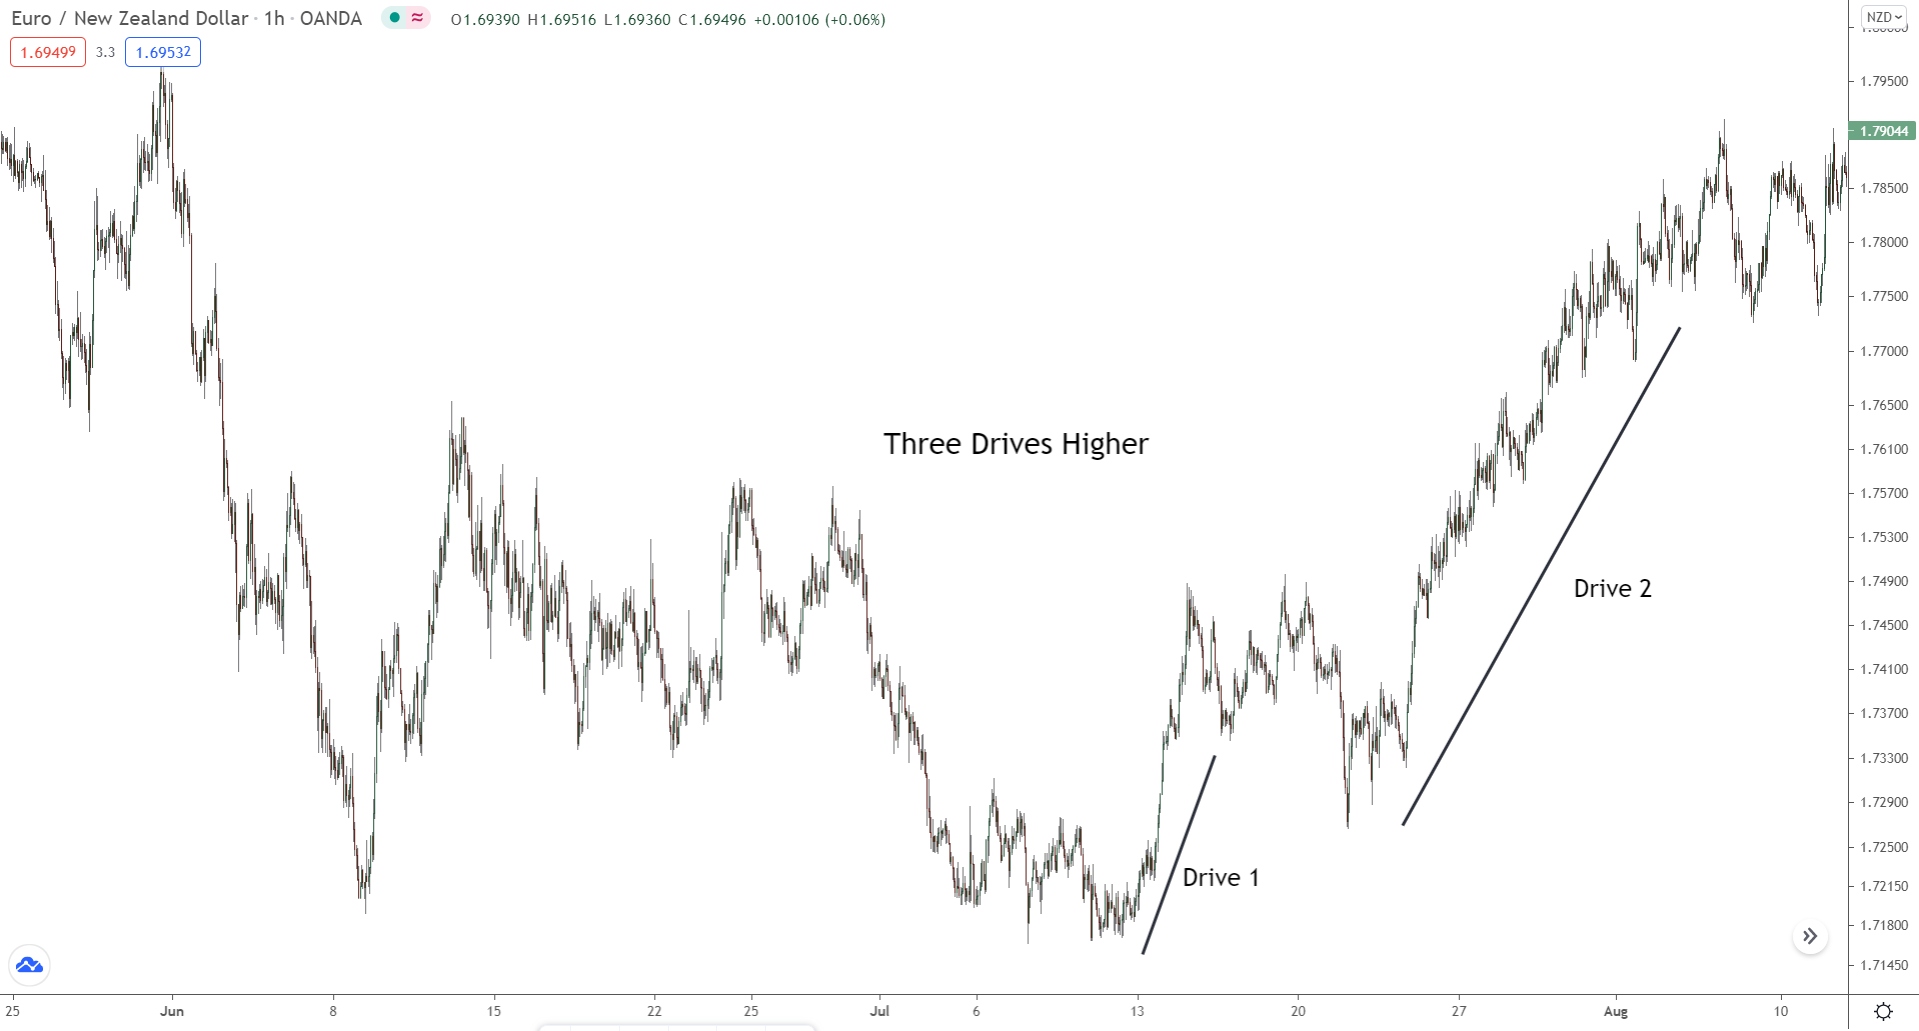
From observing this pattern, you know another drive higher is on the horizon. Moreover, you understand price will likely reverse, retrace, or consolidate once this drive terminates.
Now, if we look at the image again…
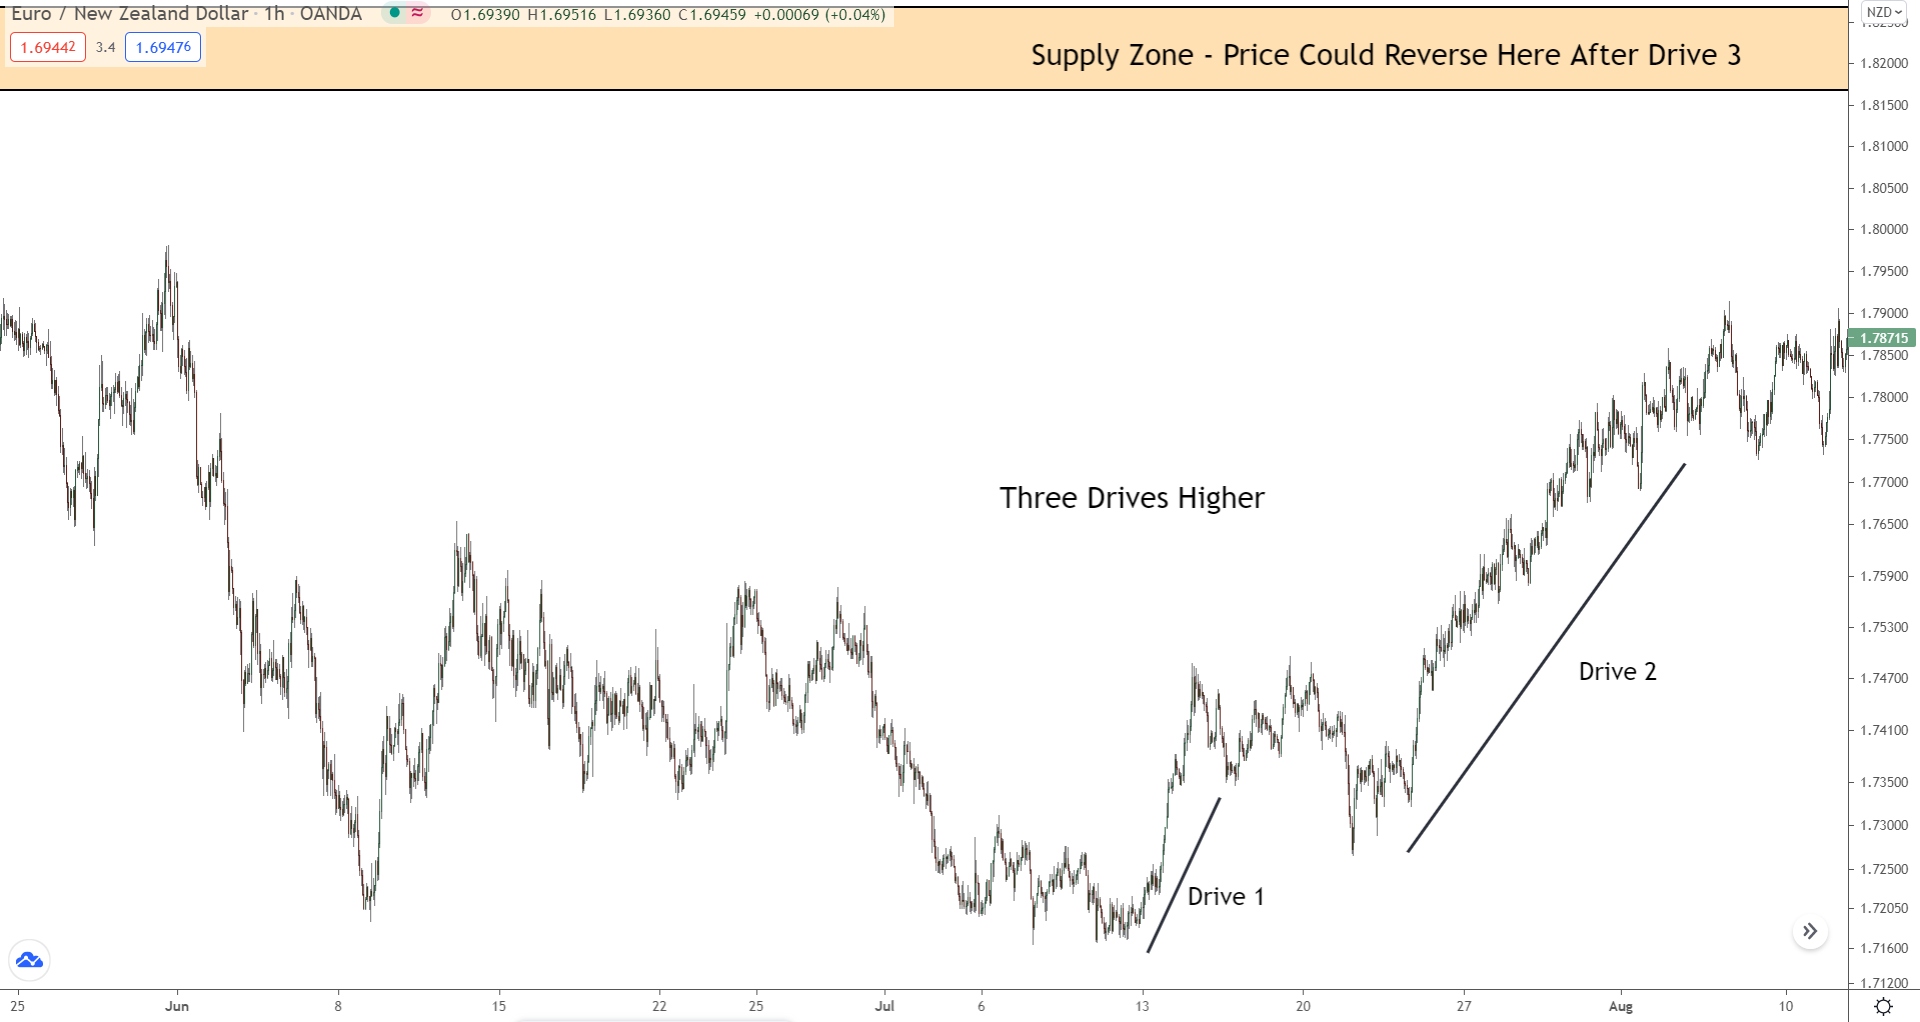
You’ll notice a supply zone isn’t far off from the current price action.
This zone indicates a point where price has a high probability of reversing. If we see another drive higher, it’s likely the price will reverse at this zone.
So, we should be on the lookout for an entry signal to see if we can catch the reversal.
And then, what happens…
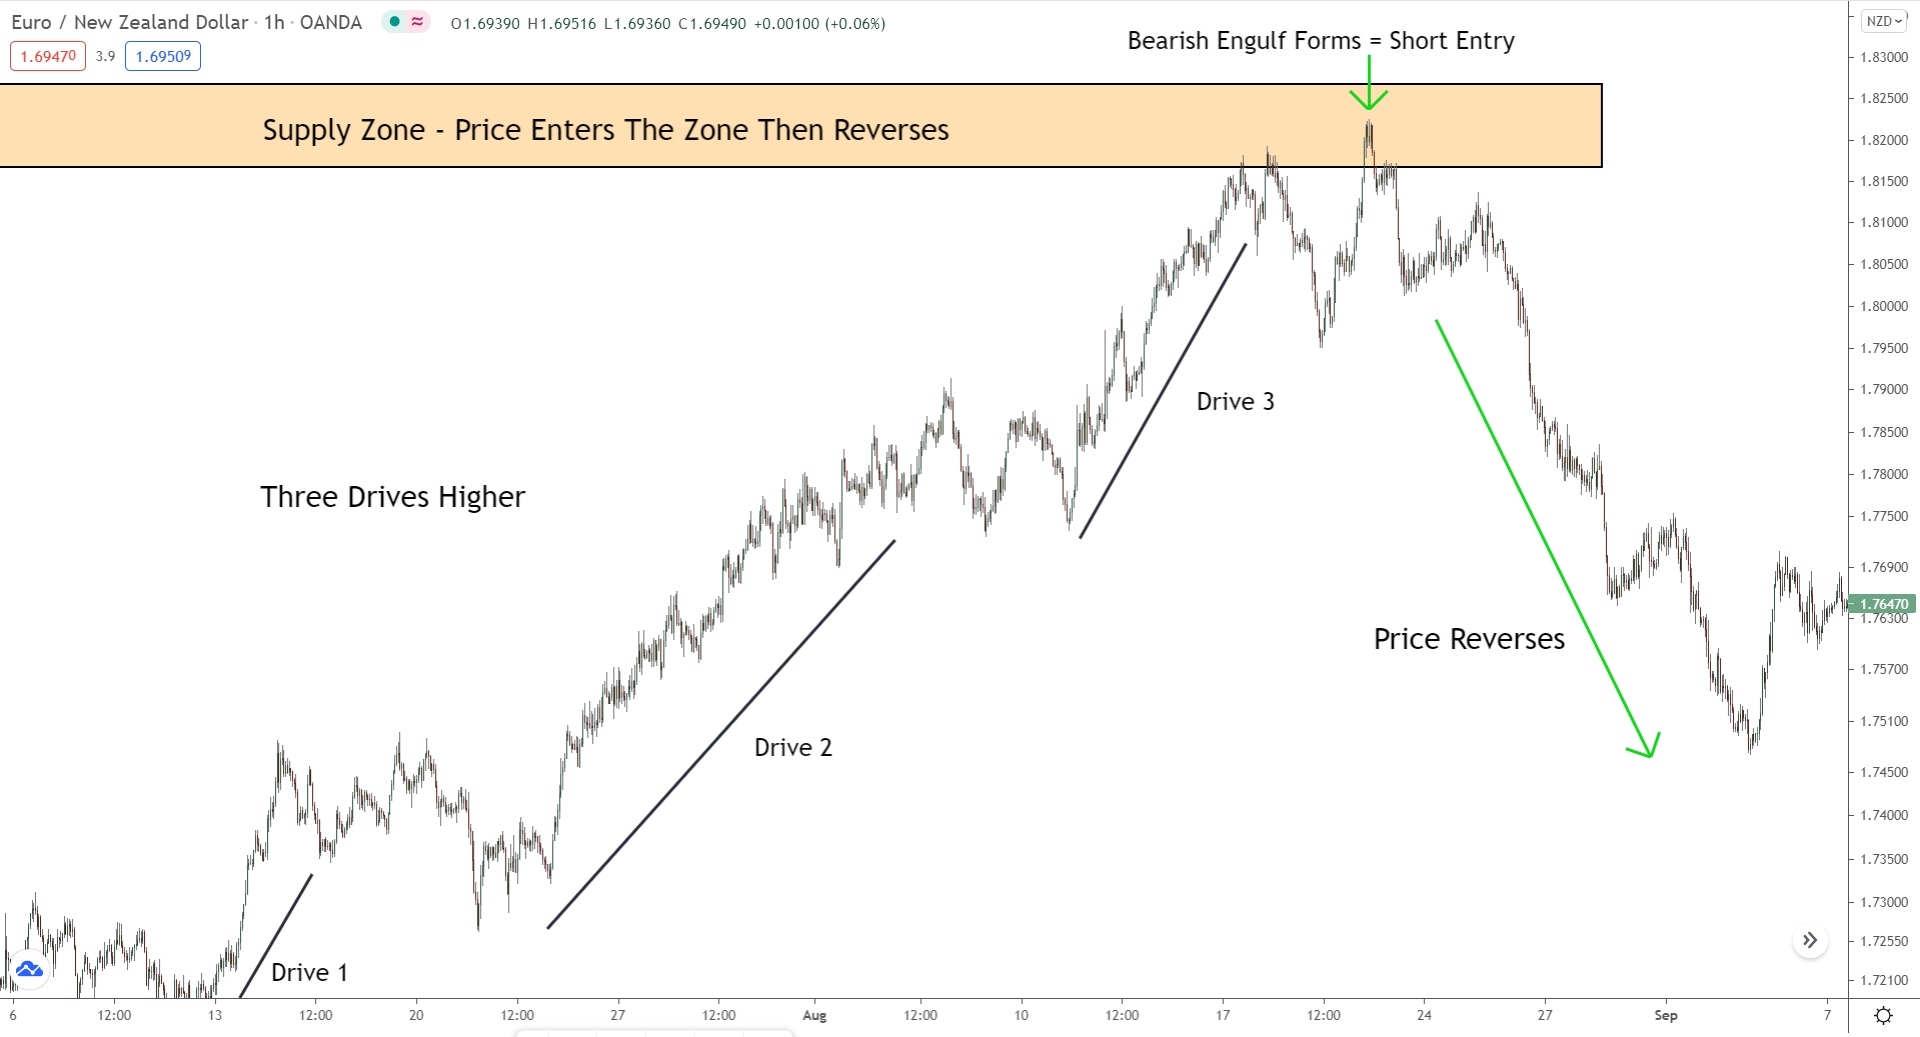
A huge bearish engulf forms within the zone… and voila!
We witness a substantial reversal.
See the value in understanding the three drives now?
While it doesn’t serve up precise entry signals like your typical chart patterns, they do offer insight into the current move’s positioning. By combining this with other technical analysis factors, you can pinpoint when and where price may reverse.
Give it a shot yourself… you’ll quickly see the potency of the three drives higher/lower patterns.
Key Points To Remember:
- #1: The middle drive often outlasts the others.
Within the three drives pattern, it’s usually drive #2 that lasts the longest and triggers the largest price shift. That’s the moment when most traders perceive a significant new swing in progress and enter to capitalize on the move.
- #2: After each drive, price will consolidate, retrace, or pause.
The three drives pattern always ends with a reversal, retracement, or consolidation. However, each drive itself also results in a consolidation, retracement, or pause.
Use this to determine when to take profits and/or add more positions.
Multiple Highs/Lows Forming At Similar Prices
More a structure than a pattern, seeing multiple swing highs or lows form at similar prices signals a large reversal might be brewing behind the scenes.
This boils down to how the big players execute their trades.
Remember: The banks and other big players can NEVER enter a massive trade in one go. They consistently lack enough opposing traders on the buying or selling side.
Their solution?
Split the trade into bite-sized chunks.
By dividing the trade, the banks decrease the number of opposing buyers or sellers required.
Instead of needing tens of thousands to take the opposite side, now they only need a few thousand. This simplifies their entry and makes it far easier to enter their massive position.
On a chart, this process unfolds something like this…
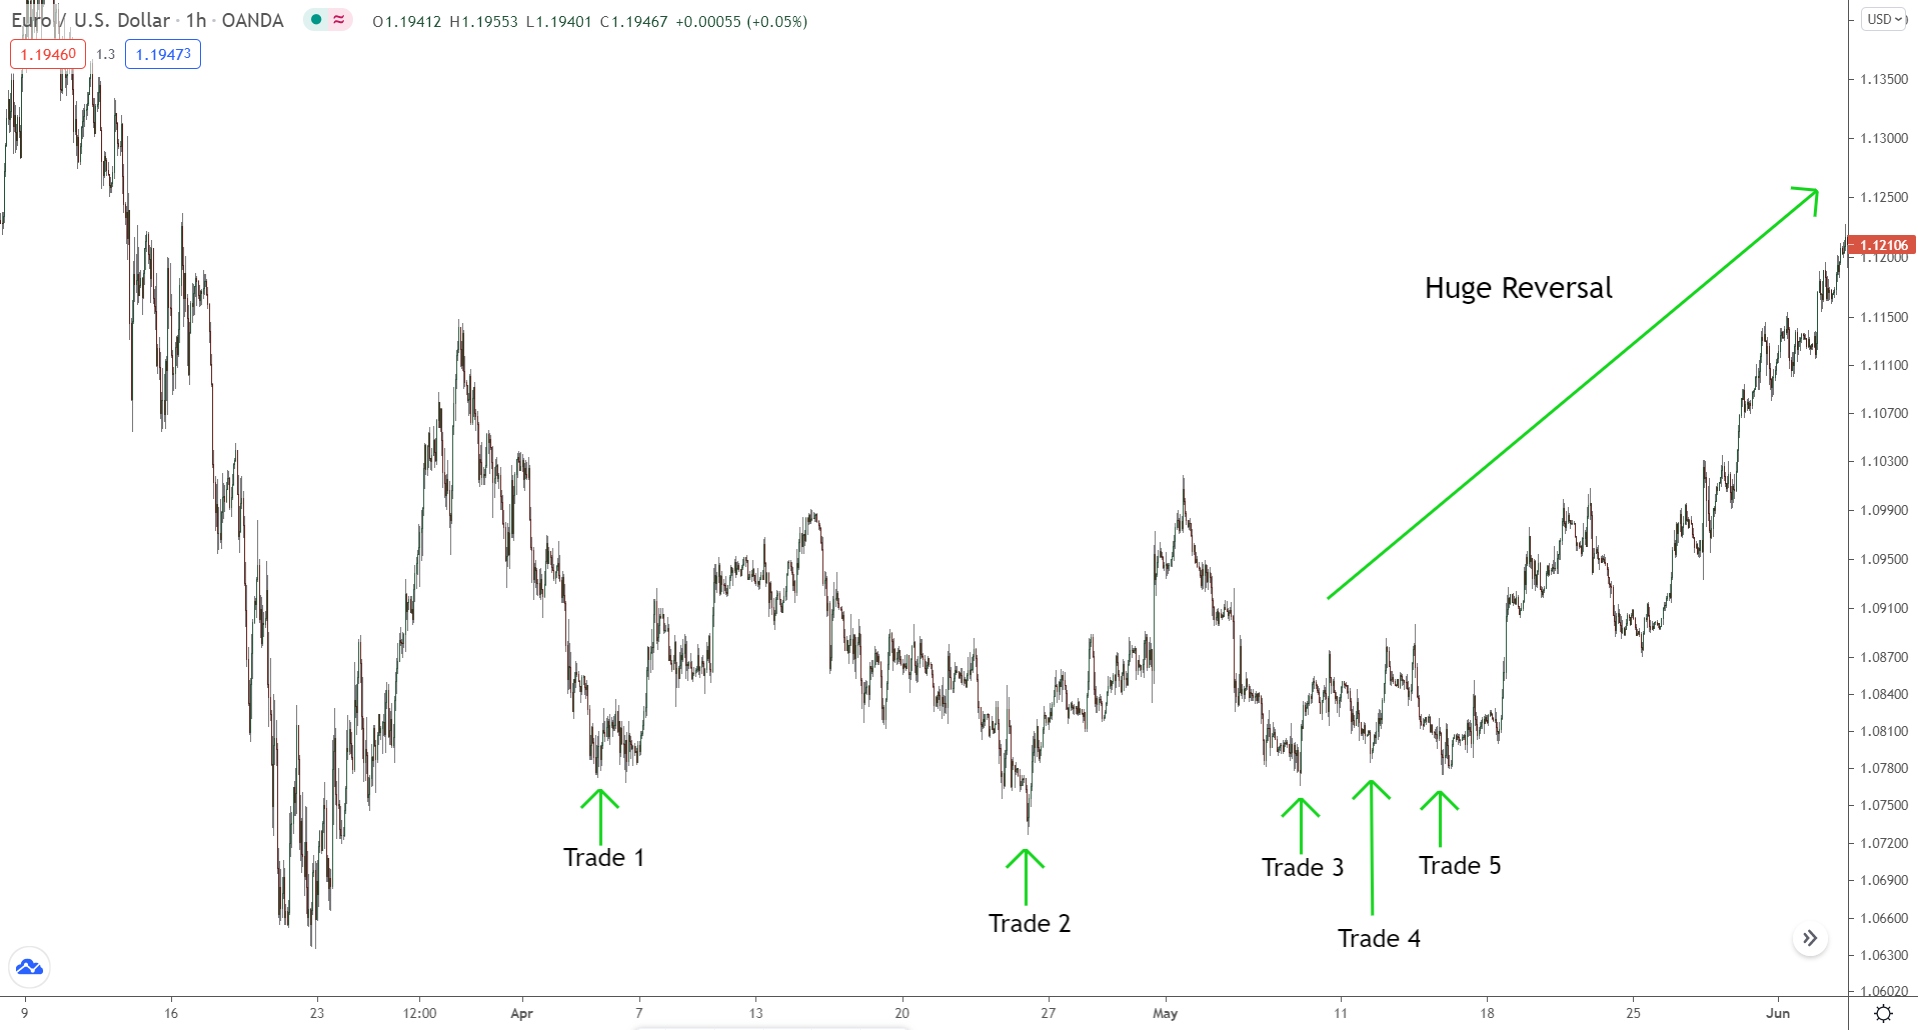
Notice multiple swing lows forming at similar prices?
Each of these lows represents a small buy trade placed by banks. The low forms every time banks decide to enter one of their small trades.
See how each low forms at a somewhat similar price.
Now, that’s not a coincidence… it’s a calculated move.
By entering each trade at a near-identical price, banks mimic the effect of one trade placed at a single price – their ultimate goal if they could free up enough orders. Each trade is roughly the same size and so makes a similar amount of profit and requires similar management.
Okay, so how does it benefit our trading?
How can we turn this knowledge to our advantage?
Think about this…
If multiple highs/lows forming at similar prices signal the banks are breaking down their trades, it could mean a major reversal is on the horizon. After all, why else would they split a mammoth trade into smaller, more manageable bits?
This is where we can make our move…
We can use this insight to forecast significant reversals.
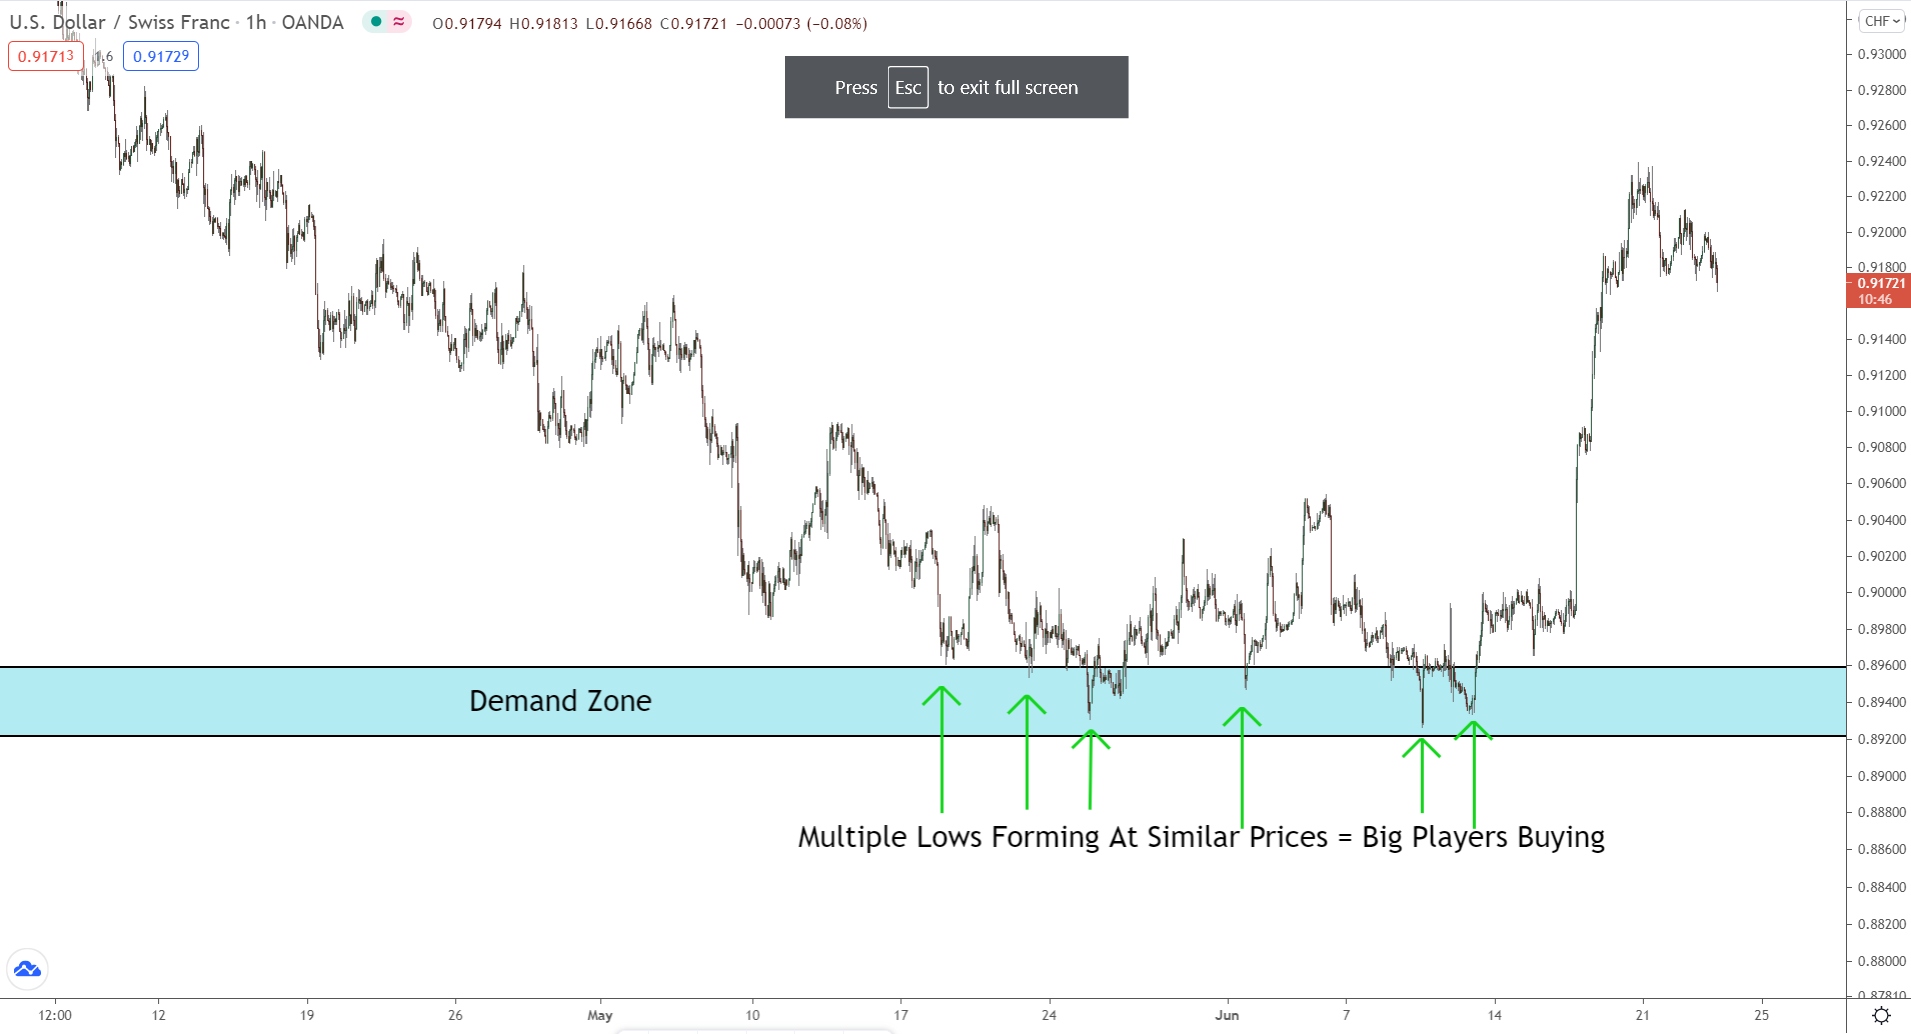
Let’s say we see price bottoming out around a crucial technical point and multiple swing lows forming at similar prices. It’s a pretty solid hint a large reversal might be brewing. That gives us the opportunity to either get in early or close any open short trades we’ve got going.
Pretty slick, right?
The Bottom Line
Reversal patterns can take on an array of shapes, sizes, and structures. But, the 5 patterns we discussed today (6 if we count the bonus one) are the cream of the crop. They’re the ones to keep a sharp eye out for when trading.
From now on, be on the lookout for these patterns.
Soon, you’ll be reeling in the massive reversals.