
Today, I’m going to teach another one of my favourite harmonic pattern setups.
Harmonics don’t play a huge role in my trading, but I still keep my eye out for a few select patterns that can get my into high probability reversal or continuation trades.
One of which I’m going to show you into today’s post.
Enter: The Cypher pattern
The Cypher is well known in harmonic circles for being one of highest probability patterns, mainly due to its rarity but also because of the market psychology it reveals.
In this post, you’ll learn…
- What the Cypher pattern is,
- The right way to identify the pattern, and
- My way of trading the Cypher using S & D zones,
By the end, the Cypher will be another key continuation pattern in your arsenal. And you should have no problem spotting it on the charts and using the pattern in your trading.
And with that, let’s begin…
The Cypher Pattern: Quick Breakdown
Want a high probability reversal pattern that rarely fails?
… and can get you into great trades?
The Cypher is for you!
Discovered by Darren bends, the Cypher is an offshoot of the more widley known Butterfly pattern that provides high probability entry signals into reversal trades. The Cypher has a exceptionally high win rate, down to the fact that it rarely forms and reveals the big players want price to reverse.
The Cypher comes in two varieties:
Bullish Cypher – signals a continuation of the current uptrend.
Bearish Cypher – signals a continuation of the current downtrend.
Like all harmonics, the pattern follows a specific swing structure.
In this case, a wave like structure, comprised of 5 points: XABCD.
Together, these points create the pattern but ONLY if they meet certain Fibonacci ratio’s – more this later.
The Cypher usually forms towards the ends of trends, acting as a large-scale confusion event designed to lure many traders into entering with the trend before the banks and other big players come in and cause a large reversal.
The trapped traders liquidating their trades are what pushes price in the opposite direction once the reversal begins.
How To Identify The Cypher On Your Charts
Now for the hard part…
How to identify the Cypher on your chart.
Like most harmonics, the Cypher isn’t exactly easy to identify, at least without using indicators. Though the pattern has a clearer appearance than most other harmonics (I’m looking at you Crab pattern!), the swing structure still takes time to understand, as do the ratios used to validate its construction.
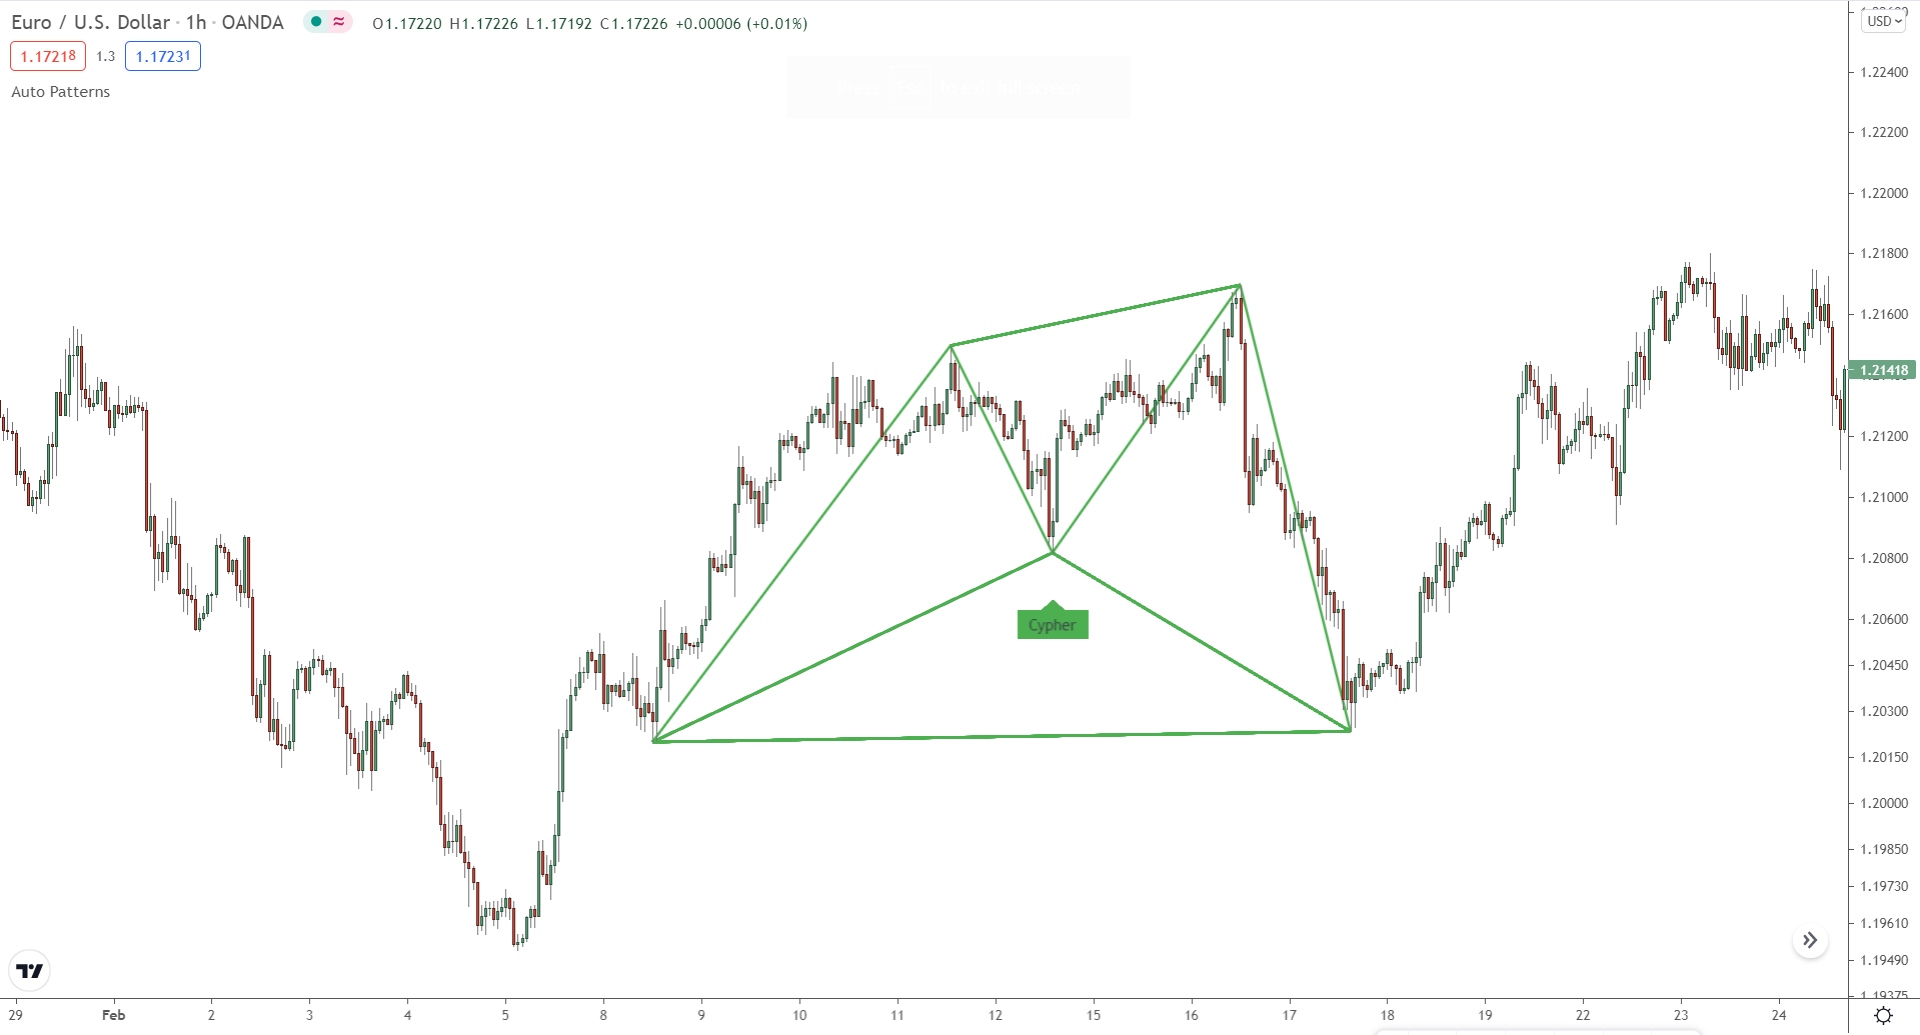
Let’s use an example, so you can see how it works…
Important:
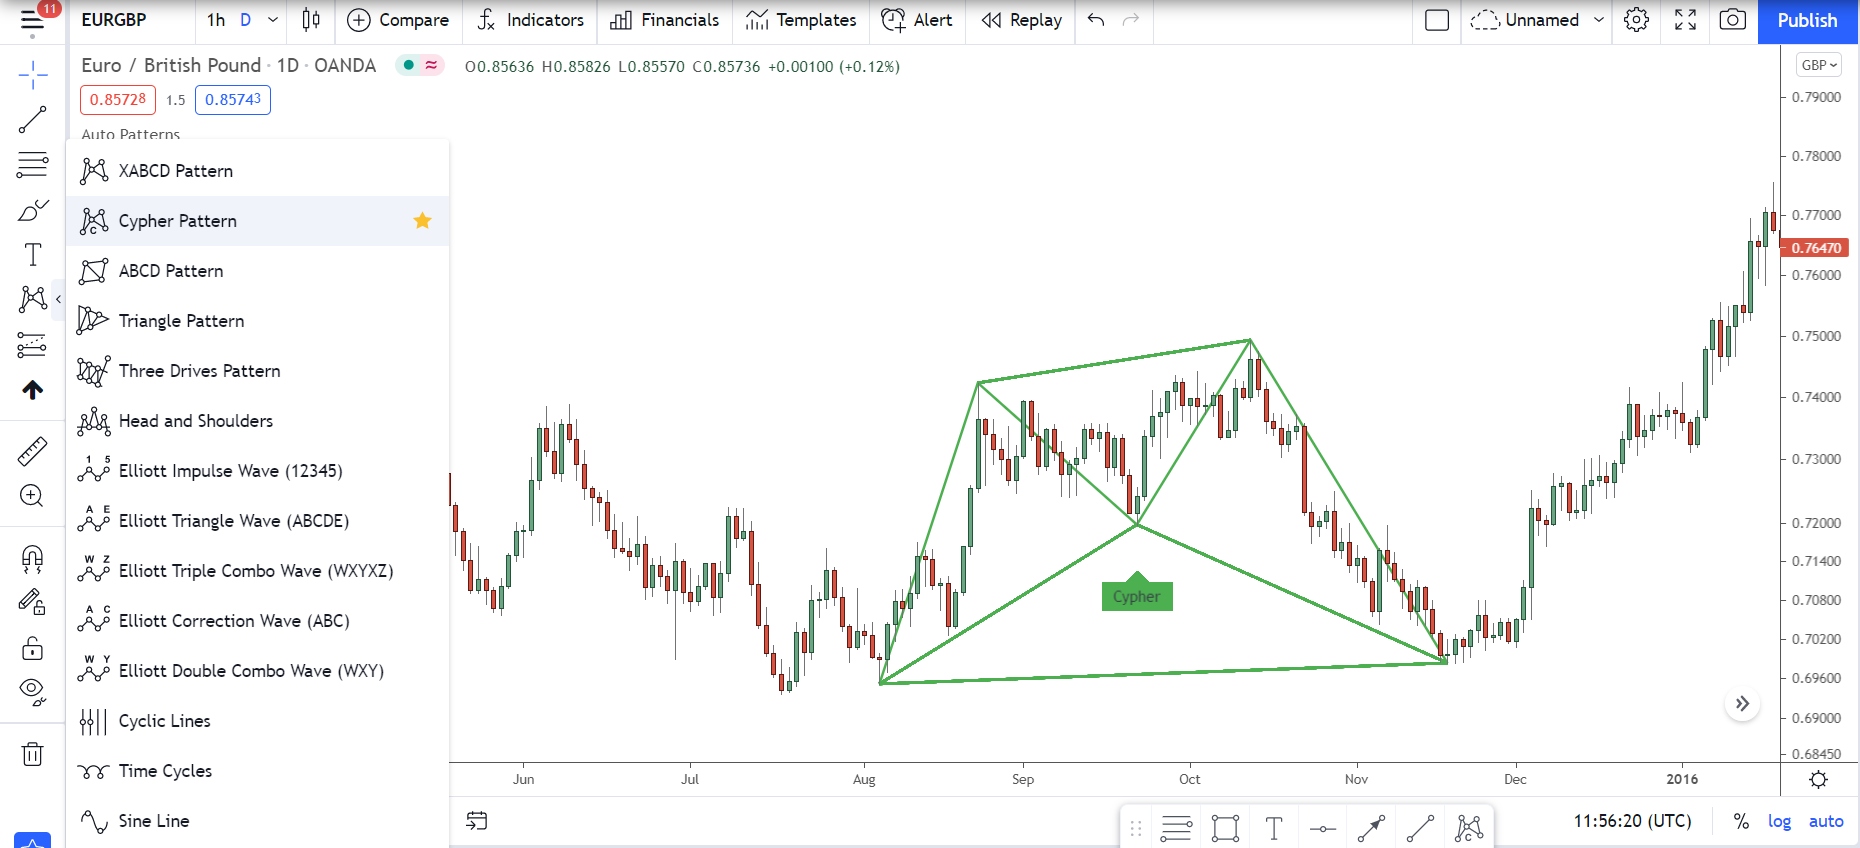
If you want to remove the hassle of finding harmonic patterns, check out the “Auto Patterns” indicator on Tradingview.
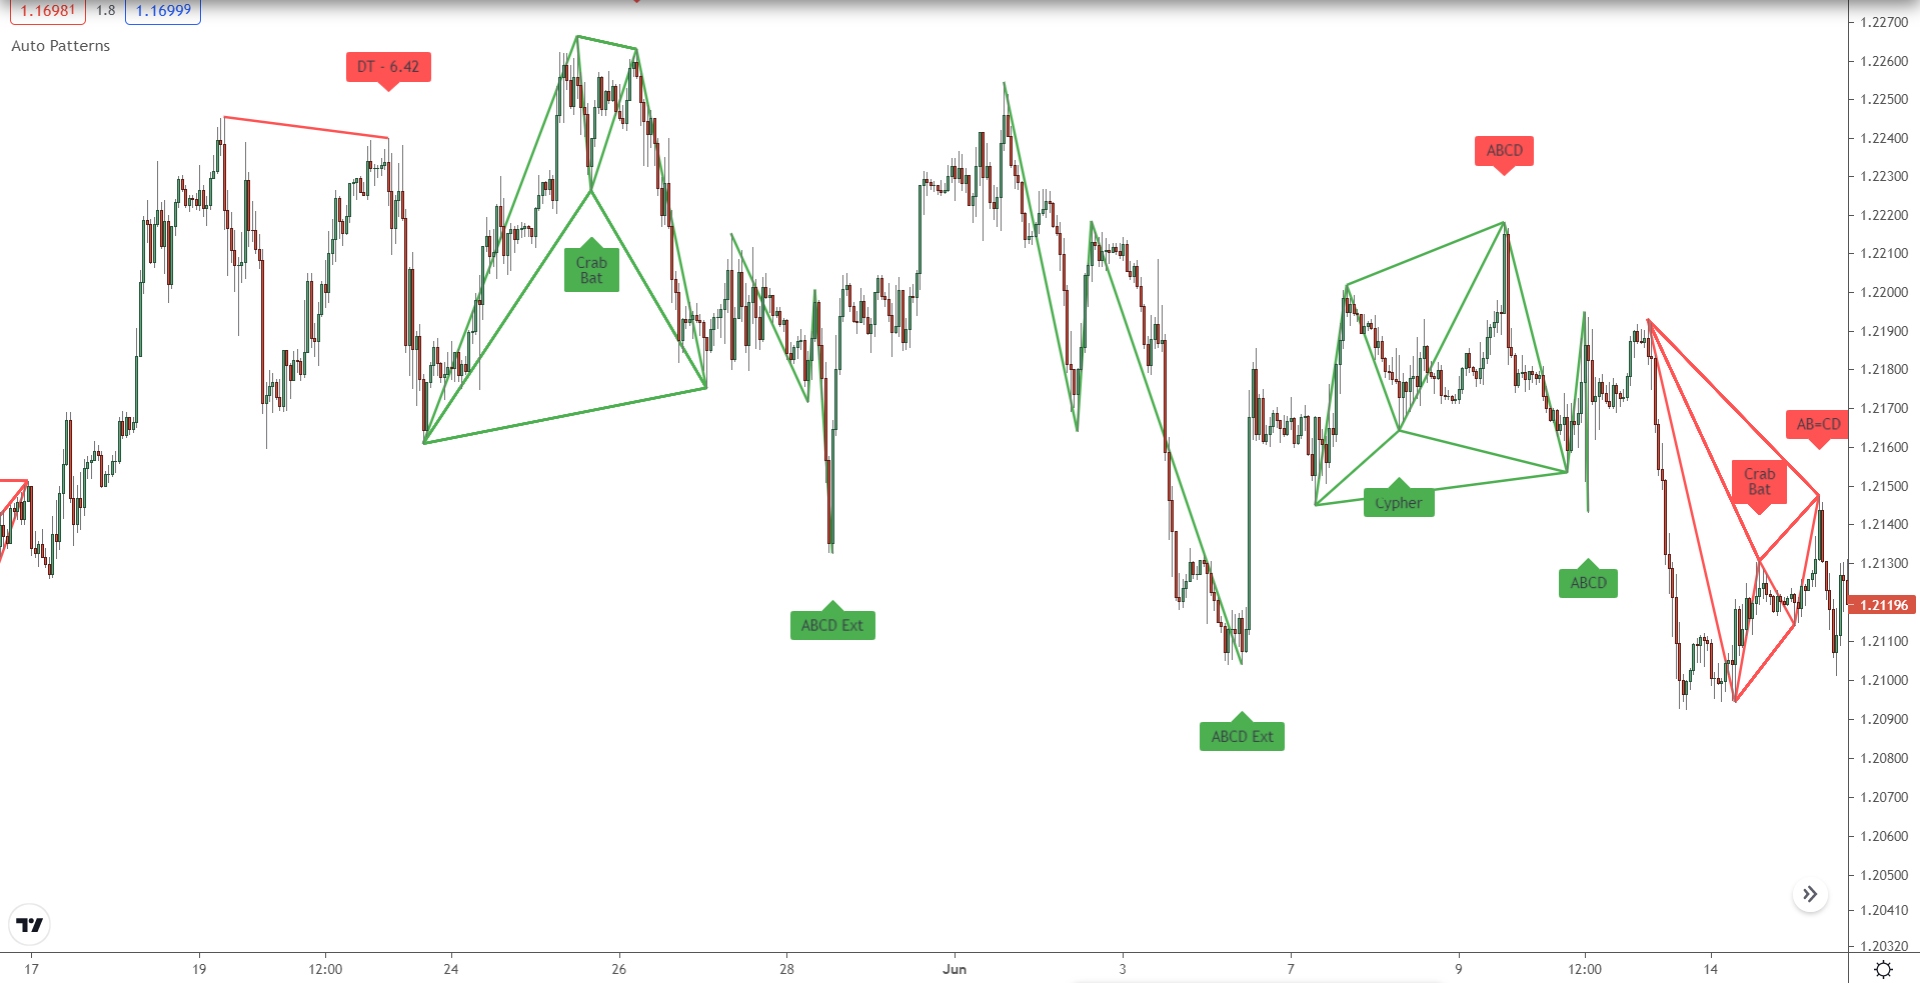
This custom indicator automatically highlights harmonic patterns and their swing structure, making it easy for you to spot the patterns and asses whether their structure meets the right ratios.
Simply enter “Auto Patterns” into the indicator search bar and then click the “Auto Patterns Harmonic” Indicator found near the bottom.
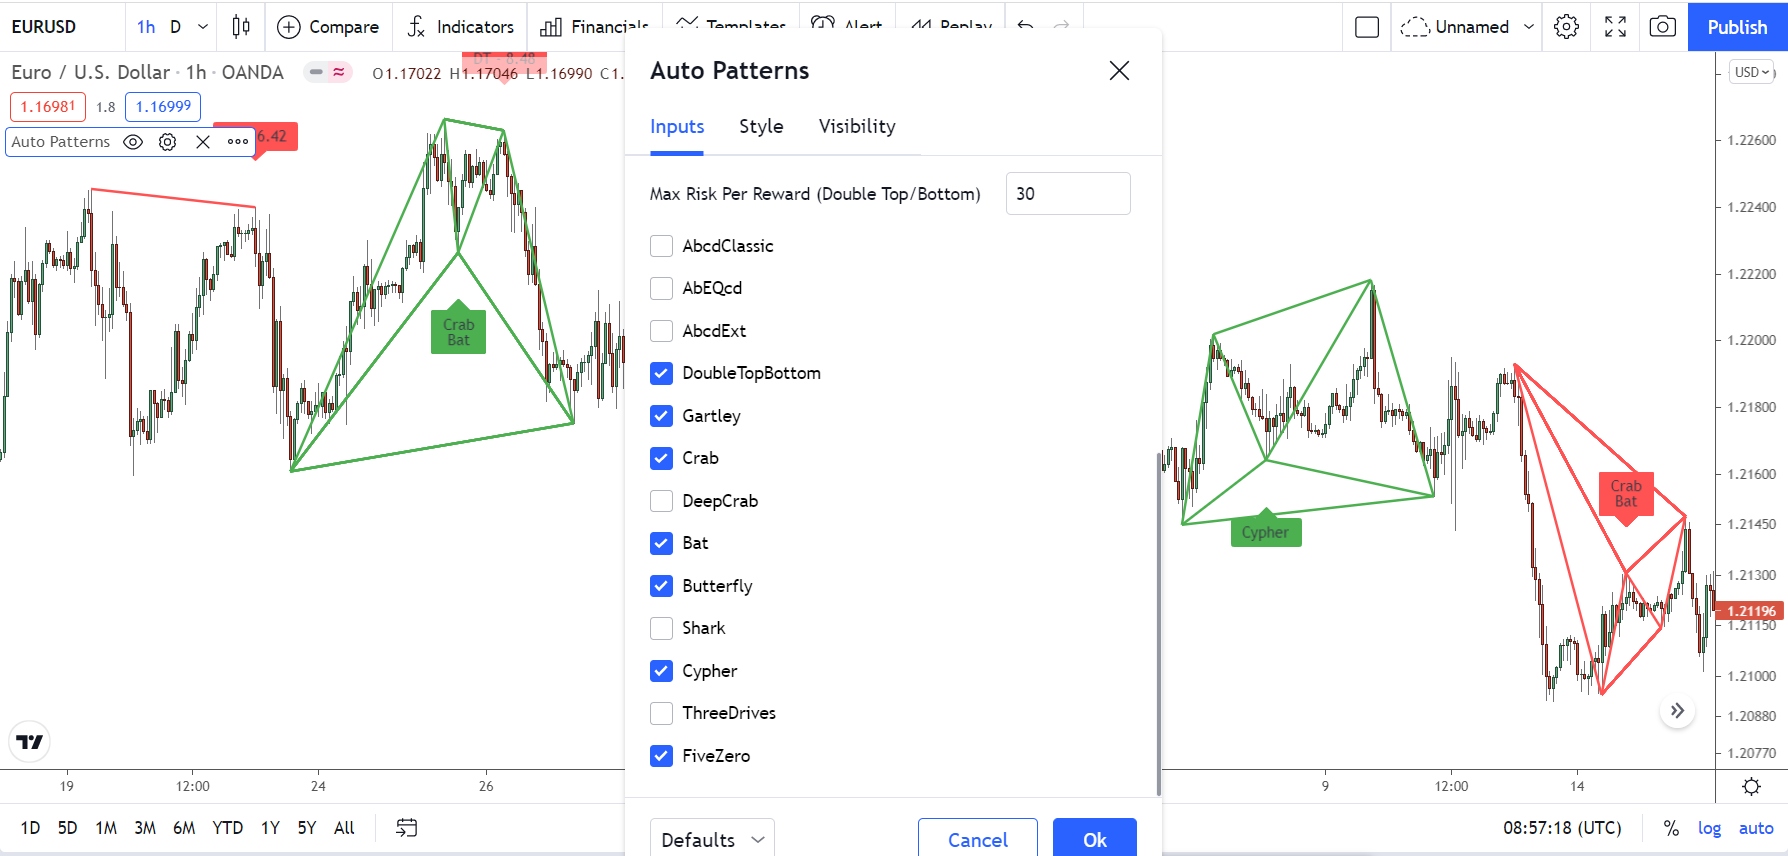
If you open the settings menu, you can also select which patterns you want the indicator to highlight.
Neat, huh?
FIRST:
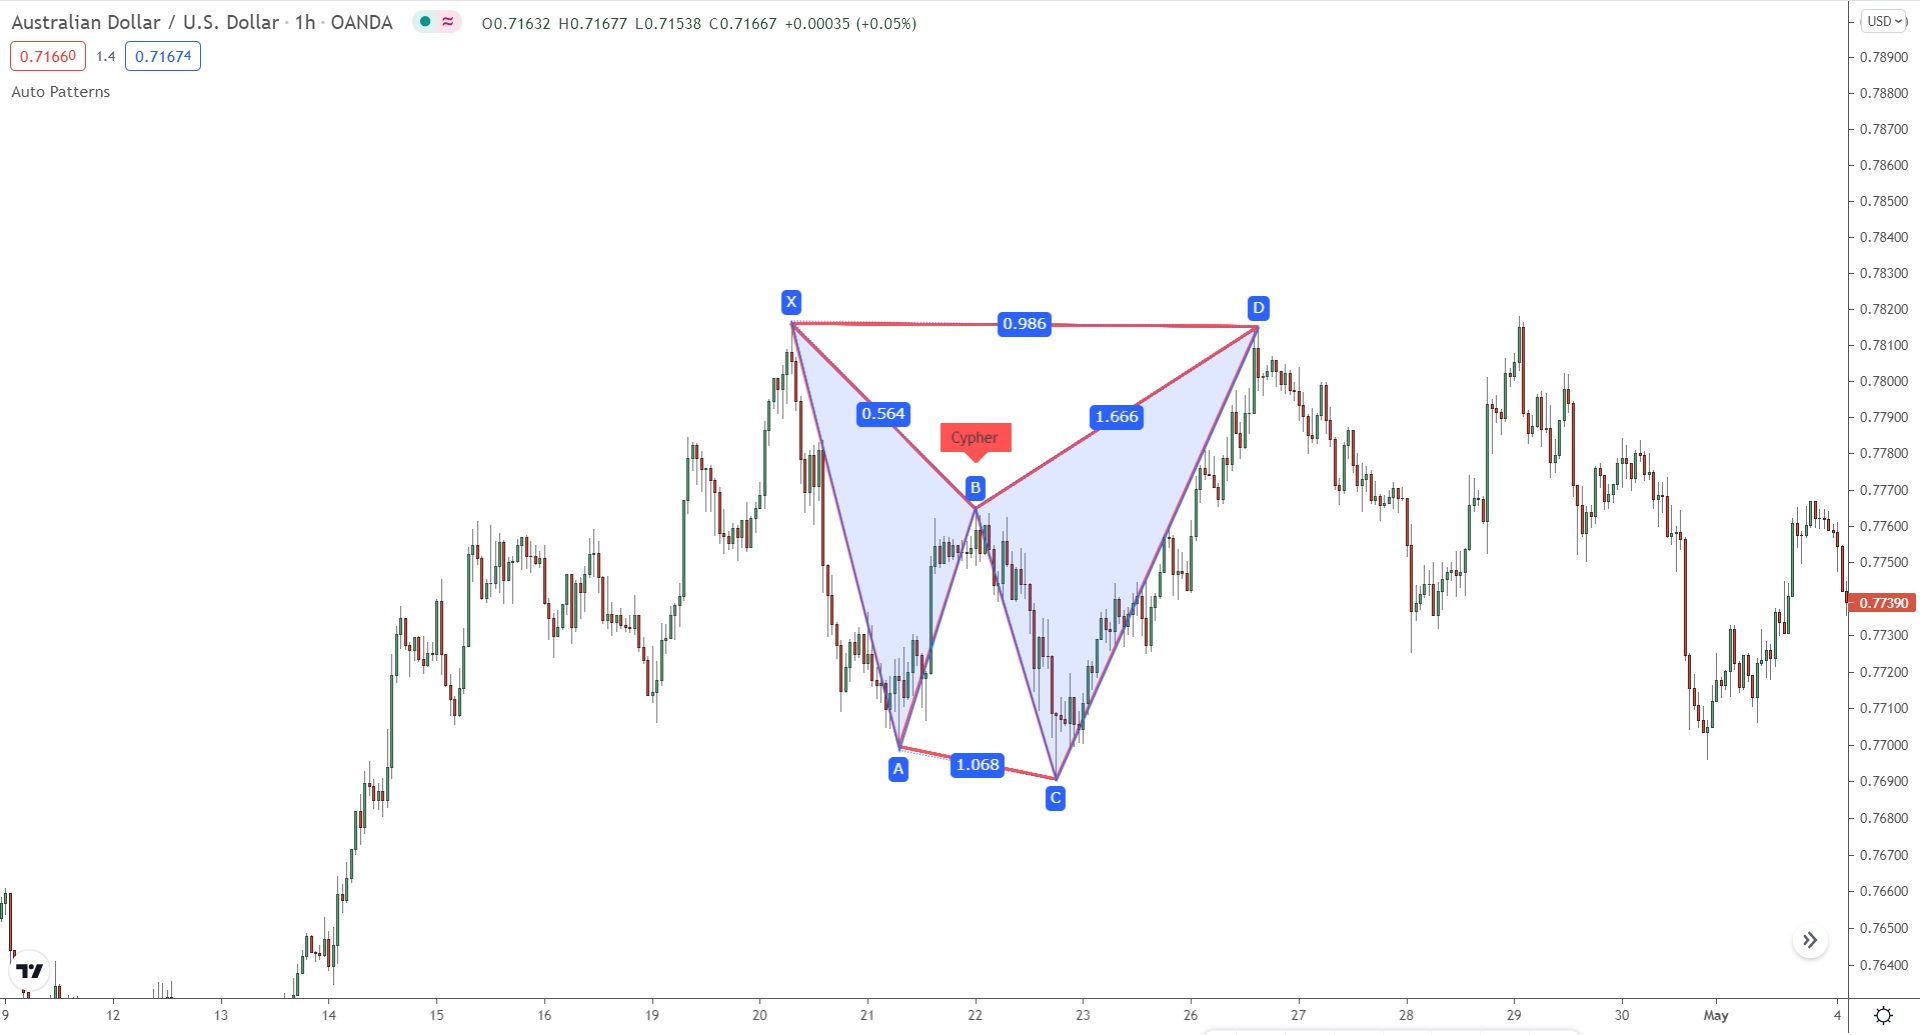
Check if swing 1 – from X – A – is an upswing or downswing.
For bullish Cyphers, swing 1 is always an upswing.
For bearish Cyphers, swing 1 is always a downswing.
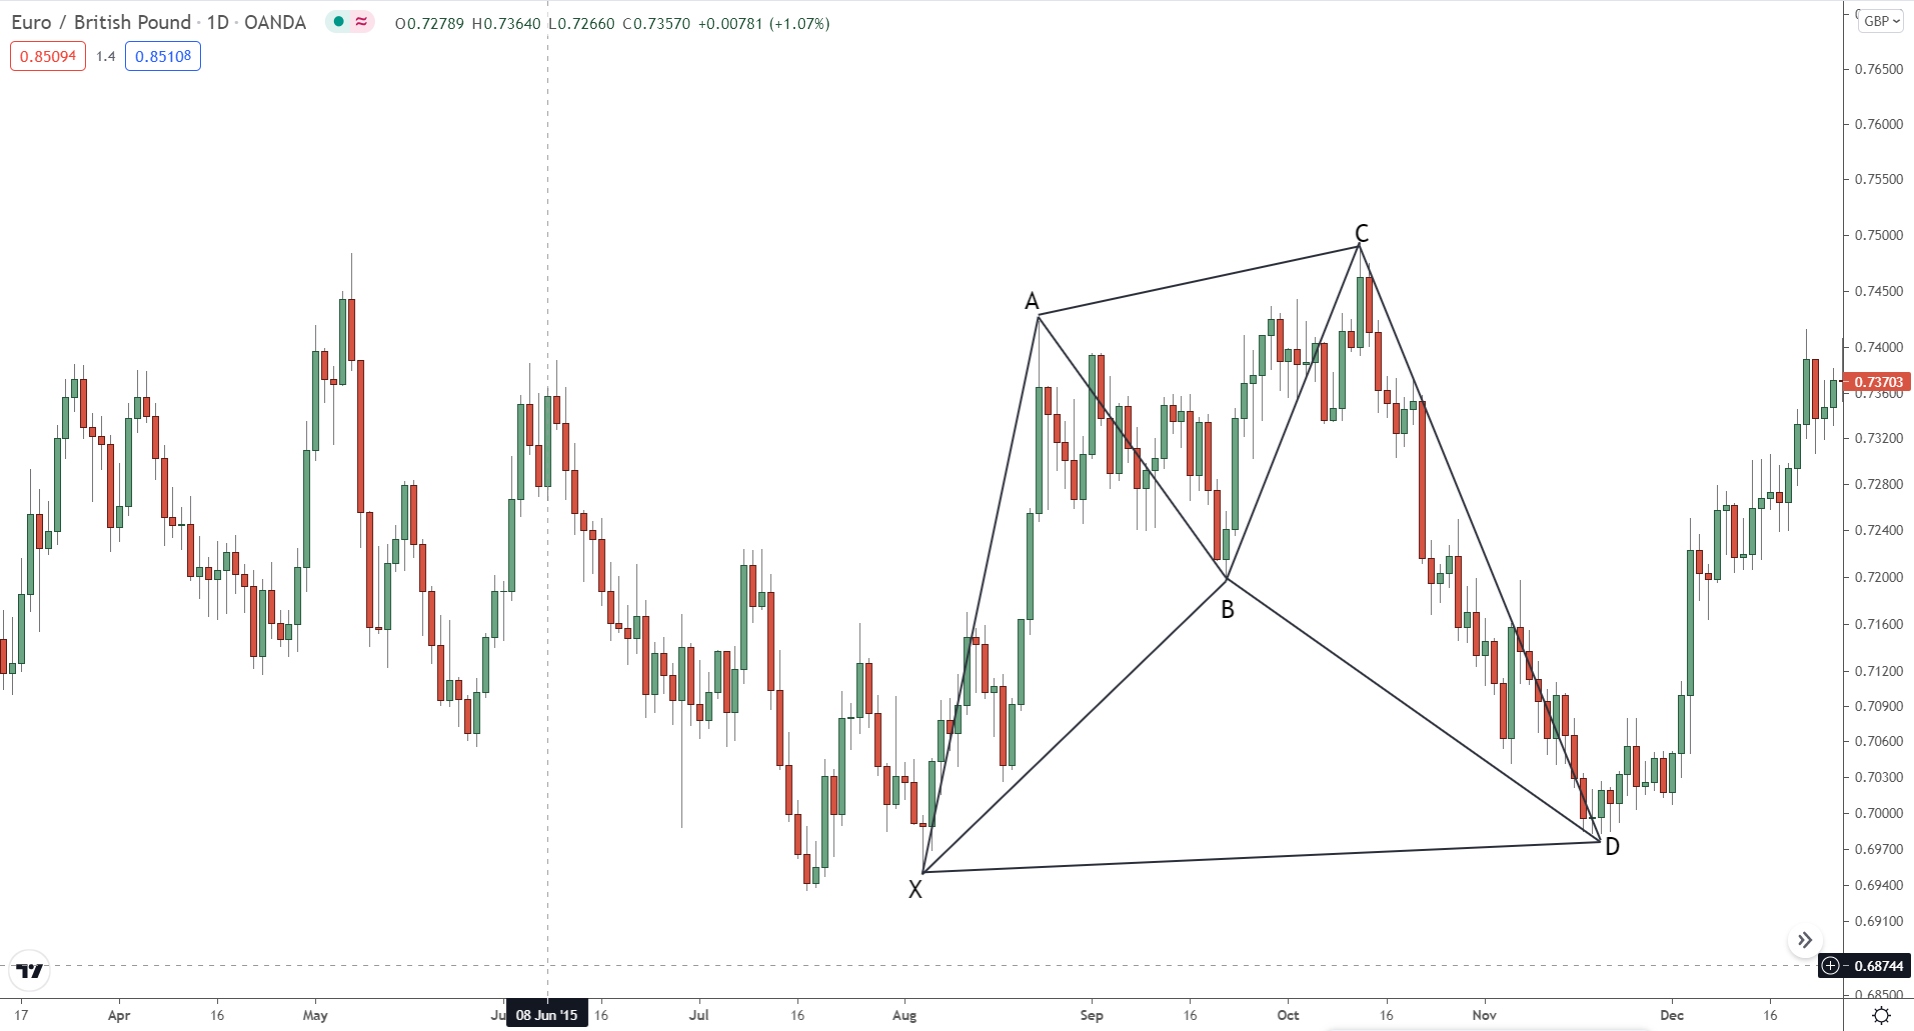
In our example, we see an upswing, which tells us this is a bullish Cypher.
Once the pattern completes, we should see a reversal of this downmove.
NEXT:
Check if swing A – B retraces no less than 38.2% and no more than 61.8% of swing X – D. The retracement must be between these two ratios for the pattern to be valid.
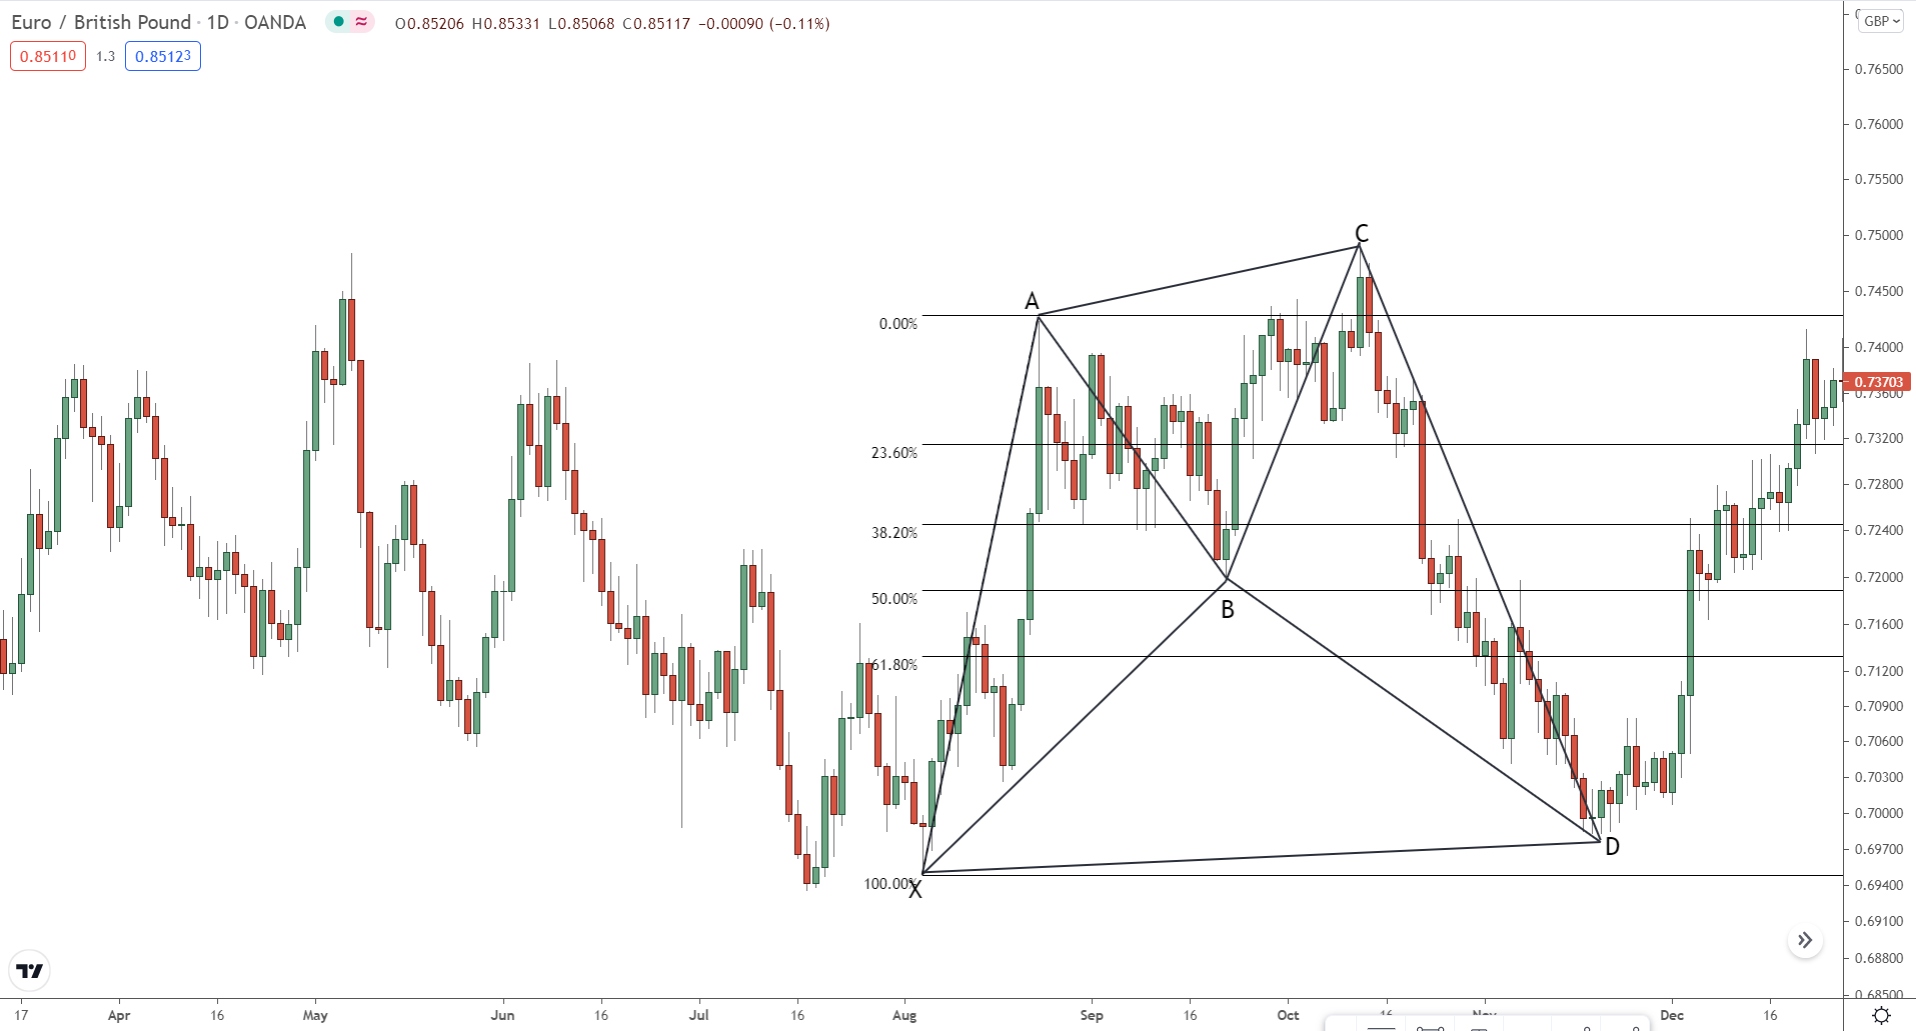
Our Cypher meets these ratios, so as it stands, the pattern is valid.
NOW:
Swing B – C must extend beyond the high created by swing A – B, at least to the 1.27.2% level, but no further than the 1.41.4% level.
Any further invalidates the pattern and suggests a different structure could be forming.
If you want to quickly see how the ratios line up, use the Cypher tool on Tradingview.
Located in the tools tab on the left, the Cypher tool (among other harmonic tools) lets you plot lines on a pattern which reveal the current fib ratios and how they relate to one another. This allows you to see whether the swings line up with the right ratios, and if the pattern is valid for trading or not.
Here’s how it looks in our example…
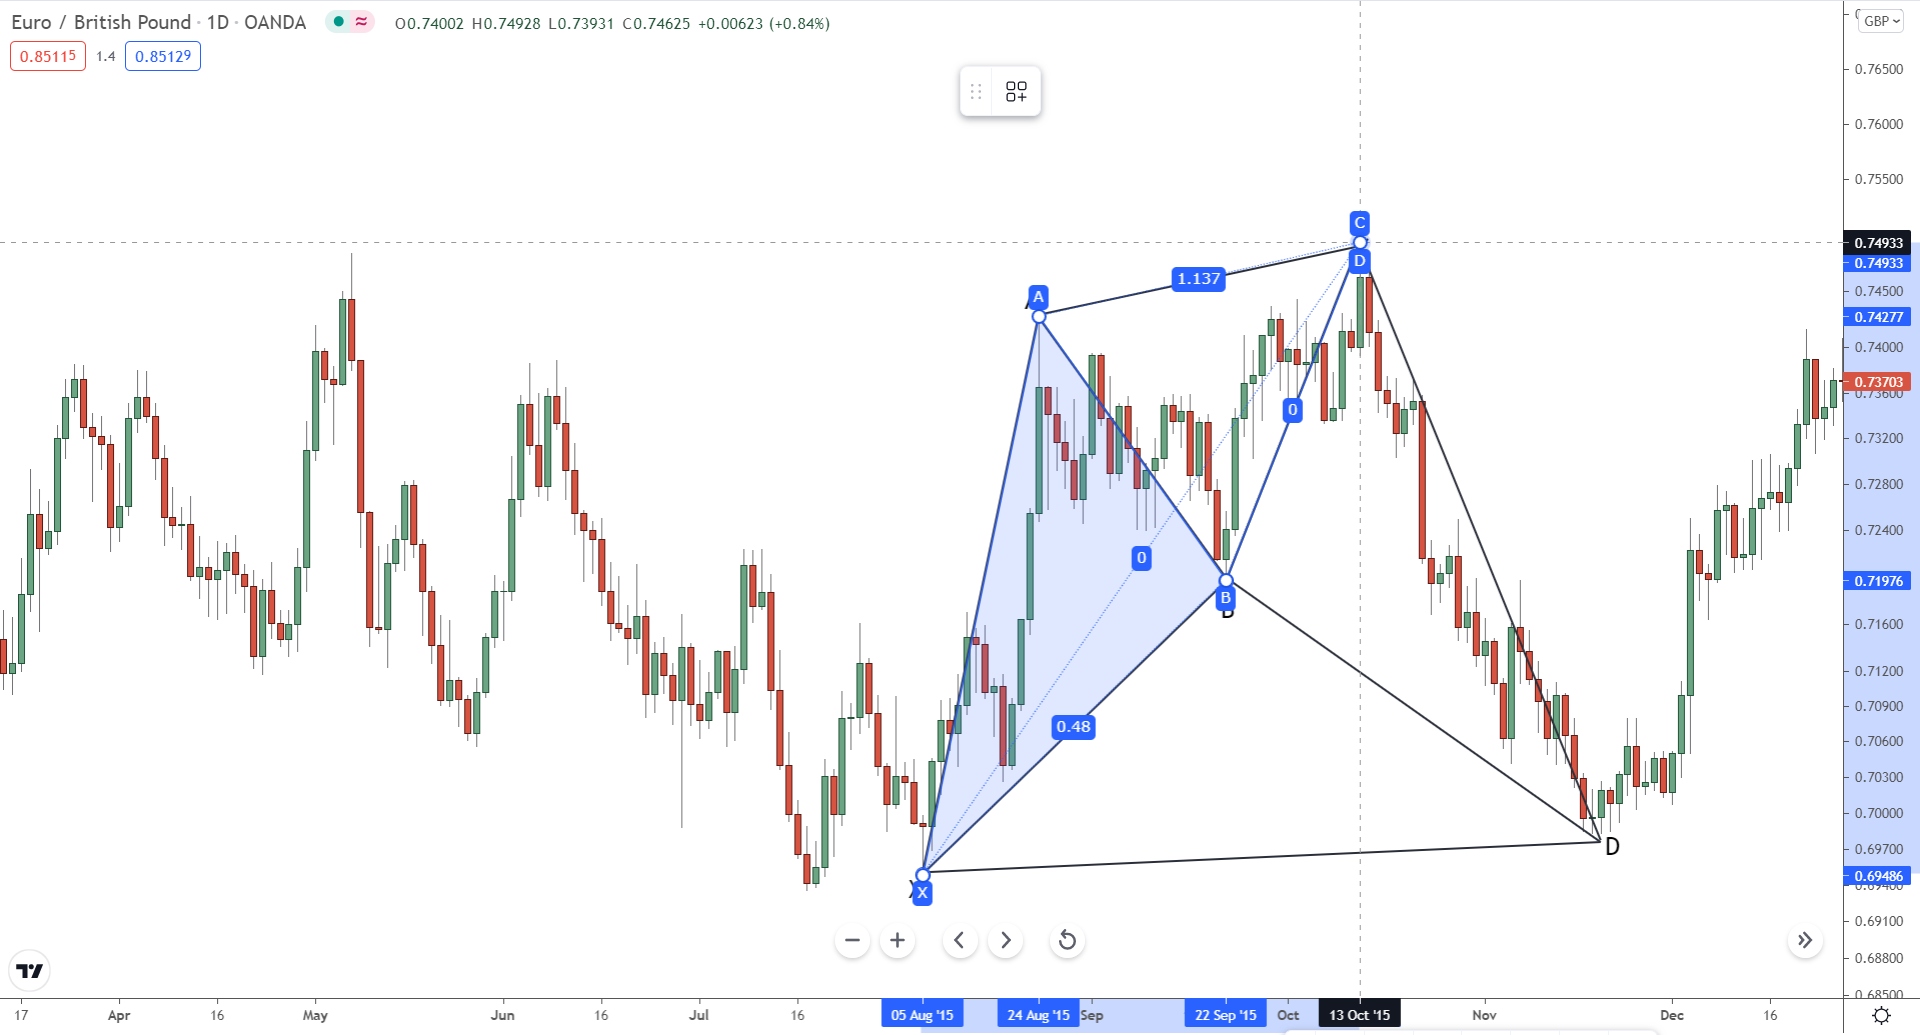
Swing B – C extends 1.137% beyhond the A – B swing, confirming this is a valid pattern.
FINALLY:
Check if the C – D swing reaches at least 78.6% fib level of swing X – C.
This provides the final confirmation a Cypher has formed.
If the ratios line up, enter a long trade once the right bullish price action appears below the 78.6% level but not beyond the 100% level – a breach past here invalidates the pattern.
BEARISH CYPHER PATTERNS:
To identify bearish Cyphers, follow the same steps above, but expect the pattern to form inverted, like below.
The pattern forms upside down, but the ratios and points (XABCD) are the identical.
Just follow the same steps and check the swings meet the ratios as they form.
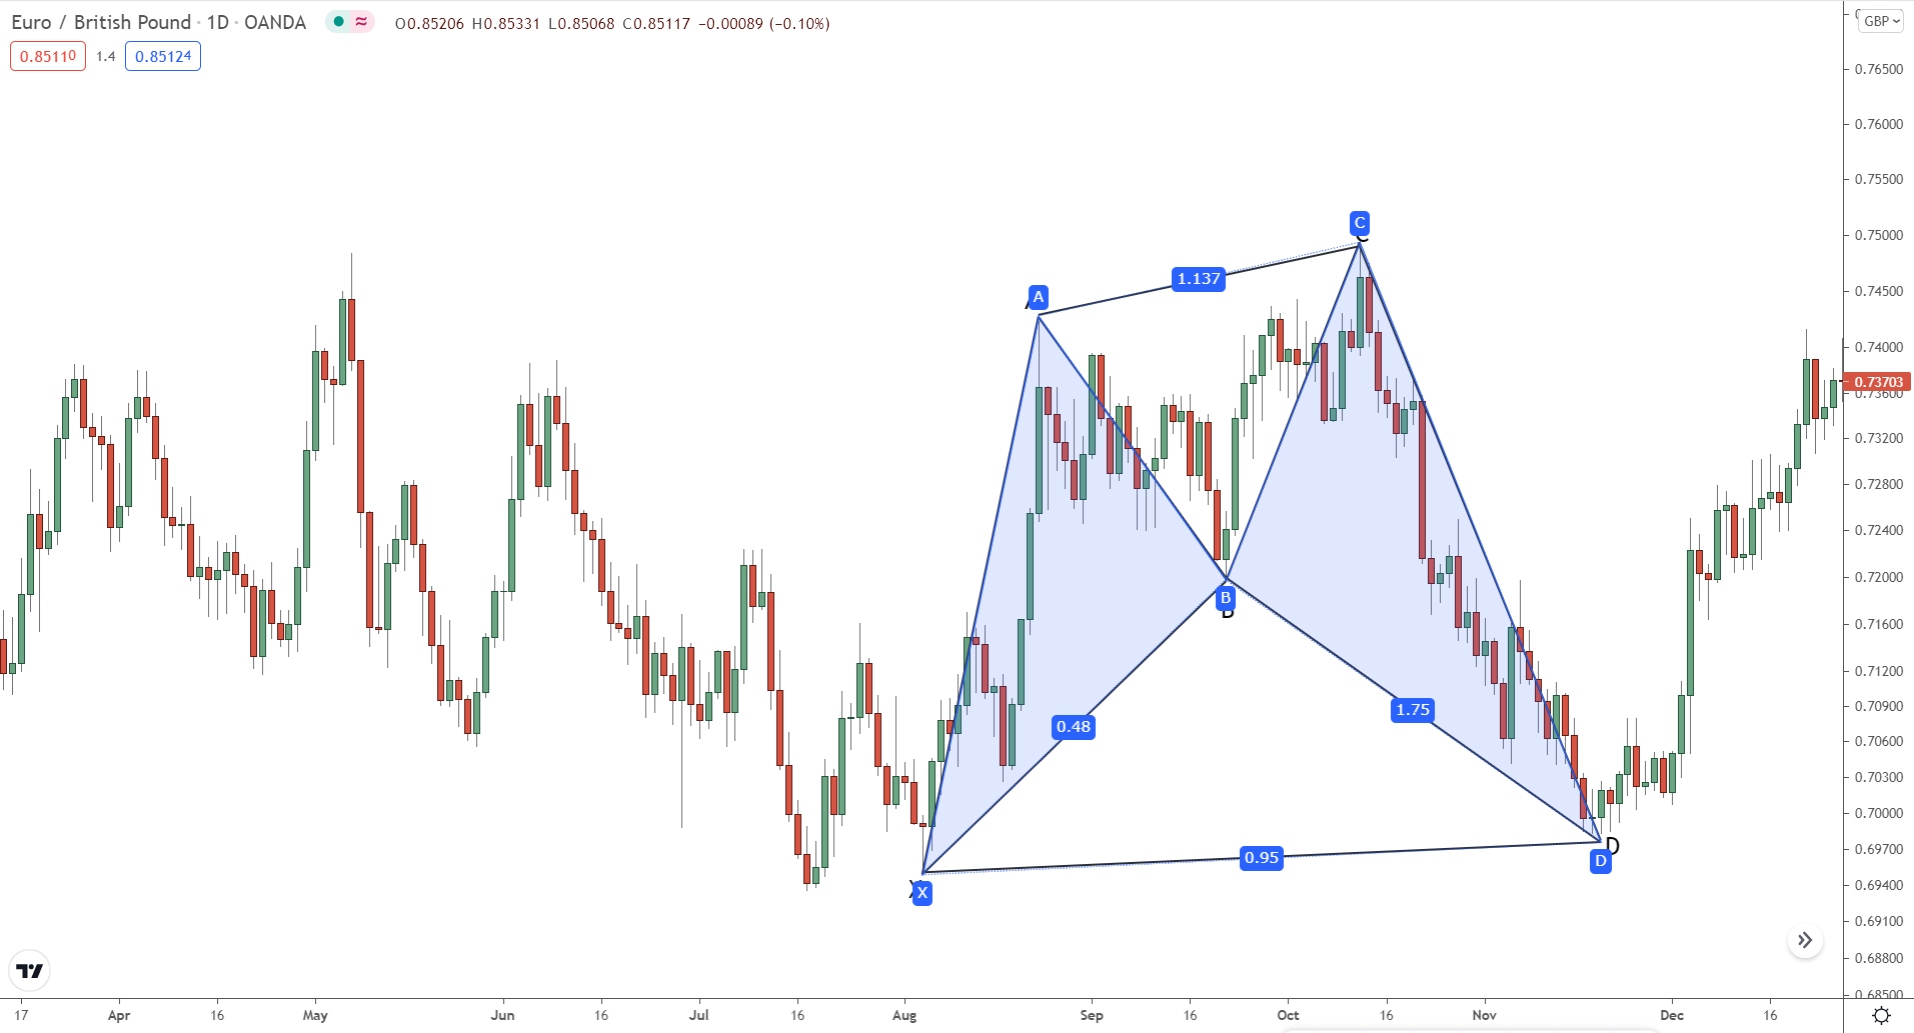
IMPORTANT: Always Follow The “B” Rule.
The steps above will allow you to identify valid Cypher patterns.
However, one last step you should always take for maximum confirmation is checking is the “B” rule.
The “B” rule states that point B CANNOT breach the 78.6% retracement of move X – C. And that includes candlestick wicks. If price breaches this ratio the pattern becomes invalid and suggests a different structure is forming.
Usually, this won’t happen… point B rarely reaches the 78.6% ratio. You’ll most likely see it when a deep retracement and extension takes place on the XA leg.
In any case, always check to be on the safe side.
Trading The Cypher: The Best Method
Normally, trading the Cypher is a case of waiting for swing C – D to reach the 78.6% level and then seeing if the right price action forms – pin bars, engulfing candles, etc.
For the most part, this is a great method!
The entry is usually clean, and the stop loss is relatively tight.
But there is a better way to trade the Cypher…
I talked about this in my ‘Gartely pattern’ post.
Supply and demand zones indicate where the big players are most likely going to buy or sell to cause a reversal. By using them to trade the Cypher, we can accurualty predict where price will reverse once it breaches the 78.6% level.
Rather than guess and take the wrong signals, we can instead wait for price to enter the zone and provide a signal.
You can see this below…
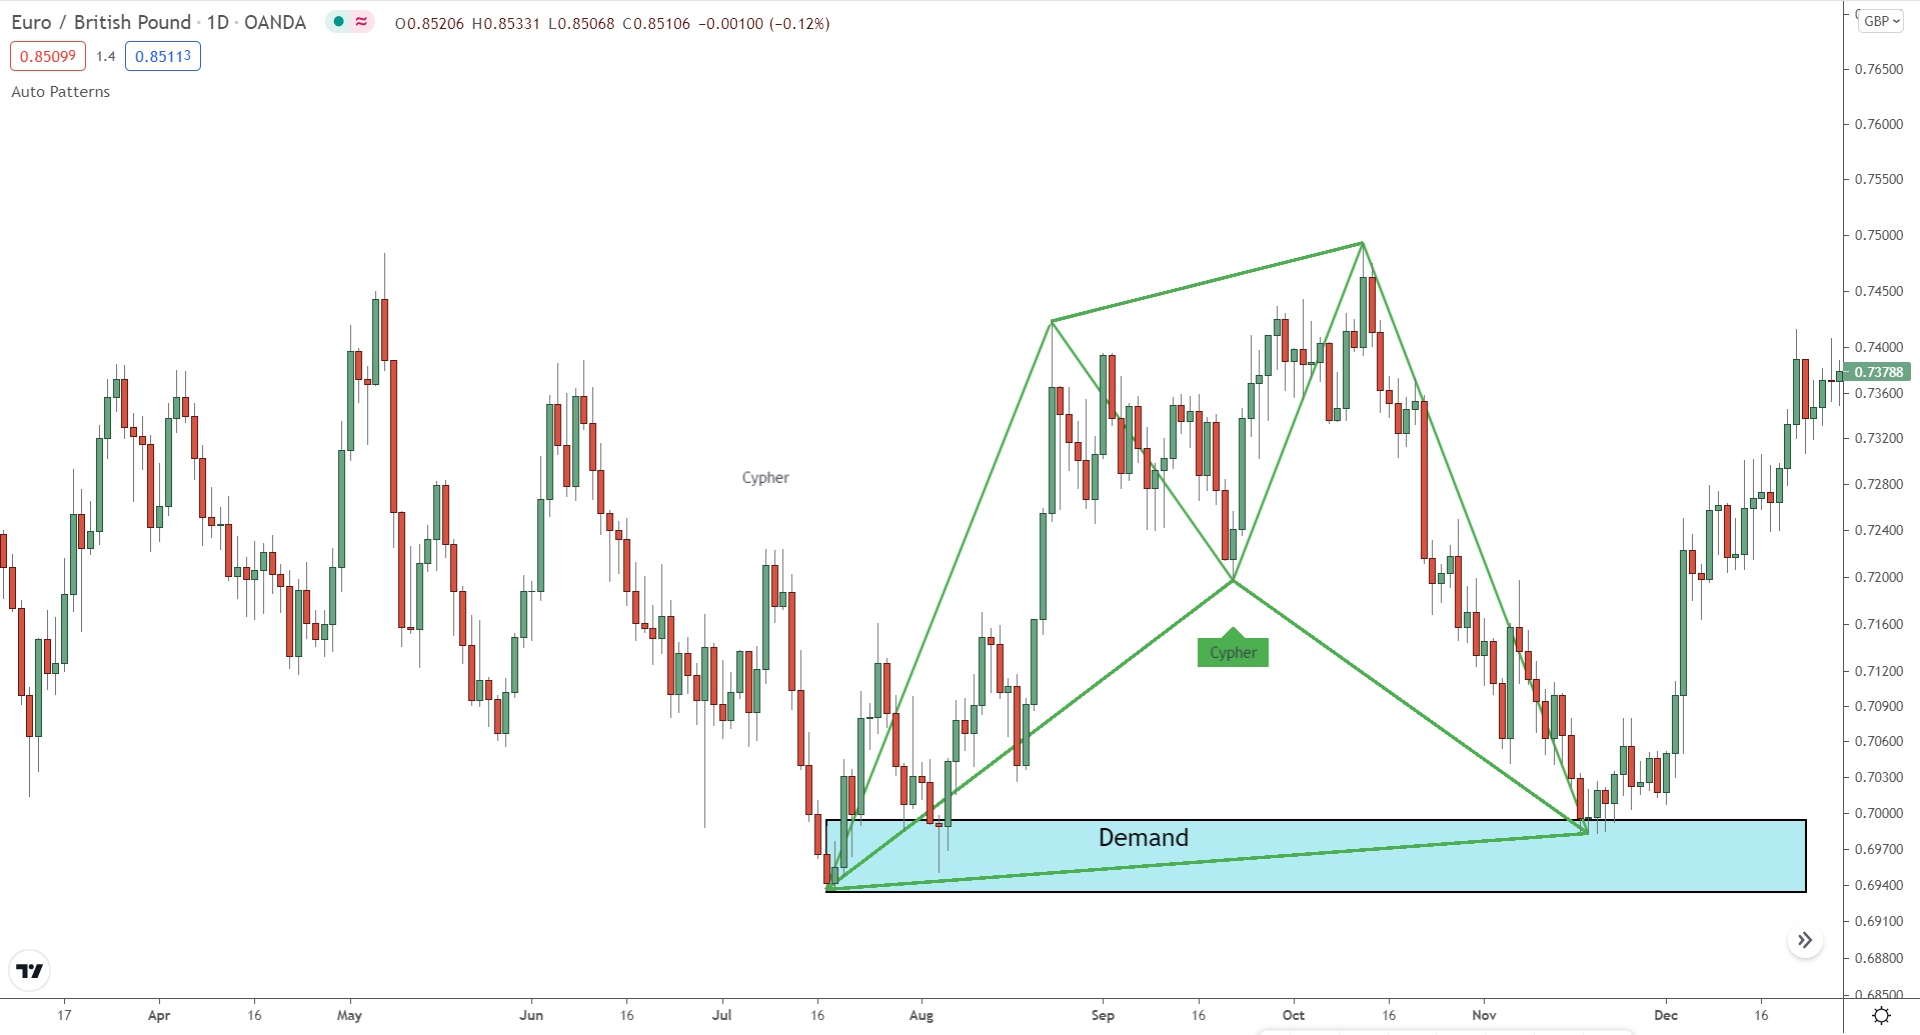
C – D breaches 78.5% level, so we know a reversal could be nigh.
Normally, we would wait for a signal anywhere between 78.6% & 100%.
But with the zone, we now know to watch for inside the zone.
In our case, we see a few PA signals.
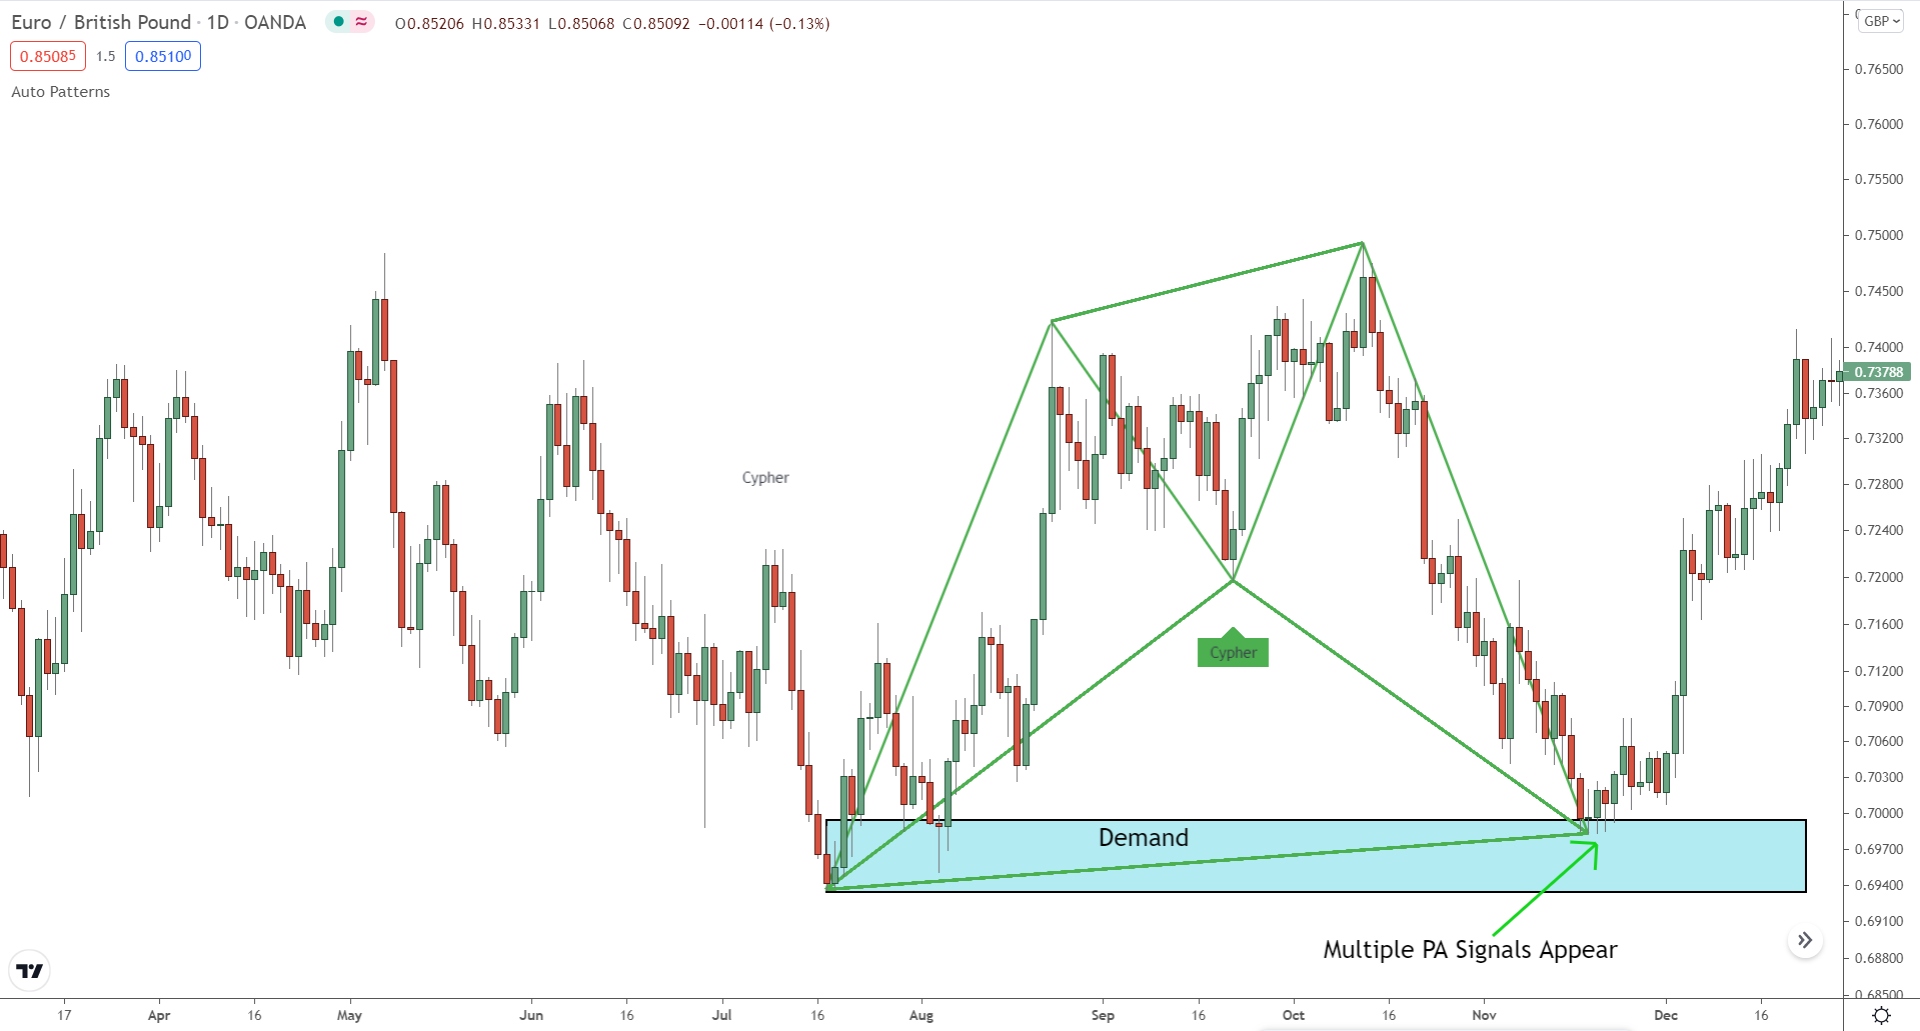
First, a bearish Pin Bar forms first – not the best signal, but still valid.
Then a large bullish Engulfing Pattern appears.
Being much bigger makes this a stronger signal, and low and behold, price reverses soon after it forms.
See what I mean now, how the zone improves the entry?
Using the demand zone allowed us to pinpoint where price would most likely reverse, reducing our risk massively and helping us determine which signals will probably initiate the reversal. We reduced risk whilst simultaneously increased our chance of getting into the reversal at the right time.
The Bottom Line
Harmonic patterns come in many types, but the Cypher stands tall as one of the best.
Though they may be rare, their high strike rate and low entry risk make them a very profitable pattern to both use and trade. If you want a high win rate pattern that can get you into some massive winners, look no further than the Cypher.