
Spotting divergence can feel like searching for a needle in a haystack, can’t it?
But hold up – I’ve got your back!
Say hello to your ultimate divergence lifesaver – the cheat sheet to end all cheat sheets!
I’ve whipped up a simple, step-by-step guide that details the 4 main types of divergence. Through these examples, you’ll learn the highs and lows of each type, plus get the lowdown on the market psychology that brings them into play.
Pretty slick, right?
Now, let’s quit the chitchat and jump right in…
Overview: What Is Divergence?
Before I dive into the examples, let’s do a quick rundown on divergence and its significance in the market.
Divergence sure has a quirky name, but what’s the meaning behind it?
Here’s the scoop:
In technical analysis, divergence refers to the phenomenon when the price and a technical indicator (like the RSI) display conflicting signals. For instance, if price forms a higher high while the RSI forms a lower high, it indicates bearish divergence.
Price and the RSI, which should typically move in tandem, end up showing contradictory signals.
Simple enough, right?
But hold on, what’s the actual implication of divergence?
Divergence suggests that contrary momentum is secretly building up. As price reaches new heights, a divergence indicator exposes the mounting sell-side pressure lurking beneath – a strong hint price might soon reverse.
So, how do we spot divergence?
By utilizing Oscillator indicators – ring a bell?
Oscillators, such as the RSI and MACD, oscillate between two values – typically ranging from 0 to 100. These indicators offer insights into the strength, direction, and momentum of a trend. As the indicators fluctuate, they form highs and lows.
But here’s the catch: The highs/lows don’t mirror price…
Instead, they represent the current market momentum.
Oscillators employ a mathematical formula to analyze market momentum. The formula translates data points into lines or bars, which are then displayed as a compact chart.
This enables us to identify divergence.
Each oscillator has its own distinct formula, causing divergence to emerge at different moments.
Take these examples:
- The MACD assesses momentum by comparing prices over time.
- The RSI calculates momentum by measuring the difference between two moving averages.
Got it?
Now, here are the 5 most popular divergence indicators…
- Relative Strength Index (RSI)
- Moving Average Convergence Divergence (MACD)
- Awesome Oscillator
- Momentum Indicator.
The Top 4 Types of Divergence Explained
Many technical indicators can help us spot divergence, but divergence itself comes in a few different forms depending on the market conditions.
Let’s check these out now…
Regular Divergence
Call it “classical divergence” if you want, regular divergence shows up when price and an oscillator form opposing highs and lows.
Here’s an example…
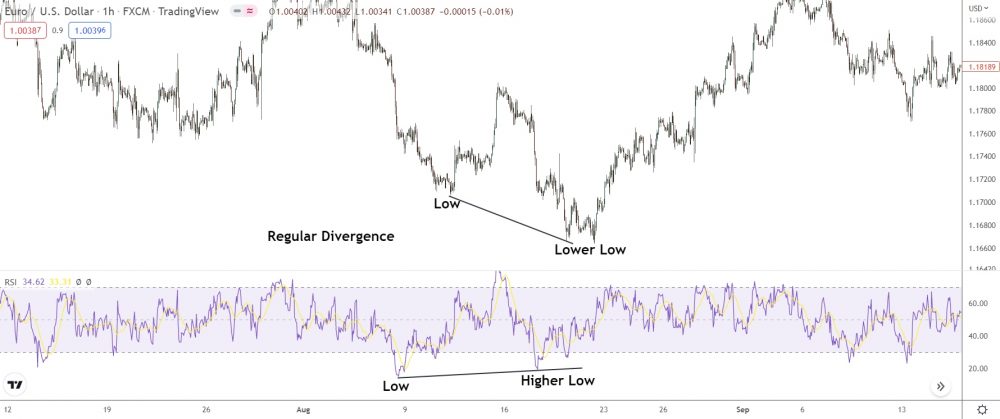
See how the price’s made two lower lows while the RSI’s made two higher lows?
That’s regular divergence: Price & the RSI show opposites.
Price making new lower lows indicates the trend’s still bearish. But the RSI with its higher lows show bullish momentum building behind the scenes. The bulls are getting ready to battle the bears and take the price higher.
Regular divergence has two types…
Bullish Divergence
Regular bullish divergence appears when price forms lower lows and an oscillator’s shows higher lows – a signal bullish momentum is building.
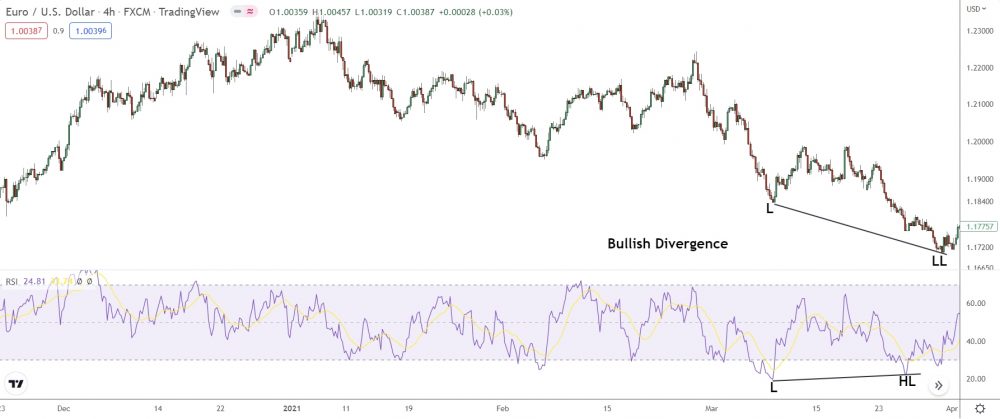
Check it out: Price makes multiple lower lows.
At the same time, the RSI’s forms two higher lows.
Aha! We’ve got regular bullish divergence! While price keeps falling to new lows, the RSI’s has formed a new higher low, showing that buy-side momentum’s increasing.
Let’s see if price reverses and the bullish momentum takes over.
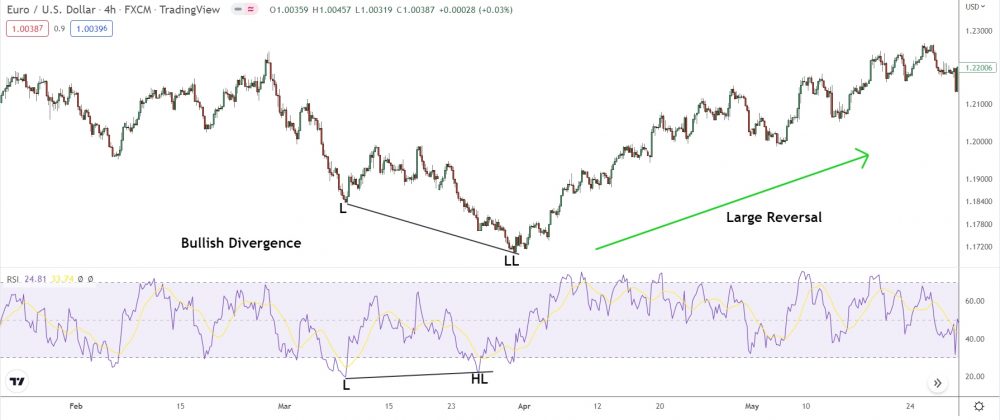
Bingo!
The signal was right on the money – bullish divergence led to a reversal!
Pretty cool, huh?
Key Considerations:
- Price Behavior: In a regular bullish divergence, the price of the asset is decreasing and forming lower lows. This indicates a prevailing bearish trend.
- Indicator Behavior: While the price is forming lower lows, the technical indicator (such as the Relative Strength Index, Moving Average Convergence Divergence, or Stochastic Oscillator) is forming higher lows. The indicator is diverging from the price, hence the term “divergence.”
- Loss of Downward Momentum: The divergence between the price and the indicator suggests that the bearish momentum is waning. Even though the price is still going down, the indicator suggests that the selling pressure might be decreasing.
- Potential Reversal Signal: A regular bullish divergence is often seen as a potential signal of a price trend reversal. If the divergence is confirmed, for example by a bullish candlestick pattern or a break above a trendline, traders might consider it a signal to buy or to close short positions.
- Risk Management: Like all trading signals, regular bullish divergences should be used in conjunction with other forms of technical analysis and sound risk management. No signal is infallible, and traders should be prepared for situations where the price continues to fall despite the divergence.
Now let’s talk bearish divergence…
Bearish Divergence
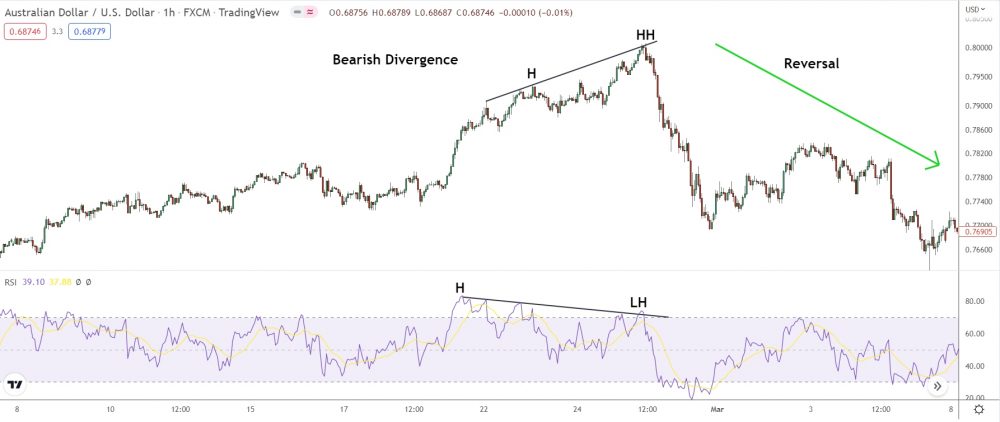
Regular bearish divergence is when price forms a new higher high while an oscillator shows a new lower high – suggesting bearish momentum building.
Here’s an example…
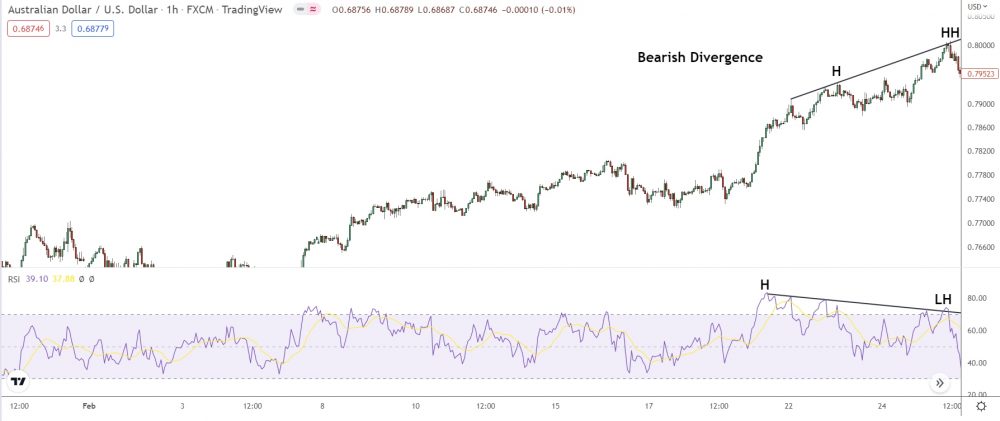
Spot the divergence pattern?
When price makes a new higher high, the RSI’s shows a new lower high – a sure sign bearish momentum has building behind the scenes.
The bulls are starting to lose their grip, and the bears could take price lower soon.
And that’s exactly what we see…
Simple, right?
Key Considerations:
- Price Behavior: In a regular bearish divergence, the price of the asset is increasing and forming higher highs. This indicates a prevailing bullish trend.
- Indicator Behavior: While the price is forming higher highs, the technical indicator (such as the Relative Strength Index, Moving Average Convergence Divergence, or Stochastic Oscillator) is forming lower highs. The indicator is diverging from the price, hence the term “divergence.”
- Loss of Upward Momentum: The divergence between the price and the indicator suggests that the bullish momentum is waning. Even though the price is still going up, the indicator suggests that the buying pressure might be decreasing.
- Potential Reversal Signal: A regular bearish divergence is often seen as a potential signal of a price trend reversal. If the divergence is confirmed, for example by a bearish candlestick pattern or a break below a trendline, traders might consider it a signal to sell or to close long positions.
- Risk Management: Like all trading signals, regular bearish divergences should be used in conjunction with other forms of technical analysis and sound risk management. No signal is infallible, and traders should be prepared for situations where the price continues to rise despite the divergence.
Hidden Divergence
Now let’s get into hidden divergence.
Technically speaking, hidden divergence looks a lot like regular divergence. But there are two key differences in how the divergence forms and what it signals.
✅ Hidden divergence usually shows up mid-trend.
Unlike regular divergence, which only appears near the end of trends, hidden divergence pops up right in the middle of a trend or movement. Why? It’s all about what the divergence signals, which brings me to the second difference…
✅ Hidden divergence signals a continuation, NOT a reversal.
Hidden divergence always results in a continuation of a trend or movement rather than a reversal, like we see with regular divergence. The bulls or bears take a step back, let the other side take the wheel for a bit, before jumping back in to continue the trend.
Hidden divergence comes in both bullish and bearish forms.
Let’s have a quick look-see…
Bullish Hidden Divergence
Bullish hidden divergence shows up when price prints a higher high, but an oscillator forms a lower low. The divergence will usually appear mid-trend, often during a pullback. The divergence reveals the bulls have taken control again, resulting in a bullish continuation.
Here’s what it looks like…
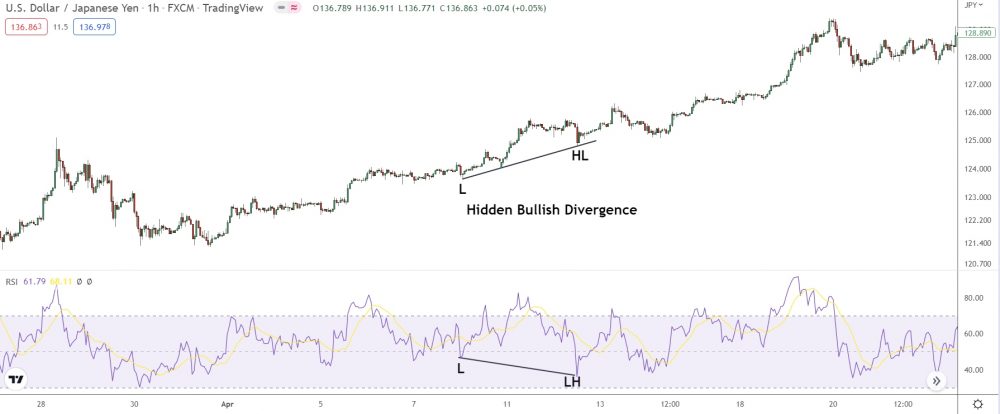
See how the RSI makes a lower high, but price shows a higher low?
That’s hidden bearish divergence: The bulls are taking a quick break from the rise, causing a pullback, but then they jump back in with new positions.
And so the uptrend continues.
Key Considerations:
- Price Behavior: In a hidden bullish divergence, the price of the asset is increasing and forming higher lows, indicating a prevailing uptrend or bullish trend.
- Indicator Behavior: While the price is forming higher lows, the technical indicator is forming lower lows. The indicator is diverging from the price, hence the term “divergence.”
- Continuation Signal: Unlike regular divergences which signal potential trend reversals, hidden divergences signal potential trend continuation. In this case, the hidden bullish divergence suggests the uptrend may continue.
- Buying Opportunity: When a hidden bullish divergence is identified, it could be seen as an opportunity to enter a long position or add to an existing long position.
- Risk Management: As with all trading strategies, hidden bullish divergences are not foolproof and should be used in conjunction with other forms of technical analysis and a solid risk management strategy.
- Confirmation: Traders often wait for additional confirmation before acting on divergence signals. This might come from price action (like a bullish candlestick pattern), a break of resistance, or confirmation from other technical indicators.
Bearish Hidden Divergence
Now, let’s talk about bearish hidden divergence.
When price makes a lower low, but an oscillator’s prints a higher high, that’s when you’ve got bearish hidden divergence. The bears decide to take profits, causing a small pullback, and then the bulls take control for a short time.
But, surprise!
The bears come back to keep the downtrend going.
A quick example…
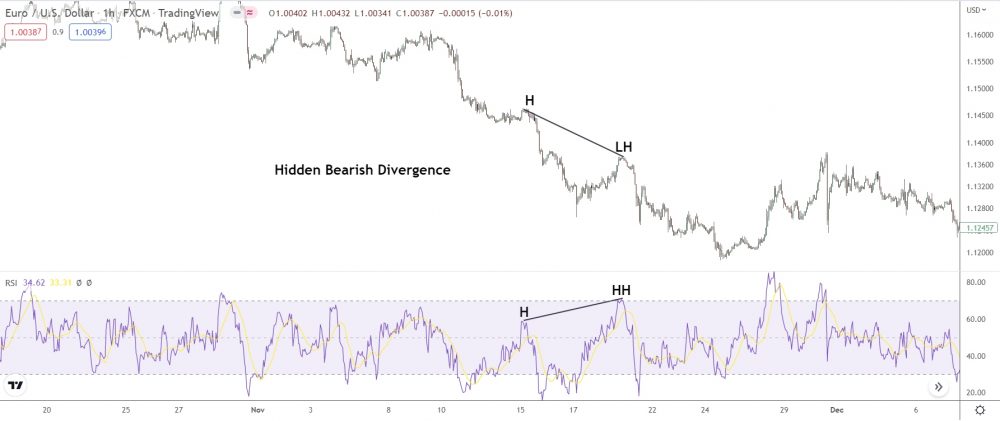
In the image above, during a downtrend, price makes a new lower high, while the RSI shows a new higher high. That indicates bearish hidden divergence.
So, what’s the hidden divergence all about?
It’s the bears making a comeback after a pullback!
1️⃣ First: The bears grab some profits, kicking off the pullback.
2️⃣ Then: The bulls get all excited, thinking price has turned around.
3️⃣ Now: The bears come back to keep the downtrend going!
Get it?
Key Considerations:
- Price Behavior: In a hidden bearish divergence, the price of the asset is decreasing and forming lower highs, indicating a prevailing downtrend or bearish trend.
- Indicator Behavior: While the price is forming lower highs, the technical indicator is forming higher highs. The indicator is diverging from the price, hence the term “divergence.”
- Continuation Signal: Unlike regular divergences which signal potential trend reversals, hidden divergences signal potential trend continuation. In this case, the hidden bearish divergence suggests the downtrend may continue.
- Selling Opportunity: When a hidden bearish divergence is identified, it could be seen as an opportunity to enter a short position or add to an existing short position.
- Risk Management: As with all trading strategies, hidden bearish divergences are not foolproof and should be used in conjunction with other forms of technical analysis and a solid risk management strategy.
- Confirmation: Traders often wait for additional confirmation before acting on divergence signals. This might come from price action (like a bearish candlestick pattern), a break of support, or confirmation from other technical indicators.
4 Common Examples Of Divergence
Before we wrap this up, let’s check out a few common examples of divergence spotted by popular oscillator indicators.
RSI Divergence
RSI is one of the most famous divergence indicators out there, and it can reveal super accurate divergence signals on any timeframe or pair.
Like, for instance:
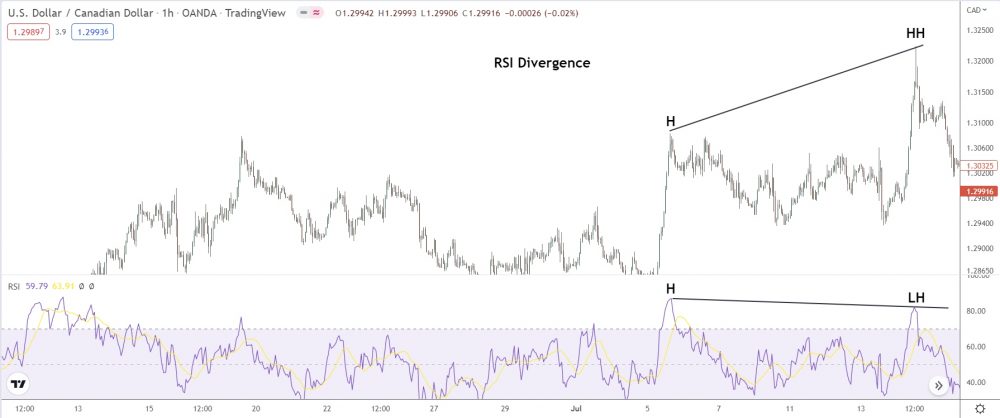
The RSI above shows regular bearish divergence during a significant uptrend on EUR/USD.
Price hits a new higher high, but RSI prints a lower high – signaling bears are entering the market and overwheming the bulls.
And what happens later…
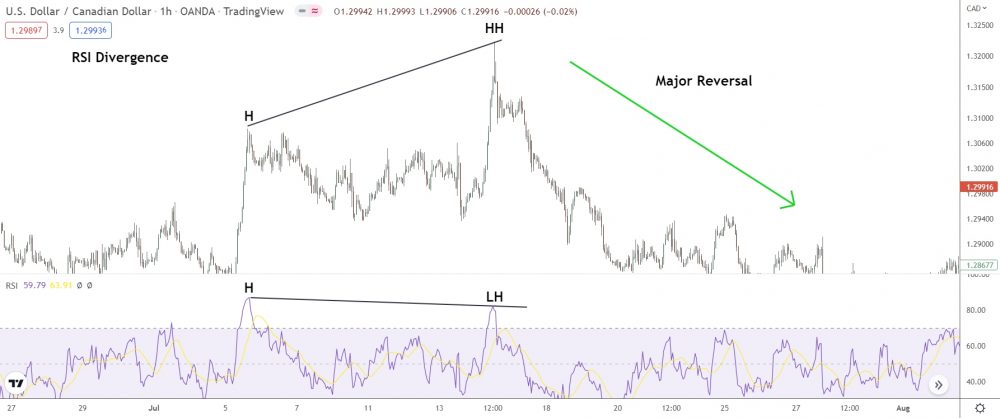
After another lower low and higher low print, price reverses to the downside.
Piece of cake!
Key Point: Divergence can be a mighty reversal signal, but it ain’t foolproof.
Sometimes, price doesn’t reverse after divergence shows up, giving a false reversal signal. To up the accuracy it’s best to combine divergence with other technical tools and techniques for extra confirmation a reversal might be on the horizon.
In my case, I pair divergence with supply and demand zones.
The zones clue me in on WHERE price might reverse.
Divergence indicates WHEN that reversal may take place.
Together, I’ve got a way better shot at predicting a reversal.
Key Considerations:
- Bullish Divergence: Bullish divergence occurs when the price is making lower lows, but the RSI is making higher lows. This suggests that the bearish momentum is weakening and a reversal to an uptrend might be coming.
- Bearish Divergence: Bearish divergence occurs when the price is making higher highs, but the RSI is making lower highs. This suggests that the bullish momentum is weakening and a reversal to a downtrend might be coming.
- Trend Reversal Signal: Divergences between the RSI and price action can potentially indicate a reversal in the current trend.
- Confirmation: Traders often seek confirmation of the divergence through other indicators or chart patterns before taking a position.
- False Signals: Divergences can sometimes give false signals, suggesting a trend reversal when the original trend continues. Therefore, it’s important to use them in combination with other aspects of technical analysis.
- Timing: While divergences may indicate a potential trend reversal, they do not provide a clear timing signal. The actual reversal may not happen immediately and may not occur at all.
MACD Divergence
No way we could skip MACD – I mean, it’s got divergence in its name!
Like RSI, MACD dishes out high probability divergence signals. But, the math behind the two indicators calculates momentum differently.
So, MACD usually spots divergence a little sooner.
Here’s a quick example:
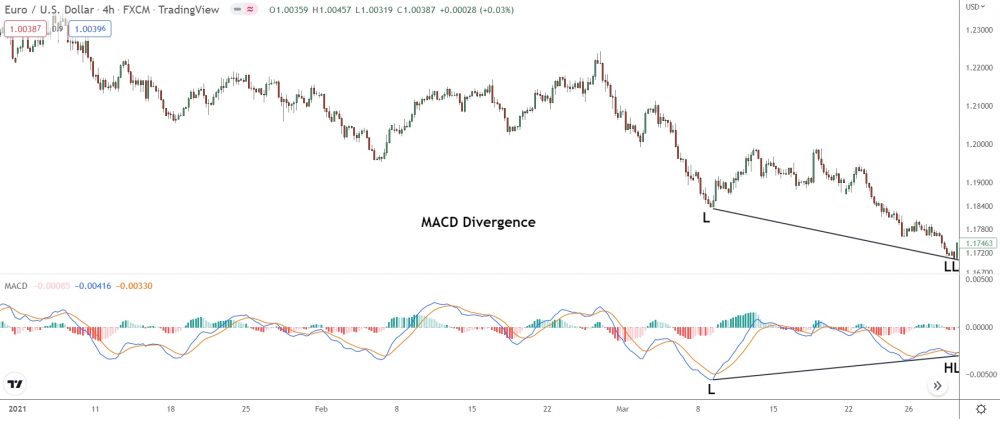
Above, the MACD forms a higher low while price makes a new lower low during this uptrend on EUR/USD, hinting at regular bullish divergence.
And here’s how it went down…
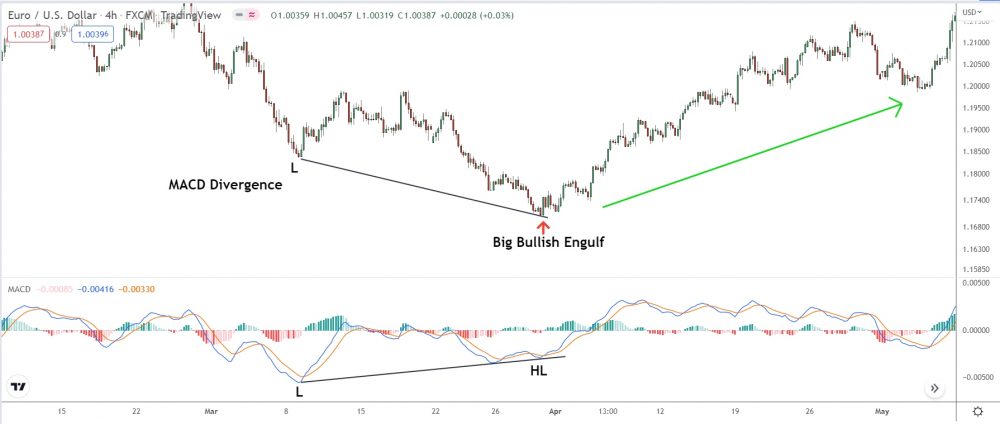
We got a reversal!
And just look at that big bullish engulf – what a sweet entry signal!
Not bad, huh?
Key Considerations:
- Bullish Divergence: Bullish divergence occurs when the price is making lower lows, but the MACD is making higher lows. This suggests that the downtrend is losing momentum and could be near a reversal to an uptrend.
- Bearish Divergence: Bearish divergence occurs when the price is making higher highs, but the MACD is making lower highs. This suggests that the uptrend is losing momentum and could be near a reversal to a downtrend.
- Trend Reversal Signal: Divergences between the MACD and price action may signal potential reversals in the current trend.
- Confirmation: Traders often seek confirmation of the divergence through other indicators or chart patterns before taking a position.
- False Signals: Divergences can sometimes give false signals, suggesting a trend reversal when the original trend continues. Therefore, it’s important to use them in combination with other aspects of technical analysis.
- Timing: While divergences may indicate a potential trend reversal, they do not provide a clear timing signal. The actual reversal may not happen immediately and may not occur at all.
Awesome Oscillator
Maybe not the most popular divergence indicator, but still a super useful one.
The Awesome Oscillator reveals bullish and bearish divergence by comparing current closing prices to the closing prices of the recent past – usually 5 days or bars.
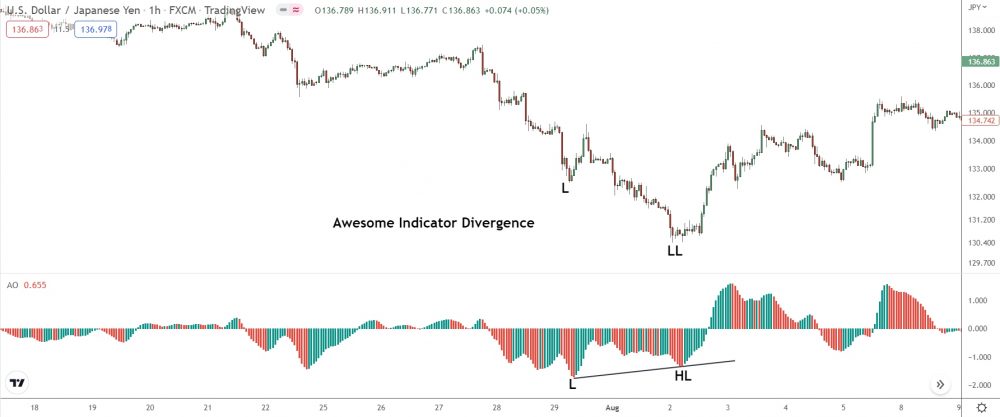
The image above shows regular bullish divergence before a reversal on USD/JPY.
When price hits a new lower low, the AO histogram prints a higher low – a dead giveaway bullish divergence is in play.
Soon after, price soars, confirming the divergence signal.
All in all, the AO is another great way to spot divergence.
- Bullish Divergence: Bullish divergence occurs when the price is making lower lows, but the AO is making higher lows. This suggests that the bearish momentum is weakening, and a reversal to an uptrend might be coming.
- Bearish Divergence: Bearish divergence occurs when the price is making higher highs, but the AO is making lower highs. This suggests that the bullish momentum is weakening, and a reversal to a downtrend might be coming.
- Trend Reversal Signal: Divergences between the AO and price action can potentially indicate a reversal in the current trend.
- Confirmation: Traders often seek confirmation of the divergence through other indicators or chart patterns before taking a position.
- False Signals: Divergences can sometimes give false signals, suggesting a trend reversal when the original trend continues. Therefore, it’s important to use them in combination with other aspects of technical analysis.
- Timing: While divergences may indicate a potential trend reversal, they do not provide a clear timing signal. The actual reversal may not happen immediately and may not occur at all.
And now, our last example…
Momentum Indicator
For our final example, let’s take a look at the momentum indicator.
The momentum indicator, what the heck is that?
It’s an oscillator that measures the difference between multiple moving averages to reveal price momentum. The indicator shows the difference through a line; however, the peaks and valleys can also hint at divergence.
Let’s have a look…
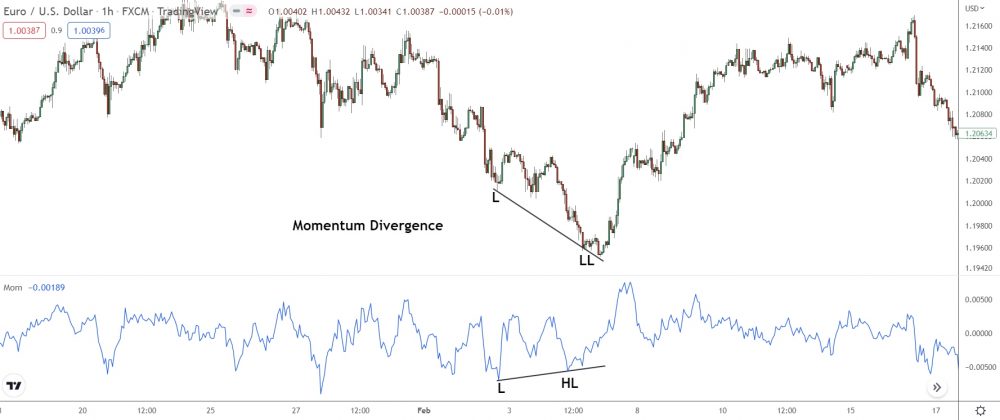
Here’s the momentum indicator showcasing regular bullish divergence during a down move on EUR/USD.
Like the other examples, as price prints a new lower low, the indicator makes a higher low, suggesting some serious bullish momentum brewing behind the scenes. Price then reverses as the bulls take charge and push the market higher.
- Bullish Divergence: A bullish divergence occurs when the price of an asset is making lower lows, but the momentum oscillator is making higher lows. This suggests that selling pressure is declining and the price could soon rise.
- Bearish Divergence: A bearish divergence occurs when the price of an asset is making higher highs, but the momentum oscillator is making lower highs. This indicates that buying pressure is weakening and the price could soon fall.
- Momentum Oscillators: Various momentum oscillators can be used to identify divergences, such as the Relative Strength Index (RSI), the Moving Average Convergence Divergence (MACD), or the Stochastic Oscillator.
- Trend Reversal Signal: A divergence between price action and momentum can indicate a potential trend reversal. However, divergences should not be used in isolation as they can sometimes give false signals.
- Confirmation: Traders often look for additional confirmation before acting on a divergence. This could come from a break of a trendline, a particular candlestick pattern, or a confirmation from another technical indicator.
- Risk Management: Like all trading signals, momentum divergences should be used in conjunction with a risk management strategy.
- Timing: Divergences can provide early warning signs of a potential trend reversal, but they do not provide precise timing signals. The price can continue in its current direction for some time before the reversal actually occurs.
The Bottom Line
And that’s divergence – not so hard after all, eh?
Use these examples as a quick reference cheat sheet to know when divergence may be developing. They’ll come in super handy during peak times when price is moving fast. Don’t forget: Combine divergence with other techniques, too!
Here’s some of my favourites…
- Supply and demand.
- Chart patterns.
- Price action patterns.
- Other indicators.
Divergence can boost the success rate of these techniques ten-fold, making them far more effective trading signals.