You and me both know:
Trading pin bars at support and resistance doesn’t work as well as everyone says. Sure, it gets you into the odd winning trade from time to time. But, it’s not consistent enough to make consistent money, at least as a main strategy.
A few years ago, I set out on a journey to find why.
I wanted to know why trading pin bars at S & R didn’t work that well; because, it should be an effective strategy.
After a bit of research, I found two flaws really bring it down…
#1: Price doesn’t always reverse after a pin bar forms, leading to a losing trade.
#2: Pins don’t always touch the support or resistance level before reversing, leading to lots of missed trades that would have been successful.
Of all the flaws with the strategy, these two, more than any others hurt profitability. They cause you to lose money and miss out on successful trades.
But here’s the good news:
Once I figured this out, I came up with a couple of ways to eliminate these problems… Not completely (because that’s impossible) but, mitigate them to such an extent they make the strategy way more profitable to trade.
Want to see what they are? Read on…
Why has the Pin Bar formed?
Ahh, the pin bar…
Few price action signals can match this little tyke.
The pin bar is a great signal for many reasons: it’s easy-to-spot, provides a simple entry and stop-loss point, and has a good chance of being successful.
Using pin bars to enter trades at support and resistance works very well. But, one of the easiest ways to make it work better is to take into account why the pin has formed“?.
But wait; what do I mean by “why?”
Most price action gurus say all pin bars form for the same reason: traders buying or selling to make price reverse.
I’m sure you’ve heard this truism?
The reality is they actually form from a specific set of traders buying and selling: the banks.
90% of all pin bars form as a result of the banks taking profits off trades or placing trades to make price reverse. The other 10% are due to from news and other such events.
This may not sound like a big deal. Believe me. It is.
The main reason price usually doesn’t reverse from a support or resistance level is because the pin hasn’t formed from the banks placing trades; they are taking profits.
For example:
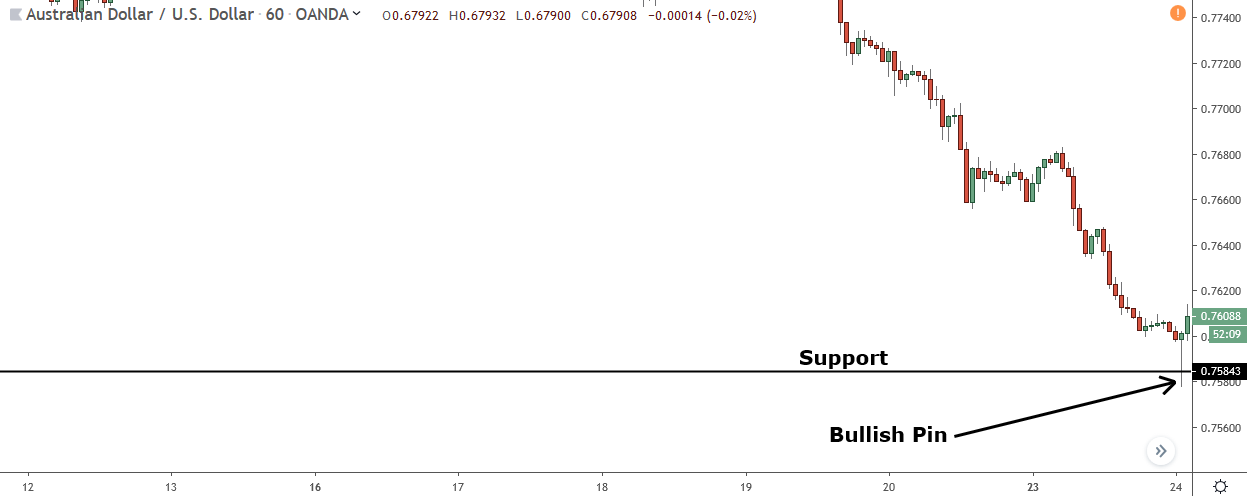
The pin bar above just looks like any other pin bar.
It has a long tail that sticks out from the surrounding price action: a nice small body that’s also green (which is better because it’s a bullish engulf on a lower time frame), and a small wick on top.
You probably think this is a high probability pin – I mean, that’s what all the books will tell you.
Watch what happens…
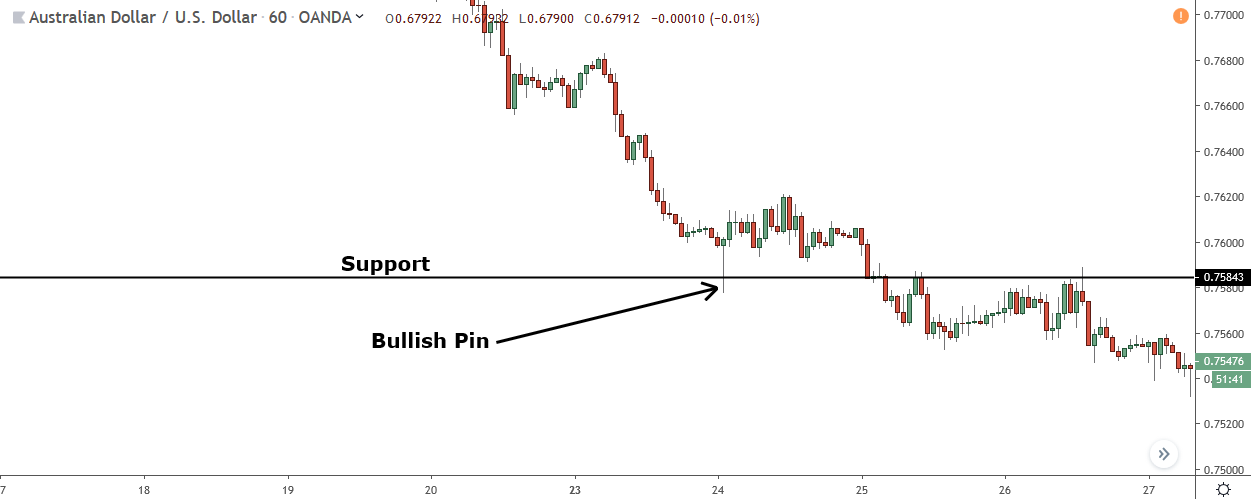
After it forms… price keeps falling.
Now, you can’t say this was because it was a bad pin bar. It had all the right features (big wick, small body, etc). You also can’t say the support level was weak; because, it caused several reversals in the recent past.
So, what caused this pin bar to fail?
It failed because the pin bar formed from the banks taking profits off their sell trades.
The only way to take profits off a sell trade is to buy back some of what you have for sale. In the bank’s case, they’re selling millions. So when they take profits, it causes price to rise. The resulting candlestick then becomes a bullish pin bar, as the profit-taking creates the long wick.
But how can I be sure this is really a profit-taking pin bar?
Maybe it’s just one of those dud pin bars that failed for some other reason?
The way I know it is a profit-taking pin bar is because of where the pin formed.
The pin appeared right after a sharp decline. If you were in a trade and a rise came after a drop like that… What would be your first intention?
Take profits!
You’d take profits to secure some of the newfound profit made from the drop. For the banks, it’s the same. They want to take profits off their sell trades, so they can sell more later.
Try to understand what causes a pin bar to form before trading it at a support or resistance level.
If a pin bar hasn’t formed by the banks placing trades to make price reverse, it probably won’t result in a large reversal. It might cause a small move, but it won’t cause a big swing ending reversal like those you want to be trading.
The easiest way to determine why a pin bar has formed is to look at where it appears.
A pin bar that forms after a sharp move, like the one seen in the example, is usually a profit-taking pin. It’s formed from the banks taking profits off open trades.
On the other hand, a pin bar that forms in the direction of the trend (trend defined by the most recent higher high/lower low) is probably a pin bar created by the banks placing trades, so it is likely to cause a reversal.
Use Support And Resistance Zones Instead Of Lines
Seeing a pin bar come within a few pips of a support or resistance level but not touch it: and then, provide an entry is one of the biggest problems with trading pins at SnR.
I spent ages trying to figure out how to fix this and, for a long time, I couldn’t find any way to eradicate this win-rate killer.
A couple of years ago, I had a breakthrough…
Rather than draw support and resistance levels as lines, you draw them as zones.
It sounds crazy, and it took me a while to get it working properly, but drawing the levels as zones drastically decreases the number of missed trades you’ll have trading pins at S & R.
The big benefit of using zones rather than lines is it gives the pin a wider area to form.
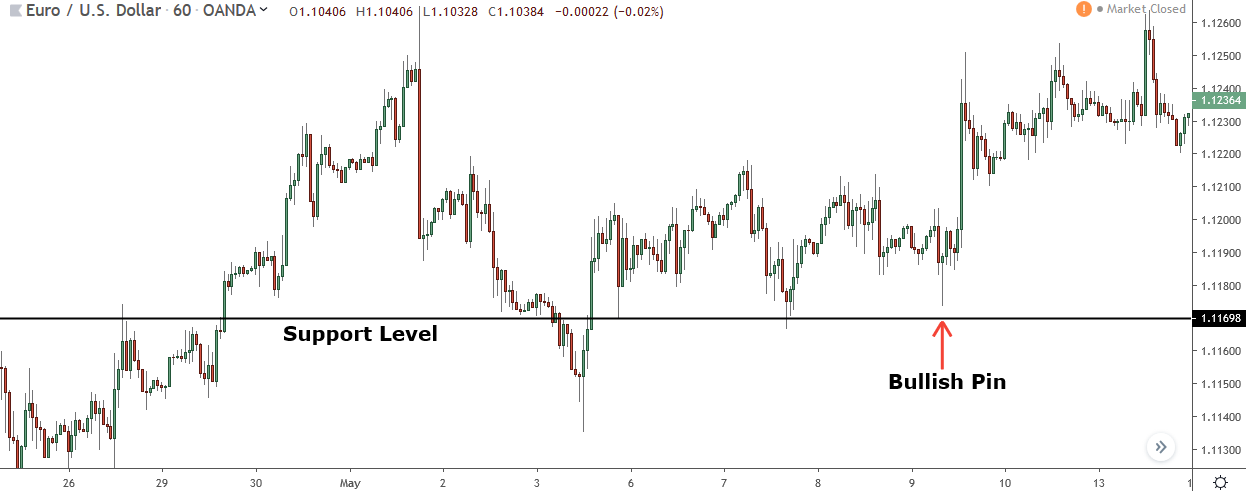
Here’s a pin bar that formed on EUR/USD a few months back.
You can see this pin bar didn’t touch the level. It came close, but just before it was about to hit… price reversed and moved away. This caused a missed trade.
Watch what happens when I turn it into a zone…
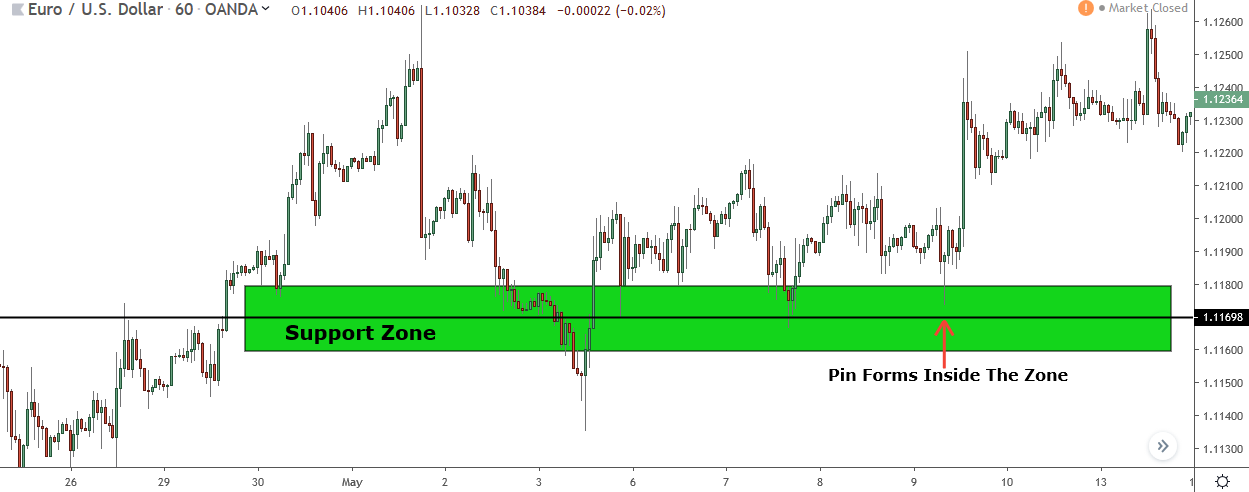
The pin bar forms inside – technically, it forms half-in / half-out, but that counts as inside just the same.
Because it has formed inside, the pin bar is a valid signal.
So rather than miss out on this successful trade, as you would using support and resistance levels, the zone keeps you in and allows you to make money.
This is how helpful the zones can be.
Now don’t get me wrong, they don’t work all of the time. Price won’t suddenly start reversing from S & R levels just because you’ve turned them into zones. But they will significantly decrease the number of missed trades.
Pretty cool, huh?
Putting It All Together
It is time to put these new concepts together. What’s great about this new way of trading pin bars at support and resistance is… it still works the same way you trade them normally.
You mark some zones on the chart. Wait for price to return. See if a pin bar forms.
The only differences are:
- You mark zones instead of lines, and
- You think about why a pin bar has formed before taking the trade.
Everything else is the same… the pin bars still look the same (small body, long wick), and you still draw the zones on top of support and resistance levels.
Let’s go through a quick example…
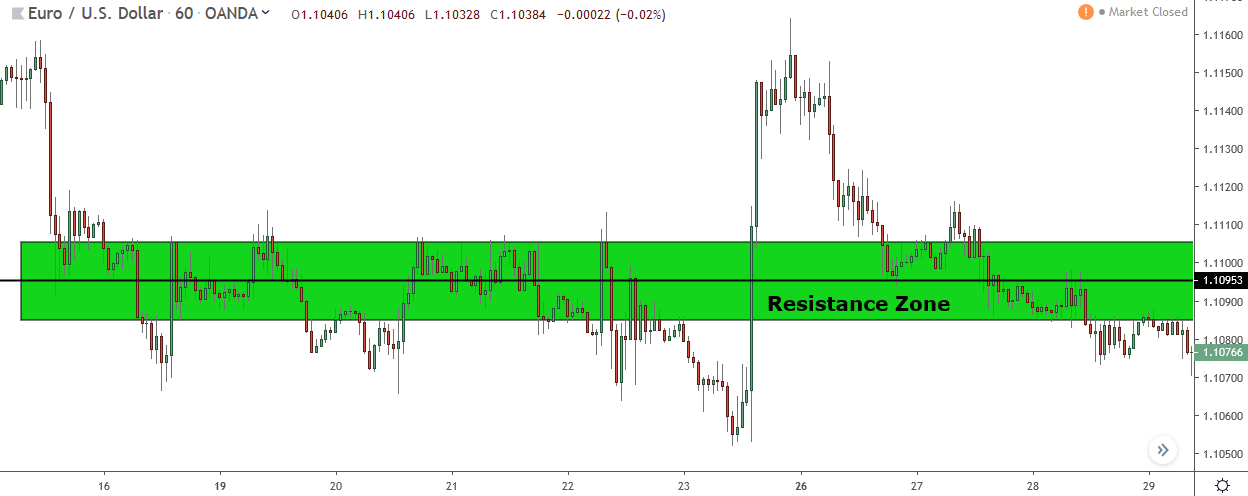
So, here’s a resistance zone marked on EUR/USD.
I found this zone by locating a resistance level then simply marking a zone on top. There is a certain way to mark the zone, based on the number of pips from the level. Deeper and more information is available to my VIP members.
We need to wait for a bearish pin bar to form.
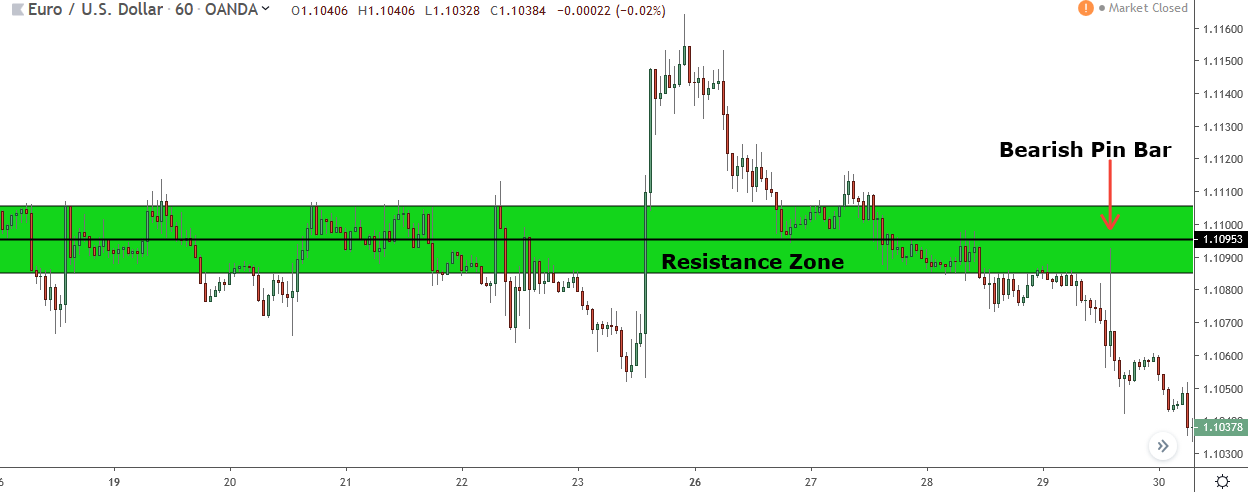
A bearish pin bar can form either fully inside the area or partly inside, as it has done here. If it forms fully inside, price will usually reverse soon after. But if it only partly enters the zone, most of the time, price will drive deeper before reversing.
Next up, the stop loss.
The stop on a support or resistance zone trade always goes above or below the zone.
- For resistance zones, it goes above.
- For support zones, it goes below.
The same as it is in supply and demand trading.
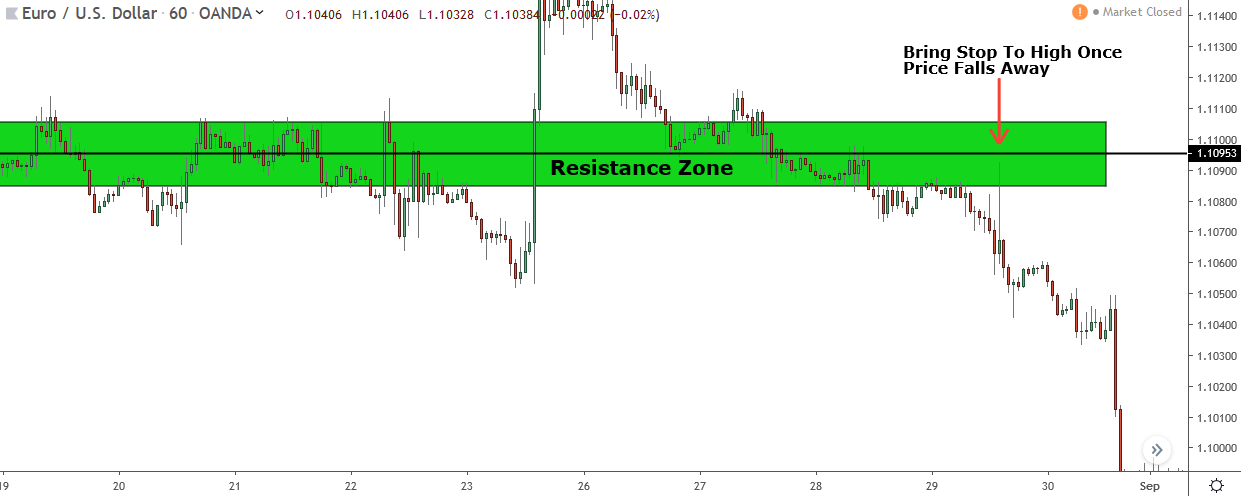
If the trade is successful, like this one is, you can move the stop once price has substantially fallen away.
It’s best to move it to the high or low of the pin bar first (high for bearish pins, low for bullish) and then to the entry price once a sharp move has caused it to fall or rise away from your entry.
Now, you just stay in the trade and see what happens.
Simple. With Practice.
Summary
While the normal way of trading pin bars at support and resistance doesn’t work that well, with these improvements it becomes a very competent strategy.
Test it out for a while, see what you think.
hi. I get one question. if I find the position building at or near the big round number within the trend. (i think this can be a support/resistance lvl). for the entry. can I looking for the large pin bar or large engulf candle as the entry signal?
thx
Yes, you can. Just make sure the engulf is a good size, and the pin has a decent wick. If the engulf is only a small candle, or the pin has a short wick, don’t trade it, as it’s likely the banks haven’t got any positions placed.