
General Price Action FAQ’s:
What Is Price Action Trading?
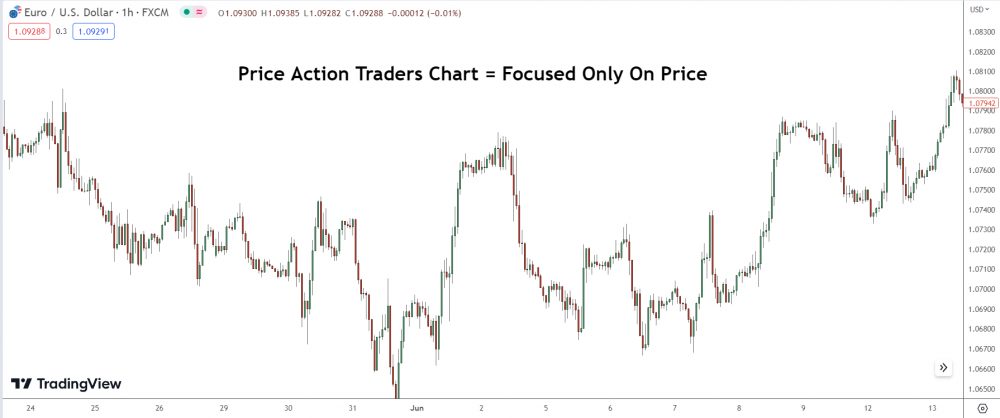
In essence, price action trading is all about interpreting raw price data on a clean chart. No indicators. No clutter.
Just pure price movements.
It’s a minimalist approach to trading that prioritizes simplicity and clarity.
The core idea is to rely on historical prices to predict future price movements. Now, this isn’t about fortune-telling or predicting the exact price. Instead, it’s about recognizing potential market patterns, identifying trading opportunities and making informed decisions.
Price action trading is a bit like reading a book.
Each candlestick on your chart is a sentence.

It tells a story about the market: who’s in control (the bulls or the bears), where the price might be headed next, and so forth. And as you read more and more sentences, you start to understand the plot (the trend), the characters (buyers and sellers), and maybe even anticipate the next chapter.
The beauty of price action trading lies in its flexibility.
It doesn’t matter if you’re day trading, swing trading, or position trading. It doesn’t matter if you’re trading stocks, forex, or crypto.
Price action trading is universal.
It’s a timeless strategy that’s all about understanding the market’s language and using that knowledge to your advantage.
So, if you’re tired of cluttered charts and confusing indicators, price action trading might just be the breath of fresh air you need.
How Does Price Action Trading Work?
The market communicates through price movements.
Price action trading is essentially about reading and interpreting those movements to forecast where the price might go next. It’s a bit like deciphering a secret code – except the code is made of price bars and candlestick patterns!
So, here’s how it works.
First off, you’re going to focus on clean charts.
I’m talking about no fancy indicators or complex tools – just pure price data. You’ll be looking at raw, real-time prices, studying patterns and trends directly from the source.
Next, you’ll learn to identify certain price patterns.
These could be anything from simple candlestick formations like doji and hammer patterns to more complex setups like double tops and bottoms, or trending channels.
Each pattern carries a message about what’s going on in the market – the current mood of buyers and sellers, if you will.
Now, here’s where it gets interesting.
Once you’ve spotted a pattern, the real art of price action trading lies in interpreting what it means.
- Is it signaling a potential reversal?
- Is it indicating the continuation of a trend?
- Is it showing a retracement or consolidation?
This is where your analysis and judgment come in.
And finally, based on your analysis, you’ll make a trading decision. You’ll set your entries, stops, and targets, always being mindful of your risk.
Remember: price action trading isn’t about predicting the market with 100% accuracy – no strategy can do that. It’s about making educated guesses and managing your risk. Over time, with experience, your ability to read the market’s ‘story’ gets better and better.
It’s an ongoing learning process, but it’s well worth the ride.
How Does Price Action Trading Differ From Technical Analysis?
In essence, price action trading and technical analysis are close cousins, but they have some key differences.
Let’s look at technical analysis.
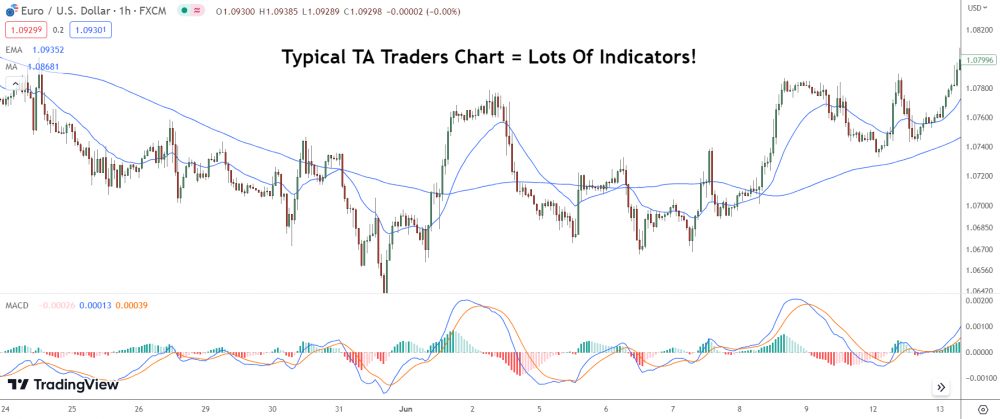
TA involves analyzing past market data, mainly price and volume, and using indicators to predict future price movements. It’s like a toolbox filled with all kinds of instruments and tools such as moving averages, RSI, MACD, Bollinger bands, and so on.
These can be incredibly valuable, but the key is knowing when and how to use each one.
Price action trading is a more minimalist approach.
It’s all about stripping away the bells and whistles and focusing purely on the raw, unfiltered price data on the chart. We’re looking at candlesticks, trendlines, support and resistance levels, and perhaps most importantly, what the market is doing right now.
The core belief behind price action trading: all necessary information is already embedded in the price.
There’s no need for fancy indicators or complex algorithms. It’s about interpreting the ongoing story of the market, told through its price movements.
To boil it down:
Technical analysis is a broad umbrella that uses multiple tools and indicators to analyze the market, while price action trading is a specific approach under that umbrella that focuses solely on the study of price itself.
As always, find the approach that resonates with you and aligns with your trading style.
What Are The Key Patterns To Look For In Price Action Trading?
When it comes to price action trading, it’s all about observing and interpreting the ebb and flow of the markets. You’re looking for specific patterns that indicate potential trading opportunities.
Let’s break down some of the key patterns you should have on your radar:
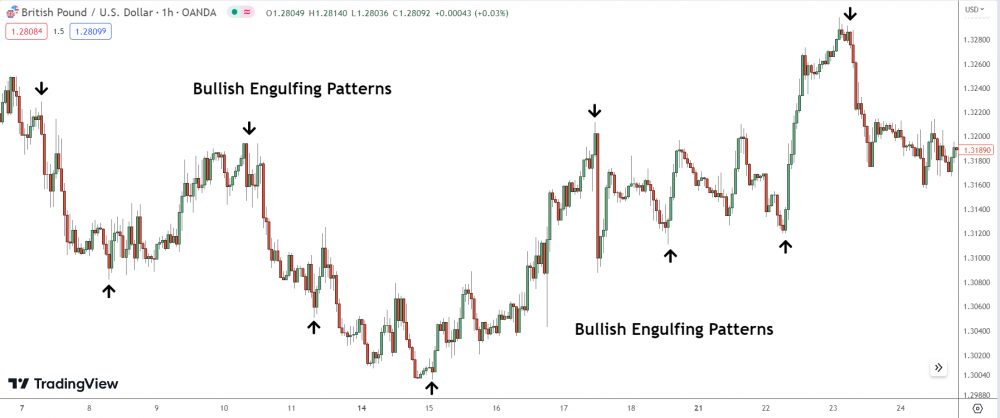
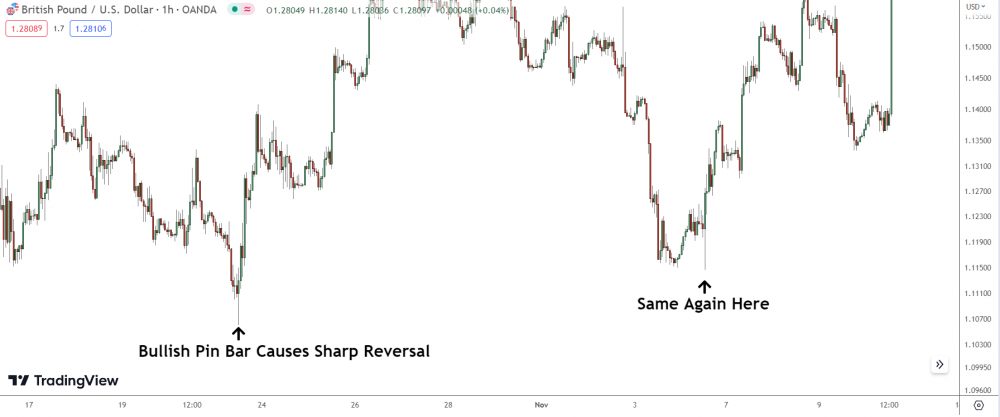
- Candlestick Patterns: These are your bread and butter in price action trading. Engulfing patterns, pin bars, inside bars, morning/evening stars – they’re all about showcasing the tug-of-war between buyers and sellers. Each of these candlestick patterns tells a story about market sentiment.
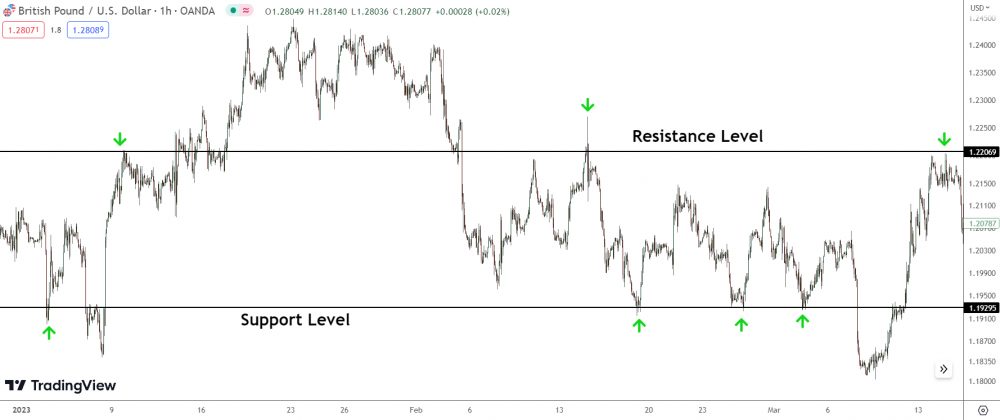
- Support and Resistance Levels: Spotting areas where price historically has bounced back is key in price action trading. When the price approaches these levels, it’s like hitting a wall. It might break through, or it might bounce back. Observing the price action around these levels can help determine reversals.
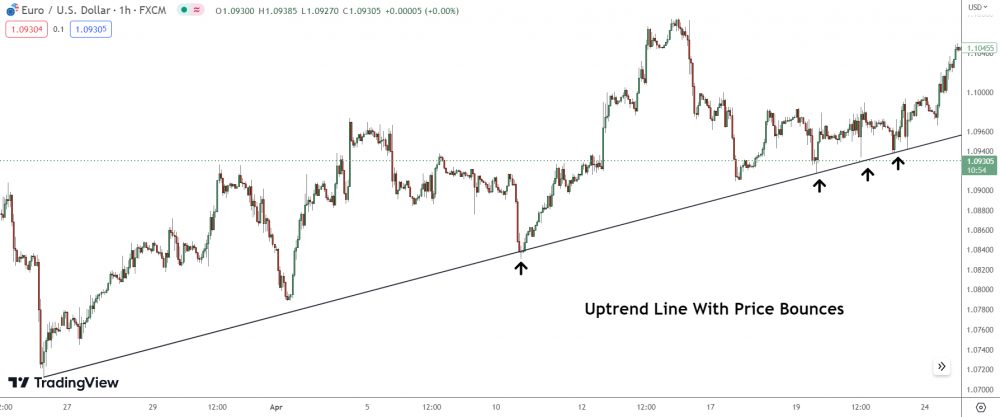
- Trend Lines: They help you visualize the direction of the market – up, down, or sideways. The price often reacts at these trend lines, making them valuable for identifying potential trading opportunities.
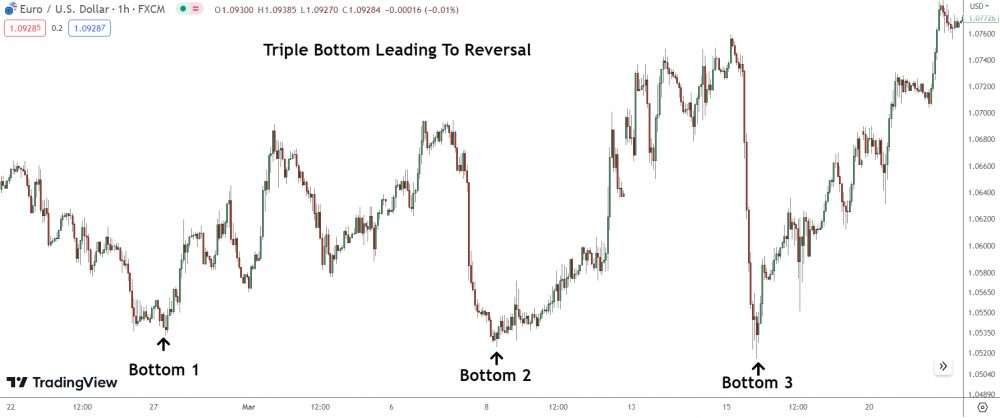
- Chart Patterns: These are larger structures like head and shoulders, double tops and bottoms, triangles, wedges, and flags. They’re essentially a series of candlestick patterns that come together to provide a broader view of the market’s direction.

- False Breakouts: This is when price briefly crosses a support or resistance level, only to revert back. It’s like a fake-out move that tricks traders into believing there’s going to be a breakout. Spotting a false breakout can provide an excellent trading opportunity.
- Reversal Patterns: These indicate that the current trend may be about to change. Reversal patterns could be single candlestick patterns like dojis, or larger structures like double tops and bottoms.
But remember, price action trading isn’t just about spotting patterns – it’s about understanding what they tell you about the market sentiment.
Each pattern tells a story of the battle between buyers and sellers.
Your job is to interpret that story and make informed trading decisions based on it.
Can I Use Price Action Trading For All Types Of Markets?
You sure can!
Whether you’re looking at forex, stocks, commodities, indices, or even cryptocurrencies, price action trading can be your go-to strategy.
Price action trading is all about interpreting raw price data on the charts, without the use of any lagging indicators or tools. You’re studying the actual movements of the market, which is the most fundamental and direct information you can get.
It doesn’t matter what asset you’re trading – prices move due to supply and demand dynamics.
So, if you can read the price, you can read the market.
Simple as that!
Now, does this mean you’ll use the exact same strategies in every market?
Not exactly.
Each market has its own quirks. Forex pairs might trend more consistently, while stocks could be more susceptible to news events. Commodities often have strong seasonal patterns.
It’s essential to adapt your price action trading to the specific characteristics of the market you’re trading.
So, while the foundational concepts of price action trading apply to all markets, be flexible in your approach. Always stay observant, and remember: the market is your best teacher.
Listen to what it’s telling you through its price action.
What Timeframes Should I Use For Price Action Trading?
The timeframes you choose will largely depend on your trading style and objectives.
If you’re a day trader who’s looking to capture small price movements during the trading day, you might be more inclined towards shorter timeframes like the 1-minute, 5-minute, or 15-minute charts. These will give you a close-up view of intraday price movements and allow you to make rapid decisions based on real-time data.
On the other hand, if you’re a swing trader or a position trader looking to profit from larger price swings over a longer period, you might lean more towards higher timeframes such as the 4-hour, daily, or even weekly charts.
These will give you a broader perspective on market trends and help you identify longer-term price action patterns that might not be visible on shorter timeframes.
But here’s the deal:
No matter which timeframe you choose, the fundamental concept of price action trading remains the same. You’re still observing the raw price data, identifying patterns, and making trading decisions based on what the market is communicating through its price movements.
It’s also worth noting that using multiple timeframes can be a powerful approach in price action trading.
For example, you might use a higher timeframe to determine the overall trend or significant support and resistance levels, and then drop down to a lower timeframe to fine-tune your entries and exits.
This way, you get the best of both worlds.
To wrap it up: there’s no ‘one-size-fits-all’ answer here.
The ideal timeframe for price action trading depends on your trading style, risk tolerance, and the amount of time you can dedicate to trading.
Experiment with different timeframes and see what works best for you.
What Are Some Common Mistakes Made In Price Action Trading?
One common mistake is over-reliance on short-term patterns.
Now, don’t get me wrong…
Short-term patterns are essential in price action trading.
However, it’s just as important to consider the bigger picture. Individual candlestick patterns can be quite misleading if you don’t understand the broader context of the market.
It’s about the story the market is telling, not just isolated snapshots.
Some traders also get stuck on chasing the perfect entry.
Price action trading isn’t about nailing the absolute top or bottom of a move. It’s more about understanding the current conditions and supply and demand zones and making high-probability trades in line with those zones and conditions.
So don’t stress if your entry isn’t pinpoint perfect.
The key is consistency, not perfection.
Another mistake – ignoring risk management.
Let me tell you: risk management isn’t optional. It’s fundamental. You can have the best price action strategy on the planet, but if you’re risking too much on each trade, it’s a one-way ticket to blowing up your account.
Always define your risk before entering a trade.
Another common trap is overcomplicating things.
Remember, the beauty of price action trading lies in its simplicity. It’s about raw price, stripped of all the bells and whistles.
Resist the urge to clutter your charts with too many indicators!
Trust in the price, it’s the most direct reflection of market sentiment.
EMAIL FAQ’s: Your Questions Answered!
Question: What Price Action Concepts Do You Use In Your Trading?
Hi,
I recently purchased both your books on how the banks operate and zero sum.
Both books were great and very informative, I appreciate the effort you placed in making them and all the great content you have on your site. I just curious as to know if you incorporate price action in your trading or any other form of analysis?
Thanks,
Response:
As far as price action is concerned I do trade things like pin bars and engulfing candles on their own so long as they form at the right place in the market. I use Fibonacci retracements a little but only for certain setups, apart from that there isn’t really much else I use in terms of price action, support and resistance gets used little but not much due to the fact it’s quite inaccurate for spotting setups.
I don’t really use any other methods of analysis in my trading, I just stick to price action, supply and demand and orderflow, I have knowledge on things like Elliot wave, VSA, harmonics and many others but it don’t use them that much.
Question: Do You Trade Breakouts On Daily & 4 Hour And How Soon Should Price Return To BO Point?
Hi,
I have a quick question on timeframe which shouldn’t take much explaining. Do you take breakouts on the 4hr + Daily charts and would you use a ‘must return within a week or month’ rule?
Thanks.
Response:
I don’t trade breakouts on any time-frame.
However, if you mean trading breakouts using the breakout zones mentioned in my article, then yes, I do trade them, but mainly on the 1-hour chart, not the 4-hour or daily ones.
I don’t really use a time rule with the breakout zones.
The likelihood of the zone working primarily depends on the price action observed once the market breaches the breakout point. Suppose the market breached a breakout point and continued falling, let’s say about 100 pips below the breakout point.
In such a case, you would avoid trading the breakout zone that forms.
Why?
It’s likely the breakout traders will have already closed their trades by the time the market revisits the zone, given the distance the market has fallen from the breakout point.
Hence, the chance of a reversal are low.
On the other hand, if price only fell 20 or so pips below and then began moving higher, I’d consider a trade at the zone. The breakout traders who went short when the breakout point was breached probably still have their sell trades open in the market.
Chances are, they want to close them once the market returns entry point (the breakout point).
How far the market should move above or below the breakout point isn’t something I can determine with 100% accuracy. I usually just eyeball it on my charts. I’ll try to cover it further in future article, so you can see how far the market should breach the BO for the zone to be valid .
Question: How Should I Trade Ranging Markets?
Would you have some thoughts on how to trade the ranging markets that occurs more regularly, I believe, then trending markets?
Regards,
Response:
I haven’t really got any ideas when it comes to trading ranging markets.
I’d say that if the market is in quite a large range with big swings, don’t trade any supply and demand zones or support and resistance levels that form towards the middle of the swings, as they tend to have a low probability of working out successfully.
If I were you I’d spend more time concentrating on trying to get a trade placed when the market reaches the point where the up and downswings of the consolidation form.
The swings always tend to start near to where the other swings have formed, so watching for entries around these points is probably the best plan of action I think.
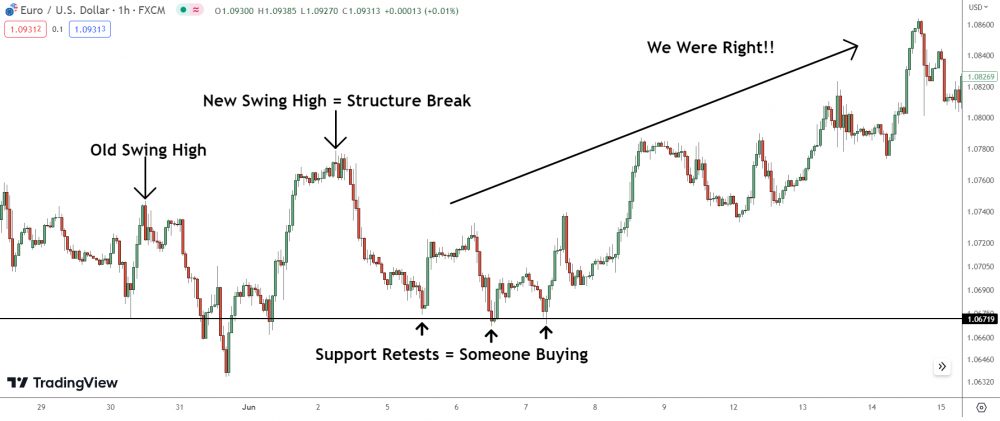
Question: What Do You Mean By Always Trading With The Most Recent Swing High/Low?
Hi,
From reading your online articles i saw a rule you have about always trading with the most recent high and low,
By this do you mean the major swing high and low on the hourly chart or the smaller swings?
I would be very grateful if you could clear this up for me,
Thanks for all your online help and email you are sending out, they are a massive help!
Kind regards
Response:
The most recent major swing high or low you need to be trading are the ones which form on the time-frame you use to place all of your trades off.
I trade the 1 hour chart, so I trade in the direction of the most recent swing low or high on that time-frame, I don’t use a separate time-frame for trend identification like I know a lot of traders do, I just stick to the 1 hour chart.
Question: How Do I Measure How Far Price Has Breached A Swing High/Low Based On Volatility?
HI, i read the book you give me . It’s perfect.
But, can you teach me how to measure the maximum distance the market has managed to move past the swing highs and lows based on a change in volitailty. (as you said you will show in later book, if that, when can i get your next book? any specific date?)
Thanks
Response:
The method of measuring the maximum distance isn’t based on a change in volatility, it’s based on analyzing recent reversals that have taken place in the market to see what the max distance is the market has managed to move past a swing high or low before reversing.
The reason you can only analyze the recent reversals instead of all the ones which took place over a long period of time e.g 2 years, is because if you were to go back and analyze all the reversals which have taken place over the past few years the distances wouldn’t be accurate because the volatility two years ago is different to what it is now.
I’ll have an article coming soon which will detail how to do this, it’s quite simple it just requires a bit of explanation that’s all.
Question: Which Swing Is Considered A Deep Pullback?
Hi, I came across your website a few days ago and have been an avid reader of the articles you have on there since.
I also purchased your zero sum book.
I had a question about deep pullbacks and sent you an email through the website itself but I’m not sure it went through so I’m hoping to reach out via this email address I see in your support/resistance emails.
I just need some clarity on which swing is considered to be the deep pullback.
For example, if we assume the market is trending up (Swing 1). It then decides to retrace (Swing 2). From here, it starts to head upwards again making retail traders think the trend is continuing (Swing 3). Near the highs, however, the trend reverses and heads downwards (Swing 4).
Is Swing 3 the deep pullback? And is that the swing which is usually around the 76.4% fib mark when compared to Swing 2?
Thank you,
Response:
Regarding your question swing 3 will be the deep pullback and you draw the fib grid off of swing 2. Any swing which comes back more than 70% of the fibonacci retracement is considered a deep pullback.
The reason I use the 76.4% retracment to find deep pullbacks is because when the market reaches this point the majority of the traders will believe a continuation is going to take place.
Price Action: Trade Examples
Example: Reversal Structure Pattern Breakdown
HI, one more question i need to know about it. thanks
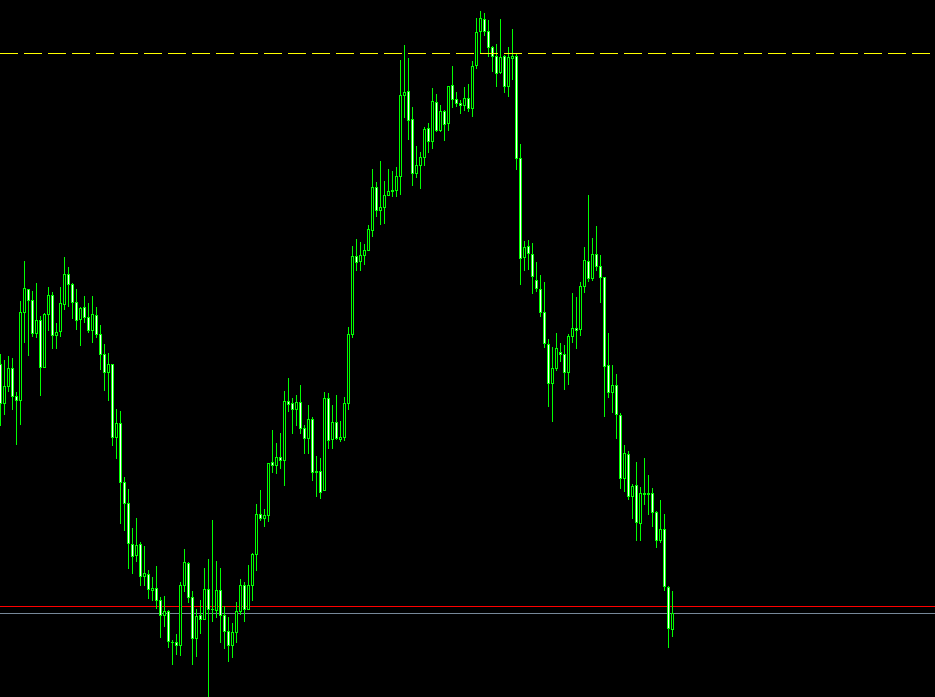
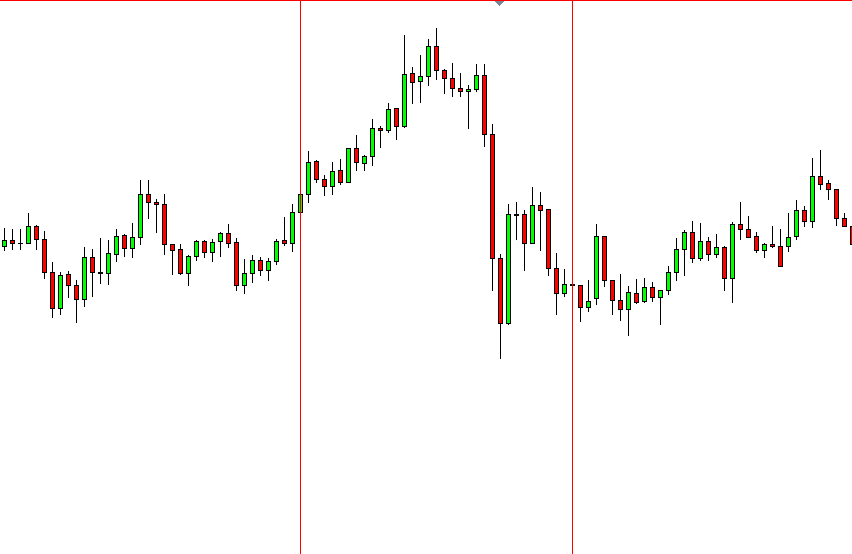
As you can see these two pictures, i want to know, why the 2nd picutre actually causes the trend reverse, but the 1st one not. they all have similar structural, small first up/down swing, i know, in your article said, in order to form the trend reverse pattern, the first up/down swing must be large, but why the pattern in the 2nd picture not. but still cause the trend reverse.
And also the gbpusd has similar situation, it doesn’t have large first down swing, and multipole swing highs at similar price level, but why still forms the trend reverse.
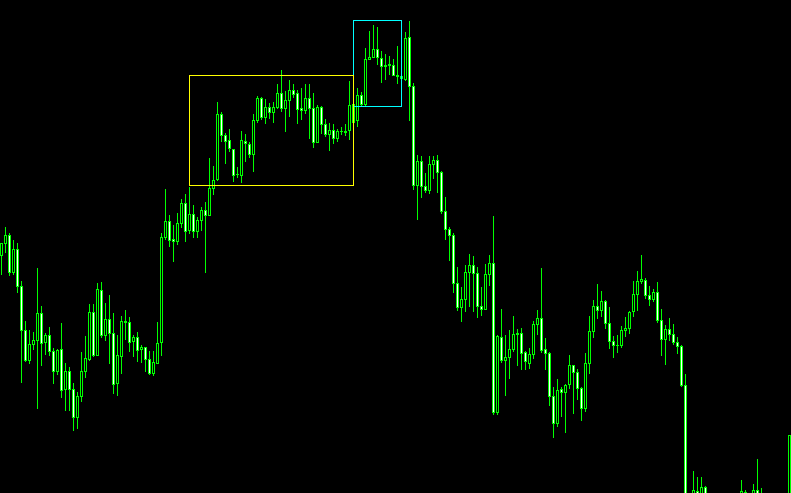
And also, can you explain more sprcifically about how to define the 1st up/down swing, for example:
the 1st down switng of this structure is the yellow box, or the blue one. i am little bit confused with it.
thx
Response:
Looking at your second image, the pattern appears to reverse the trend even without the typical structure because it might be part of a pattern unfolding on the daily timeframe.
If you look at the daily chart on May 11, 2017, you’ll notice a significant drop that results in a swing down. This could be the first in a series of swings down forming a daily reversal pattern, with the swing down in your image potentially being the second in this pattern.
While I can’t confirm this just yet, it does contain many of the usual characteristics – a sharp drop and several large range candles.
As for the first image, I’m not 100% sure what triggered the reversal, so I can’t explain why the pattern didn’t perform as expected.
If you let me know the currency, I’ll investigate the other time frames.
Keep in mind, the first swing down (or up in a bullish pattern) should be sharp and include at least two large range candles. I wouldn’t classify the swing down in either of your images as sharp.
They seem more like small pauses within up-moves and wouldn’t be considered as the first swing down in a pattern on my chart.
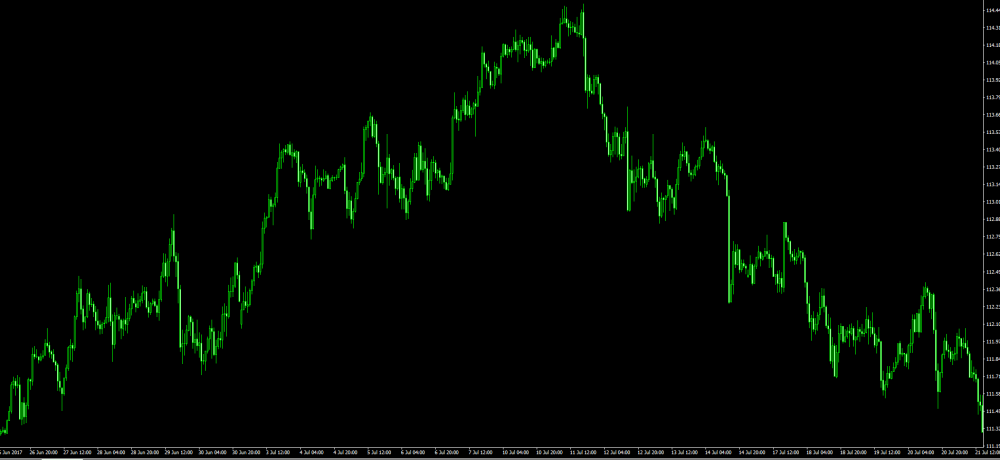
Let’s take a look at the attached image.
This image shows how the first swing down should look when a pattern forms. When you notice a swing down like this, it suggests a reversal structure pattern might be forming.
The swing doesn’t necessarily need to be as significant as the one in the image, but it should have a similar appearance in terms of its construction.
The swing down on GBP/USD looks like it might be the first swing down in a pattern forming on the daily chart. My advice: Watch for signs of a second swing down forming if the price reaches the source of the first swing down that happened on the 3rd.
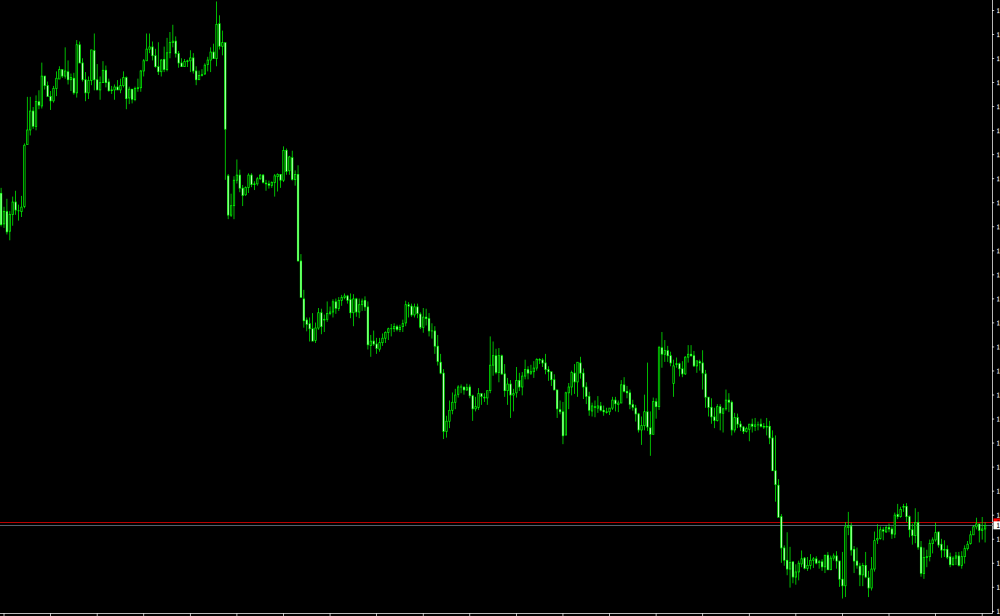
Example: USD/CAD & NZD/USD Price Action Analysis

Ucad weekly looks very bearish. Lots of sell orders placed around 1.31s to 1.32s (as seen by wicks on weekly) at point of initial swing high after the drop..and now a bearish engulfing candle last week.
Similar outlook?
Im a bit confused cos AU also looks bearish and i thought they worked in reverse.
Sorry another question..
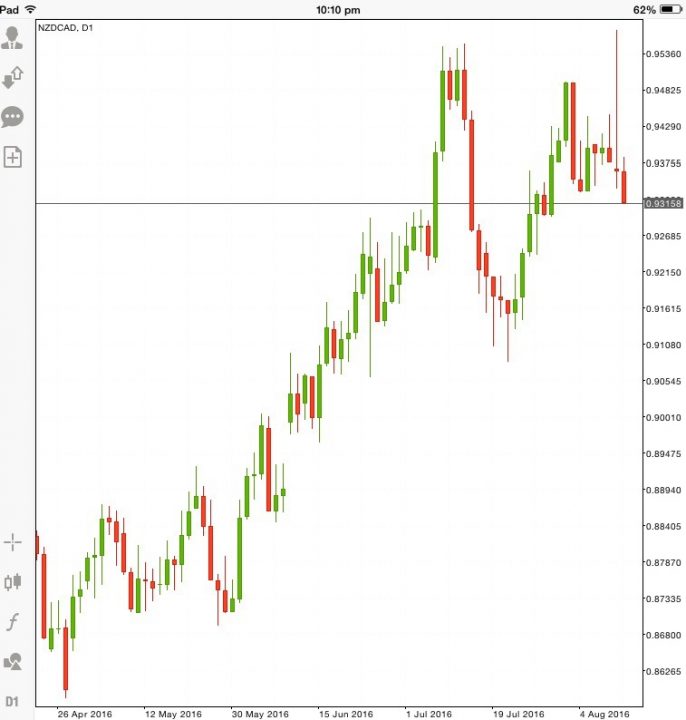
Nzd/cad daily….see attached
I would have typically taken that short when price first revisited supply zone and daily candle then had a big engulfing red candle…only to have been stopped out a few days later due to the 2nd last daily pin bar candle hitting my SL.
Is there any way i should’ve known the short was a bad trade or was it just “bad luck” the 2nd last candle stopped me out?
Thanks.
Response:
Regarding USD/CAD, I think we’ll see a small retracement take place on the daily chart at some point during the week.
That will cause AUD/USD to continue to drop lower.
When the USD/CAD retracement has come to an end, AUD/USD will start to retrace probably back up to the highs made by the current drop. The drop has created a supply zone where I would look for entries short if the retracement manages to move inside the area.
This could possibly be because the banks want to get more of their sell trades placed before the reversal gets underway, when these trades are placed the price will drop again and we’ll see another retracement or consolidation take place on USD/CAD.
To be honest, I think you were just unlucky with the NZD/CAD trade.
I can’t see anything which would have suggested the market was going to break the highs before falling, the news which caused the bearish pin to form could have easily made the market fall straight away instead of causing the spike higher, it’s really difficult to tell what effect the news is going to have on the market as I’m sure you already know.
I’d just move on from this trade as there was nothing you could have done to predict the spike was going to take place.