
General Smart Money FAQ’s:
What Exactly Is Smart Money Trading?
When we speak of “smart money”, we are referring to entities such as institutional investors, hedge funds, and investment banks.
Or, in other words, the big players.
Their trading volume is massive, and their actions cause market trends.
“Smart money trading” is about monitoring these influential players and determining when they might take buy or sell large amounts. They have the capacity to cause significant shifts in the market, and understanding when/where these shifts may occur can help us better time the market.
The core idea revolves around tracking the smart money.
Traders employing smart money strategies attempt to analyze and forecast where these large-scale players are likely to invest. It’s not merely about watching buy or sell orders ala order flow trading, the strategy is a tad more intricate and intuitive.
The smart money has the resources and the patience to distribute their trades, thereby preventing abrupt market disturbances.
It’s somewhat akin to strategically distributing your chips on a poker table.
Therefore, it involves looking for indications that suggest the likely direction of smart money. These hints can be discerned from price trends, volume alterations, or game theory.
How Does Smart Money Influence Price Movements In The Trading Market?
Smart money traders have the ability to dictate market movements.
These big players, well, they can move the market. It’s not just about buying and selling for them, it’s about influencing the direction of the market. It’s a like playing chess and trying to anticipate your opponent’s next move.
They’re not just reacting to the market; they’re one step ahead.
How do they do that?
Well, when they execute large buy or sell orders, it can create a shift in the supply and demand balance, affecting price levels. A large buy order can increase demand, pushing prices up, while a large sell order can increase supply, dragging prices down.
But here’s the interesting part:
They’re very smart about it.
They don’t just plonk a massive order down all at once. That would be too obvious. Instead, they often break up their orders into smaller chunks, or gradually execute over an extended period.
But hey, don’t be fooled into thinking that smart money always gets it right. Even with all their resources and strategies, they can’t predict every market turn.
They’re a part of the market, yes, but not the whole market.
Countless other factors influence price movements in forex.
Understanding how ‘smart money’ operates can provide insight into the mechanisms of the forex market. However, it’s important to remember: this is just a single component of the broader picture.
Your strategy should always remain comprehensive and adaptable.
In the realm of the market, the learning process is ceaseless.
How Can I Differentiate Between Smart Money And Retail Traders In The Market?
The first clue is the the size of their trades.
Smart money tends to make larger trades that can influence the market, while retail traders are typically making smaller trades that don’t have little to no impact.
Another key difference is in how they behave.
Retail traders often chase trends, buying when prices are high and selling when they’re low. It’s like they’re always a step behind.
On the other hand, smart money often moves ahead of the curve.
They buy low and sell high, setting the trends that others follow.
But here’s the secret: Smart money tends to leave footprints in the form of market patterns and trends. They might use strategies to hide their moves, but there are often signs—like sudden price movements or changes in volume.
These are your clues to identifying smart money in action.
Just remember, it’s not about trying to beat the smart money. It’s about understanding their moves so you can make smarter decisions.
Keep your eyes open and stay flexible.
What Strategies Do Smart Money Traders Use Most Often?
Firstly, one of the big ones is ‘order flow/sentiment analysis’.
This involves tracking orders to gauge when extreame sentiment exists. The smart money will position against this sentiment to make the traders lose and pocket a tidy profit.
Crafty, eh?
Secondly, smart money often practices ‘risk management’.
More of a principal than a strategy, the smart money aren’t about to risk their entire portfolio on a single trade. Instead, they set limits to ensure that even if a trade goes sour, it won’t wipe them out.
Lastly, many smart money traders use ‘algorithmic trading’.
This involves using complex AI systems to execute trades at superhuman speeds. These algorithms can identify trends and execute trades far quicker than any human ever could.
While these strategies might sound complicated – and they can be – the essence of each is relatively straightforward. Understanding the market, recognizing conditions, managing risk, and leveraging technology is key to smart money trading.
How Can I Identify The Actions Of Smart Money In The Forex Market?
One of the things to look for is significant price movements.
When institutional players or smart money make their moves, they usually do it with large volume, which can lead to large, notable swings in the market. These price movements can be an indicator that smart money is making a play.
Second, watch for times of high liquidity.
You see, smart money doesn’t like to draw attention.
They prefer to make their big moves when the market is most liquid, that is when there are lots of buyers and sellers. This way, their substantial transactions don’t disrupt the market as much and it’s harder for others to notice.
Another clue is the market reaction to news events.
News can affect Forex prices, we know that.
But often, how the market responds to these events can give you a hint of where the smart money is heading.
Lastly, you can also consider using various trading tools and indicators designed to track volume or money flow.
These can give you insights into where money is moving in the market.
Like with everything in Forex trading, there’s no foolproof method to spotting smart money. These are just potential signals and need to be used in conjunction with other tools and strategies.
How Can I Use Price Action To Identify Smart Money Movements?
“Price action” is the movement of a currencies price plotted over time, and it can be a really effective way to identify smart money movements.
I know, I know, it might sound a bit complex, but stick with me here.
First, let’s make one thing clear.
While smart money is savvy and strategic, it isn’t invisible. It leaves behind a trail in the form of price action. By analyzing the patterns in price movement, you can start to figure out where the smart money might be heading next.
So, how do you do that?
Well, let’s break it down.
Keep an eye out for significant price changes.
When smart money decides to enter or exit a position, they usually do it with a bang, not a whisper. These are big players we’re talking about here. When they make a move, they cause waves.
If you see sudden, significant price movements, smart money are probably the culprit.
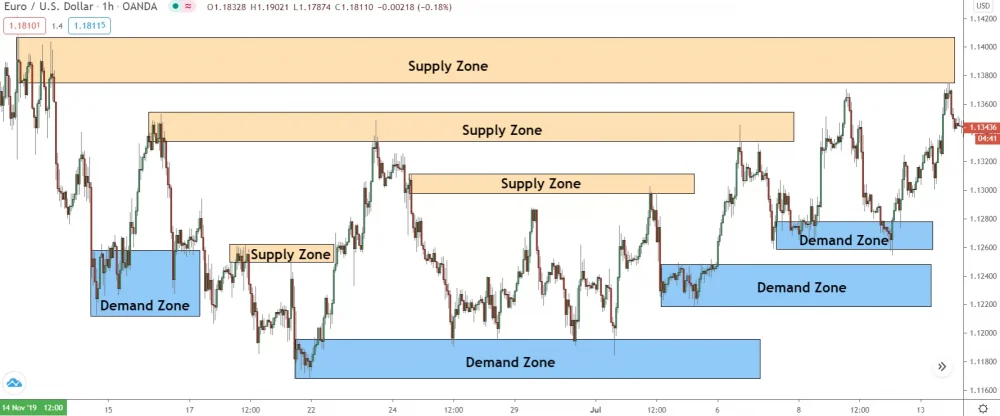
Also, look out for price levels where the market has consistently seen a lot of buying or selling pressure. These are known as supply and demand zones. If price reverses from a zone, it might be because smart money is propping it up or holding it down.
Another thing – look for signs of volume.
Volume represents the total number of contracts traded during a certain period of time.
If you see a spike in volume, that’s a sign that a lot of trading is going on – and it’s often smart money that’s behind those big moves.
Finally, it’s important to realize that the market is a bit like a game of chess – it’s all about strategy. Smart money knows how to play the game. They often use complex tactics to mask their moves, like breaking up their trades or executing them over an extended period of time.
As a trader, you’ll need to look beyond the surface to identify these strategies.
By combining these techniques with a solid understanding of market fundamentals, you can start to decode the movements of smart money and make more informed trading decisions.
How Can I Avoid Falling Into Smart Money Traps?
Don’t chase the market.
That’s rule number one.
Smart money often manipulates price to create false breakouts or reversals. Retail traders get excited and jump in, only to find the market reversing course.
It’s like a mirage.
You think you see it, but it isn’t really there.
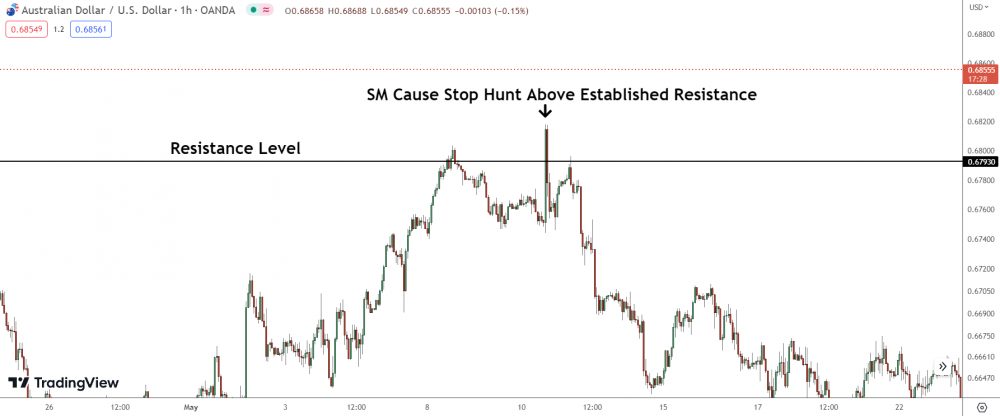
Next, learn to recognize and understand market manipulation patterns. These could be things like stop hunts or engineered price spikes.
Also, patience is a trader’s best friend.
Wait for solid, high-probability trade setups. And when they appear, aim for reasonable profit targets. Don’t get greedy.
Use protective stop-loss orders. Always. It’s like your safety belt when driving. You may not need it every trip, but when you do, you’ll be glad you have it.
Last but not least, keep educating yourself. Learn from your mistakes, because even the best traders make them.
The key is not to repeat them.
What Is The Role Of Liquidity In Smart Money Trading?
When we talk about trading, liquidity is king.
It’s like the lifeblood of the market.
But what is liquidity?
In short: it’s the ease with which an asset, or security, can be bought or sold without affecting its price. A market is considered highly liquid if there are enough participants trading that large transactions won’t drastically sway the price.
Now, let’s bring ‘smart money’ into the mix.
Remember, ‘smart money’ need massive volumes in order to buy or sell effectively.
When few buyers or sellers are around, the smart money can’t enter any major postions – not enough volume exists. Hence, they must operate during high liquidity times. In the case of forex, that’s during the trading sessions which best represents the two currencies being traded.
Furthermore, highly liquid markets allow these big players to hide their tracks.
They can split their orders into smaller chunks, spreading them out over time to prevent their actions from overly influencing the market. This way, they get to move their money without the market moving against them.
In summary, liquidity is critical to smart money trading.
It allows for large transactions without significantly affecting price, makes it easier to enter or exit positions, and helps mask the movements of these large players.
Email FAQ’s: Your Questions Answered!
Question: Does The Smart Money Operate On All Timeframes?
You mentioned that all reversals are created by the banks. Would you say that this is on all time frames (5 min – 1 week)? And would this mean that the (bank) daytraders are working on a different ‘operation’ than the (bank) long term traders or would it be a self supporting system across all time frames?
Response:
Yes, although not on every time-frame like you say.
There are three time horizons the banks work off, the short term – medium term and long term. The time-frames that best represent these time horizons are the ones which the banks use for trading. So I would say the 1 minute and 5 minute are used for the short term, the 1 hour for the medium term and the daily for the long term.
All the reversals you see take place on these time-frames are caused by the banks placing trades, closing trades or taking profits.
I think the day traders and long term traders are working together it’s just they have different objectives in the market.
Ultimately the long term traders are the most important because they are the ones who have the biggest trades placed so the day traders will have to operate in a way where they know they’re not jeopardizing the positions placed by the long term traders.
At the same time they’ll help push the market to the points where the long term traders want to get trades placed whilst also making a profit on their own trades.
Question: What’s The Best Method For Entering With The Smart Money?
Hey, I read the last book you sent me. Very interesting and educating. It provides understanding, to something that seems random, and so reduces stress.
You are pretty knowladgeble about how banks think and operate. In your opinion, where do you think it is best to place a trade when anticipating a reversal?
Im thinking of a few alternatives.
1, Trying to place trades near where the banks are placing trades, for example when price retraces back to initial price. This allows for tight stop loss.
2, Placing a trade on first pullback, where banks are taking profits, along with placing more trades. Requires looser stop loss.
3, Take advantage of banks stop hunting. For example when price breaks outside a consolidation area (opposite direction of anticipated trend), and buy shares that are now for sale due to stop losses being hit.
In your experience where in the process do you think it is best entering?
Kind regards
Response:
When it comes to reversals, the best strategy would be to enter where banks are placing their own trades, ideally before the reversal begins.
For me, that’s supply and demand zones.
A word of caution, though: don’t attempt to predict reversals.
The right approach is to allow the right price action to appear and then draw your conclusions from that. Reversals which lead to significant shifts in price direction usually involve banks executing multiple trades over a small time windown (relative to the timeframe).
Fidning where these trades are placed can help you identify ideal entry points for your own trades.
The core idea is to monitor the unfolding price action and try to identify where the banks might have executed a trade. Once you think you’ve pinpointed where a trade has been placed, you can use the subsequent swing high or low, which has formed as a result, as a boundary.
The high/low is where you expect the market not to break and thus can be considered a safe location to place your stop loss when you execute your own trade.
Should the market break significantly beyond the point where you suspect the banks have placed a trade, it’s a clear signal. Either the banks haven’t been executing trades to cause a reversal, or they have, but you’ve misidentified the location.
Question: How Does The Smart Money Cause A Trend Reversal?
Good afternoon/evening
I just read your book on how banks trade and would like more information on how the begin a reversal.
Response:
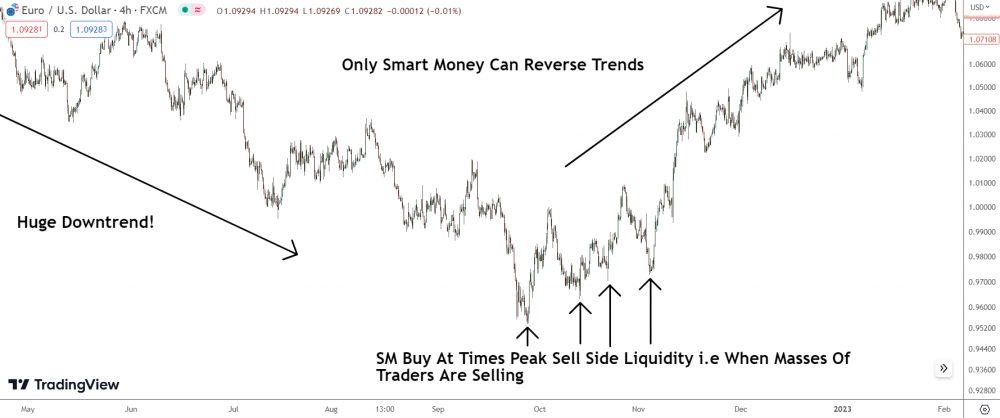
Banks will usually cause a reversal when the profit potential of the current movement is exhausted. As the market trends for an extended period, an increasing number of traders will start placing trades in the direction of the trend.
Now, remember: Forex is a zero sum market.
One trader’s profit is another trader’s loss.
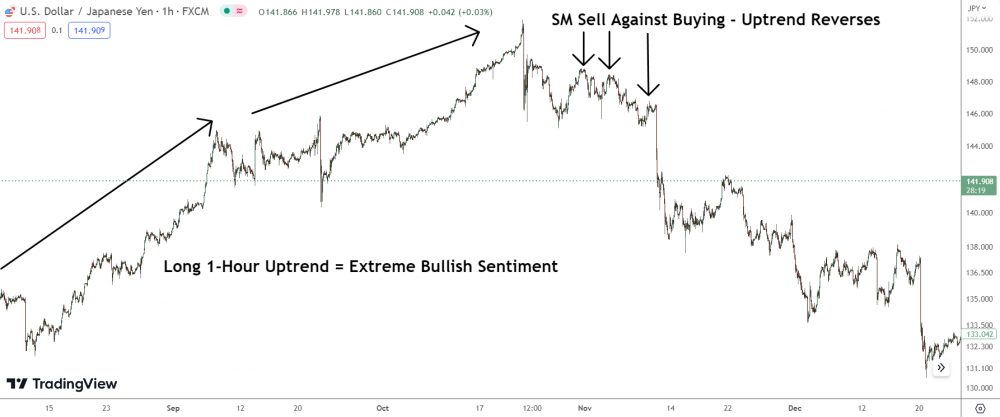
If most traders are placing trades in the direction of the trend, a point is eventually reached where very few retail traders are losing, which means the smart money can’t profit anymore – as forex is zero sum, like I just explained.
To start profiting again, banks must instigate a counter trend movement:
- A substanital retracement,
- A Large consolidation,
- Or big Reversal.
The above would force the retail traders trading in the direction of the trend to close their trades at a loss.
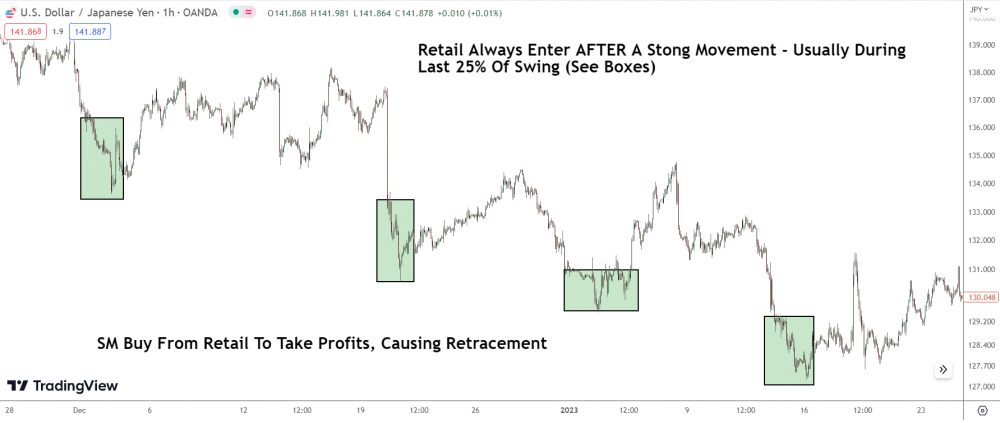
Once the bank traders have some of their trades in place, they’ll steer the market back towards the previous trend. This strategy prompts many traders to place trades in the direction of the trend once more, resulting in an even larger pool of market orders for the banks to leverage.
Consequently, more traders stand to lose money when the price fully reverses.
Question: How Do You Know About The Smart Money? Were You A Bank Trader?
Hi,
I found your website a few days ago while searching for some information on drawing Supply and Demand zones. I have downloaded your supply and demand book and found it to provide some very useful information.
I have been trading for about 4 years now however with variable results and my aim is to enter the new year with a viable system that has the potential to produce consistent results.
I have also read some of the articles on your website and found your insight into how and when the banks and institution place trades and affect the market to be an added dimension to my chart analysis.
I am looking to purchase your paid download books however it would be interesting to know a little more about the person behind the website. Do you have a professional trading background hence your knowledge of the way the institutions place their trades. I hope you may be able to share a bit of background.
Thanks for providing a website with some very useful trading guidelines and information.
Many thanks
Response:
Nope – I have no professional background in trading the markets.
I never been part of a bank, hedge fund, or similar institutions.
My knowledge has been mainly been acquired by dissecting facts in the market and then reverse-engineering these to comprehend what’s actually transpiring.
For example:
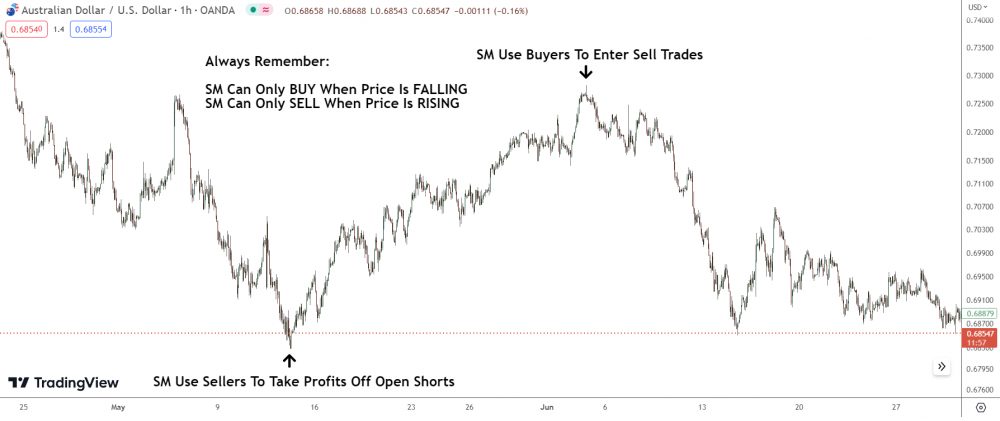
One key fact I managed to decipher was banks can only place buy trades when the market is falling, and sell trades when it’s rising.
Sounds simple, right?
But this has massive implications when trading.
Given that you need sell orders to execute a buy trade and buy orders for a sell trade, it reveals the banks need a substantial number of people buying or selling—depending on their intent—when they want to execute their actions in the market.
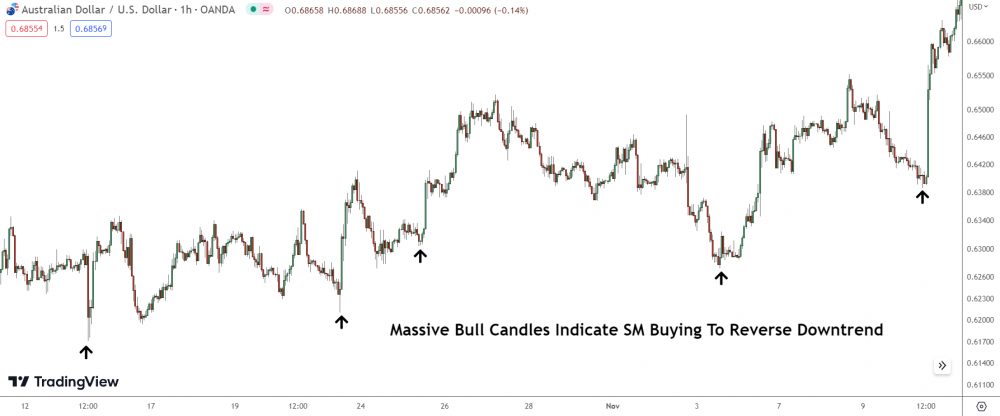
Significant buying comes in when the market is on the rise, and a heavy selling occurs when price is declining. Hence, if the banks wanted to cause a rise in price, they would have to place their buy trades when the market was falling.
That’s the only time when sufficient sell orders exist for them to execute their buy trades.
On placing these buy trades, the sell orders would execute, causing price to rise and forming a swing low on your charts. Same process happens for sell trades: the banks would have to sell when price is rising. When they sell, price would fall, creating a swing high.
This information is quite valuable as it enables you to pinpoint the exact locations where the banks executed their trades to instigate a higher or lower move.
Instead of seeing a rise or fall and wondering, “Where did the banks place their trades?” you can actually identify the precise location of their trades; the swing low (for a rise) or swing high (for a decline). So whenever you see a low or high forming, it shows the banks having taken some action in the market.
Question: How Does Smart Money Cause Ascending And Descening Triangles To Form
Hi,
Thanks for the response.
Question for you: I get it that during consolidations banks are either taking profit or accumulating positions… what do you say about things like a ascending/descending triangle where say right now AUDCAD…. it has like a pretty good supply zone but you keep seeing higher lows… what are the banks trying to do there?
Response:
Ascending and descending triangles form because the bank traders are taking profits off their trades.
The banks take some profits, then get some trades placed before taking profits again. They repeat this process over and over until all of their trades have been placed, at which the point the market will break out of the triangle and continue moving in the direction it was moving in before.
I can’t really speak on the AUD/CAD situation, because I don’t have it on MT4 unfortunately.
Smart Money: Trade Examples
Example: Consolidation (Not Sure Which Pair)
Hi,
Thanks for the write up on the mechanic of price manipulation in forex market which has been an eye opener for me! I have some questions which I hope you can help clarify and clear my doubts.
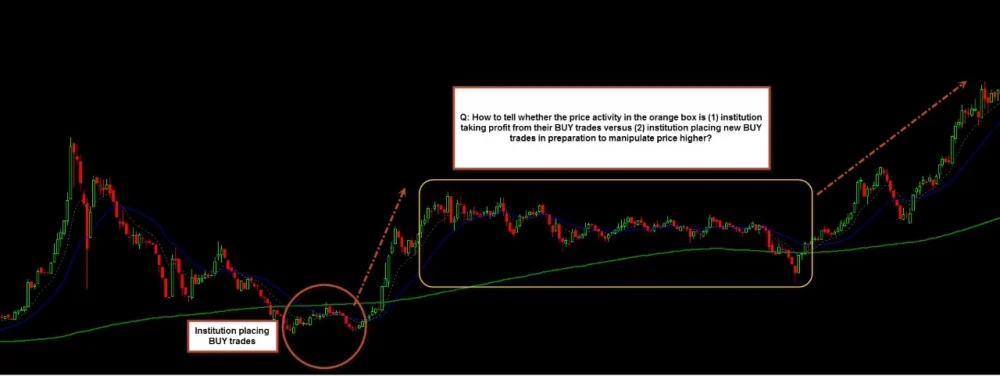
1/ Can you explain how we can differentiate (see attached weekly chart picture) between distribution and re-accumulation?
2/ How can we tell when institution have taken full profit off their earlier trade and ready to reverse the trend via new trade placement in the opposite trend? An example will be nice =)
Hear from you soon, and thanks!!!
Response:
The price action within the box is a reflection of the banks both taking profits from buy trades and initiating new buy trades in anticipation of the next upward movement. The downward swing visible on the far right of the orange box represents the point where the banks executed their buy trades.
The consolidation seen prior to this was them locking in profits from the buy trades they had placed at the swing low, as marked on your image.
Initially, when the consolidation appeared in the market, it would have been tough to determine why it formed. The best course of action would have been to monitor the swing low, where you suspect the banks have placed their buy trades.
If the banks have additional buy trades to execute, they’ll likely do so close to where their other buy trades have been placed, which aligns with the swing low you’ve marked on the image.
Determining when the banks have fully capitalized on their trades is complex, given their constantly changing positions. They secure profits from their trades while placing new trades. Hence, it’s virtually impossible to identify a definitive indicator confirming the closure of all their trades.