
Want to know why so many ‘perfect’ pin bars fail to cause a reversal?
Why the best supply and demand zones don’t form from strong moves away?
How to predict when and where a stop hunt will take place?
Well, read on…
Because in this post, I’m going to share with you 7 price action secrets that explain all of the above plus much more.
These aren’t the typical “watch for pins with big wicks”, “support and resistance levels work better with multiple touches”, secrets you hear most other price action experts spew, but real secrets; things you’ve never heard or seen anywhere else before.
Let’s take a look…
1. Support And Resistance: Zones Work Better Than Lines
It’s one of the most annoying sights in price action, and one I’m sure you’ve experienced yourself many times.
Seeing the price move to a support or resistance level, then reverse without touching the level (and failing to provide an entry) infuriates even the most level-headed of traders, especially when it results in missing a successful trade.
But it is possible to stop this…

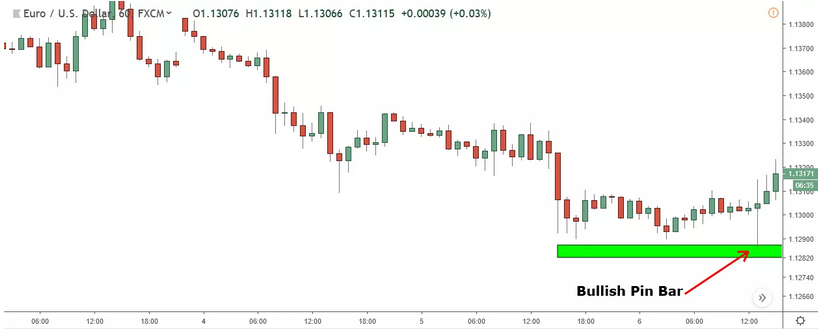
This is a textbook example of what I explained.
Price falls to support and a bullish pin bar forms. But rather than form after touching the level, the pin forms a few pips away, causing you to miss out on a successful trade.
Annoying, to say the least.
Now I’m going to show to you the image again. But this time, instead of marking the resistance level as a line, I’m going to show it as a zone.

Marking the level as a zone removes the need for price to form an entry pattern at the level. This solves the big problem with trading support and resistance.
Before, price had to produce a pattern after hitting the line to give a valid entry.
Now, it just has to produce a pattern somewhere inside the area, which makes it much easier to trade, and drastically reduces missed entry problems.

Here’s another one, this time with a resistance level.
Again, price comes down, almost touches the level, then reverses without providing an entry.
Let’s see what happens with a zone.
 And just like the previous example, having the level defined as a zone instead of a line gives the price a much bigger area to reverse in, making it easier to trade and get an entry.
So the message is clear: support and resistance zones work much better than lines.
Lines still come in handy from time to time – like when a really important level forms – and you still need to find the line to mark a zone, but overall, zones do make the levels much easier to trade.
Learn more about how to mark and trade support and resistance zones in this post.
2. Pin Bars Don’t Form For The Same Reason
Take a look at the pin bar below.

According to most price action experts, this bearish pin has a great chance of causing a reversal. It has a long wick, a small body, and has formed at a major resistance level.
All in all, it should cause the price to reverse.
But look what happens…

Price continues to rise. The pin hardly caused it to fall an inch.
Most people would put this down to bad luck. Some pins fail; it happens. And while that is the case for many pins, there’s another much more likely reason this pin failed to cause a reversal…
Because it formed from the banks taking profits off their trades.
All price action sites assume pin bars form for the same reason: people buying and selling to make the price reverse.
To most traders this makes sense. I mean, why else would they form? However, when you dig a little deeper and think about how the market actually works, you realize just how wrong this really is.
For a start, people don’t always buy and sell for the same reason. Some buy because they want the price to reverse. Others buy to take profits off a sell position.
On top of this, the same people don’t always buy or sell. A bank may buy to make the price reverse; a bunch of retail traders might sell in response to a news release.
These actions all have a huge effect on whether a pin will cause a reversal or not.

Here’s another seemingly ‘perfect’ pin.
Like the other example, it has a long wick, a small body, and has formed at a support level.
 But again, it doesn’t cause a reversal.
This pin failed not because it formed at the wrong technical level or didn’t have the right features. It failed, because it was created by the banks taking profits off their trades – sell trades in this case.
If you look where it formed, this becomes obvious.
The pin appeared almost immediately after a sharp decline. Whoever sold to cause the decline – most likely the banks – would naturally now want to take some profits off.
What happens when they take profits?
Price rises, resulting in a ‘supposedly’ great bullish pin bar that fails to cause a reversal.
If you want to become more successful trading pins, you need to start thinking about why they form.
Having a big wick and appearing at multiple technical levels is important, don’t get me wrong. But your main focus should always be on figuring out why the pin has formed. Because that’ll have the greatest effect on whether it causes a reversal or not.
3. Candle Wicks Reveal What The Banks Are Up To
If it wasn’t already obvious, the banks are pretty important in trading.
Knowing how they operate and how they place trades is the key to making money. But as you’ve already seen, this is far from easy, and requires a deep understanding of how the market works.
One simple way you can get a sense of what the banks are up to is to look at candle wicks.
The most important fact to understand about the banks is they can’t buy or sell unless other traders are buying or selling at the same time: buying if they want to sell and selling if they want to buy.
This has two really important implications for trading:
- The banks can only buy when the price is falling.
- They can only isell when it’s rising.
So everything the banks do is the opposite of what everyone else is doing.
When the price is falling, the banks take profits off buy positions or place buy trades. When price is rising, they take profits from sell positions or place sell trades.
Now here’s the important bit:
When the banks buy or sell, price moves in the opposite direction. This causes a wick to form on the bottom of a bearish candle if they buy, and one to form on the top of a bullish candle if they sell.
See where I’m going with this?
So to find out what the banks are up to, all you have to do is look at the wicks since they form as a result of them either buying or selling.
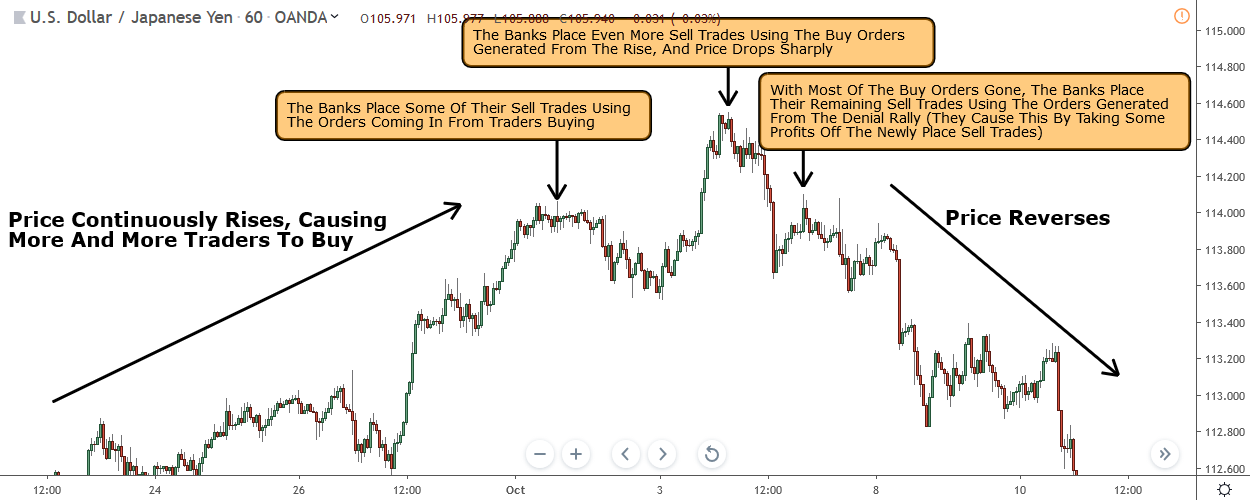
 Look at the top of this rise… see the wicks?
These wicks tell us the banks must be taking some sort of action in the market. Since they can only take profits off a buy position or place sell trades when price is rising, it must be one of those two.
We don’t know which it is, but in any case, price should soon stall or reverse.

And it does…
A few hours after the wicks appear price reverses and a large down move ensues.
So can you see how useful the wicks are?
In this case, they warned you of an impending drop. That gave you an early chance to take some profits off an open buy trade or, if you were looking for short entries, told you to start watching for sell signals.
It always best to look for multiple big wicks to form close to one another at similar prices. These usually indicate the banks are up to something so are a signal price will probably fall or rise.
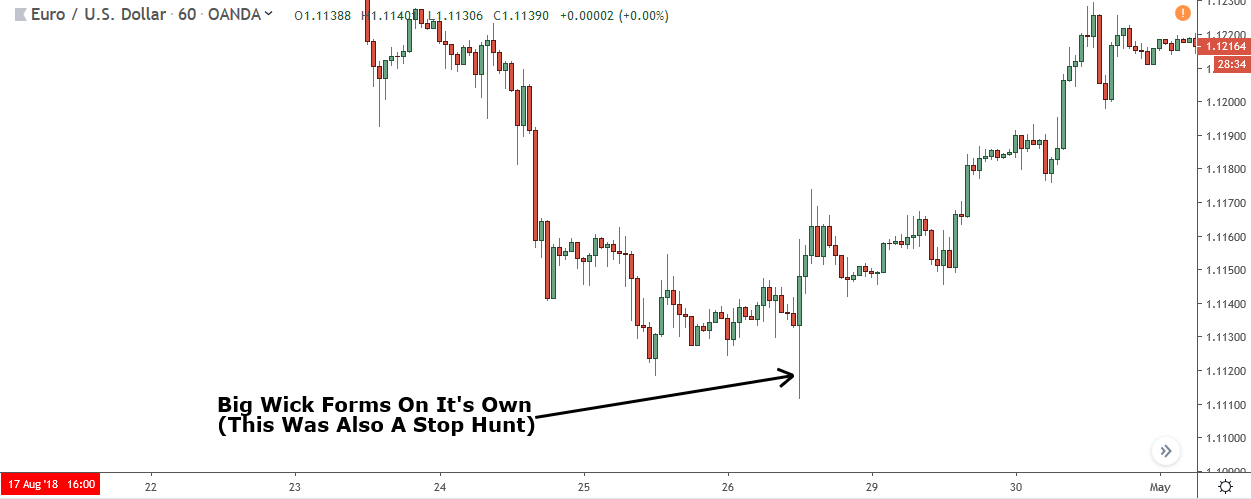
One or two wicks forming on their own usually doesn’t mean anything. However, if they’re really big like you see in the image above, it often means the banks have done something and that a large rise or decline is incoming.
4. Spot Big Reversals By Looking For Multiple Swings
What’s the best way to predict a reversal?
Support and resistance levels?
Fibonacci retracements?
Supply and demand zones?
Something else?
We have a huge number of tools at our disposal to gauge when a large reversal might begin. But one way not many people know is to look for multiple swing lows or highs to form at similar prices.

Look at the reversal above.

And now compare it with this one.
At first glance, these two reversals seem like they have nothing in common. They both form at different times, look nothing alike, and begin from different prices.
Look a little closer, though, and you’ll notice one similarity…
They both take place after multiple swings form from similar prices.
Each reversal started after multiple swing lows formed at similar prices; 4 in the case of the upper reversal, 5 for the above.
 Here’s another one.
This reversal initiated the huge uptrend on USD/JPY at the beginning of 2018.
Again, look at the lows… it’s the same pattern.
Multiple lows – 5 in this case – formed and did so at similar prices. Four formed around 100.000 and one formed at 100.500 – also note how they formed at big round numbers (more on this in a min).
So, why does this happen?
Why do multiple swing lows or highs form at similar prices before large reversals begin?
The answer is in how the banks place their trades.
As I said earlier, the banks can only buy or sell when other traders are doing the opposite.
Because of their size, the banks rarely have enough traders buying or selling to place an entire trade at a single price. Instead, they have to split it into smaller ones, and place them when enough numbers of traders are buying or selling.
This results in multiple swing lows or swing highs at similar prices.
They form at similar prices as the banks try to place each trade at the same price, to mimic the effect of having one trade placed at a single price.

If we look at the example again, it becomes clear how each swing high is a separate trade.
This pattern of multiple lows or highs prior to a big reversal happens on all time frames and all currency pairs.
It doesn’t always look the same as the examples above, but it will always consist of two or more highs or lows appearing at similar prices to one another.
5. Trend Reversals Usually Begin Near BRN’s
Predicting a trend reversal usually means placing one or more technical levels on a chart, waiting for price to reach them, then hoping it reverses and turns into a trend. This a good method, and it works well.
But it’s not the only way to anticipate where a trend reversal will begin.
You can also use Big Round Numbers.
Any price that ends in 500, 000 or 0000 is classed as a big round number or BRN for short.
BRNs hold much significance in forex because of something called the order clustering effect.
This phenomenon, which occurs in most markets, is where people tend to place orders around big round numbers rather than other prices.
It happens partly because people are biased into thinking the numbers are better than others (due to being bigger) but also because humans are hard-wired to always look for order – a big round number like 1.12500 is much more orderly than something like 1.12452 for example.
Now, the reason so many trend reversals begin near big round numbers is because of how the banks, who cause the reversal, get their trades placed.
The banks never have enough people buying or selling to get their trades placed all in one go. They have to split them into smaller trades, then place them at different prices when they have enough orders available – just like I explained in the previous section.
As a result, they always try to push price to levels where they know a lot of orders have built up. That way, they can use them to place more trades at better prices.
And where do thousands of orders build up?
At big round numbers!
The order-clustering effect causes a mass of orders to accumulate on and around big round number prices.
By pushing price to these numbers, the banks give themselves a huge quantity of orders to use to place their trades at better prices.
This is clear in the reversal below.

All the major swing highs, which form from the banks placing trades, in this reversal originated near big round numbers, which tell us the banks deliberately pushed price to these levels to make it easier to place their trades.
It’s not only trend reversals that begin near big round numbers, many normal reversals do too.

Pretty cool, huh?
Note: Learn why big round numbers make great support and resistance levels.
6. The Best Supply And Demand Zones Form After Long Rises And Declines
According to Sam Seiden, the guy who created S & D trading, the best supply and demand zones form after price moves strongly away from a level.
But, as any trader knows, this is rarely true:
Zones with strong moves away fail all the time. Much more so than can be chalked up to luck.
The reality is the best supply and demand zones are not found at levels where strong moves away have happened, but after long rises or declines in price.
To understand why, we need to talk about how reversals occur.
All reversals begin from the banks either placing trades to make money or from taking profits off open trades.
To cause a reversal, the banks must gobble up all the buy orders currently available. The bigger the supply of buy orders and the larger the number of traders buying, the more they must buy in order to force the price to reverse.
But here’s the thing:
The concept of trend teaches us the longer price moves in one direction, the greater the likelihood it will continue in the same direction. Coincidentally, of course, the longer price moves in one direction, the more people will enter trades because they think it’ll continue in the same direction.
And this explains why zones that form after long rises and declines are stronger.
If price reverses after rising for a long time, the banks must have placed big sel trades, as a large number of people would’ve been buying due to the length of the rise.
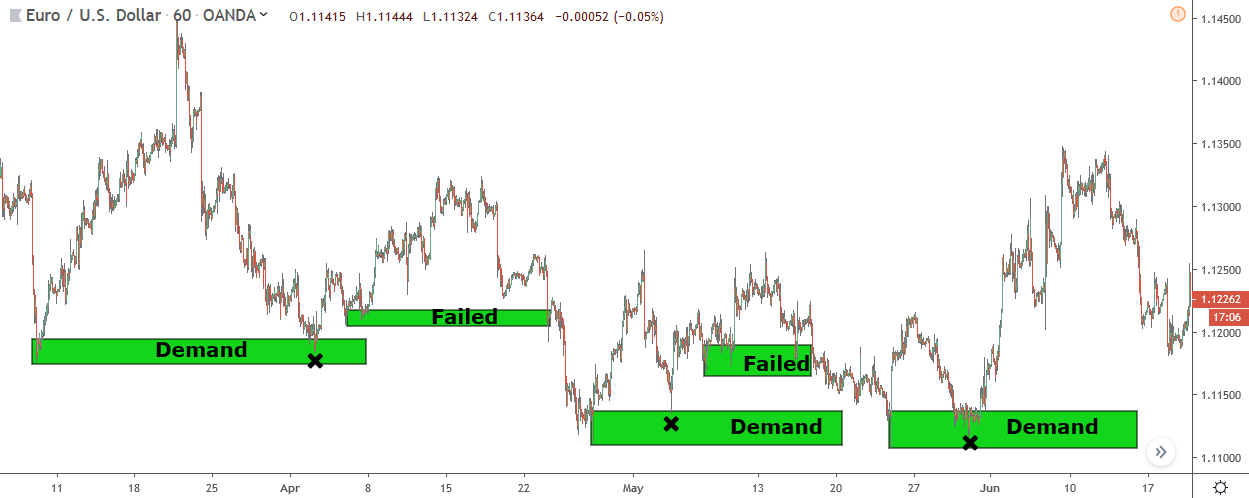 If I mark some zones on a chart, you can see this is almost always true.
Most of the demand zones that worked were preceded by long declines. The ones that didn’t came after a short rise, times when very few people were selling.
7. You Can Predict Stop Hunts
Have you ever had a stop taken out by a spike?
If you have, you’re not alone.
Stop hunting is a major problem in forex, being used by the market makers as a way to make money from commissions, and the banks to get trades placed at favorable prices.
As annoying as they are, it is possible to turn the tables and anticipate where a stop hunt will begin by using a simple tool:
The order book.
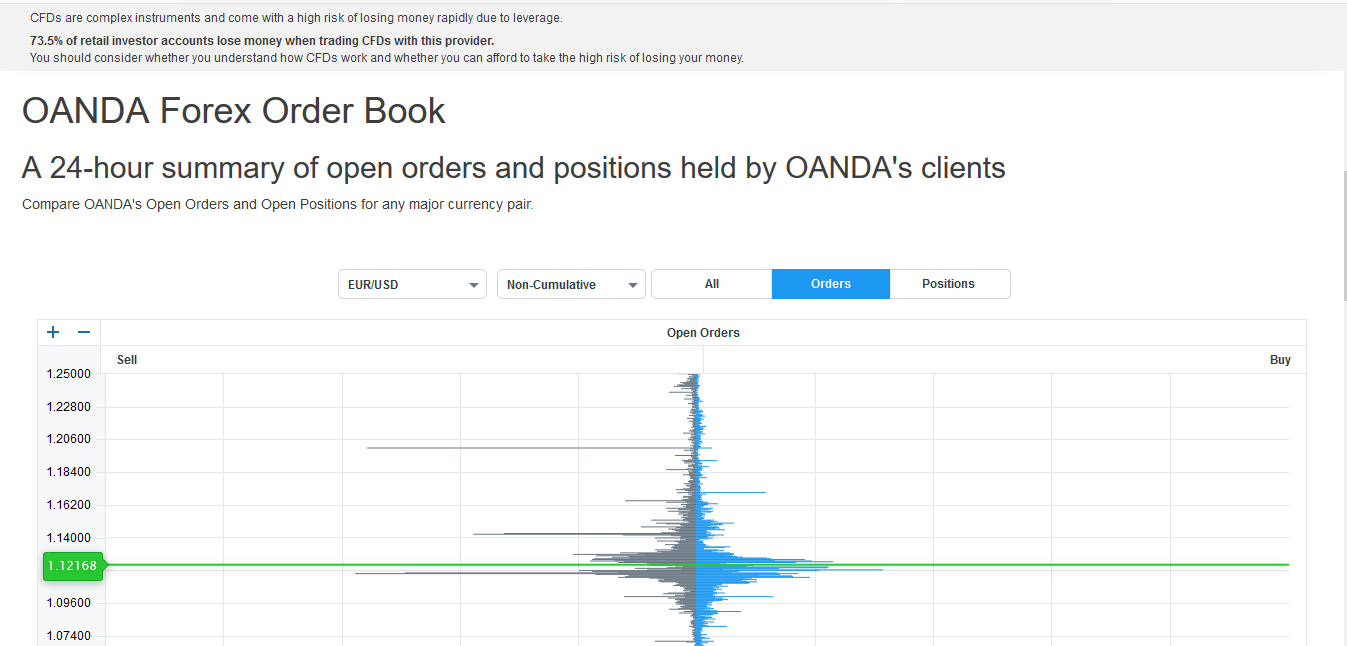
A free tool provided by Oanda, the order book shows all open orders of the traders and investors using Oanda. It updates in near real time (every 15 min) and displays the orders as black and blue bars seen through a small graph.
Because the order book shows where traders have placed orders, we can use it to figure out where and when a stop hunt could happen.
Here’s how to do it:
First, you need to identify which orders are stops, because the order book doesn’t label them; it simply categorizes them as buy or sell.
This sounds difficult, but it’s actually really easy.
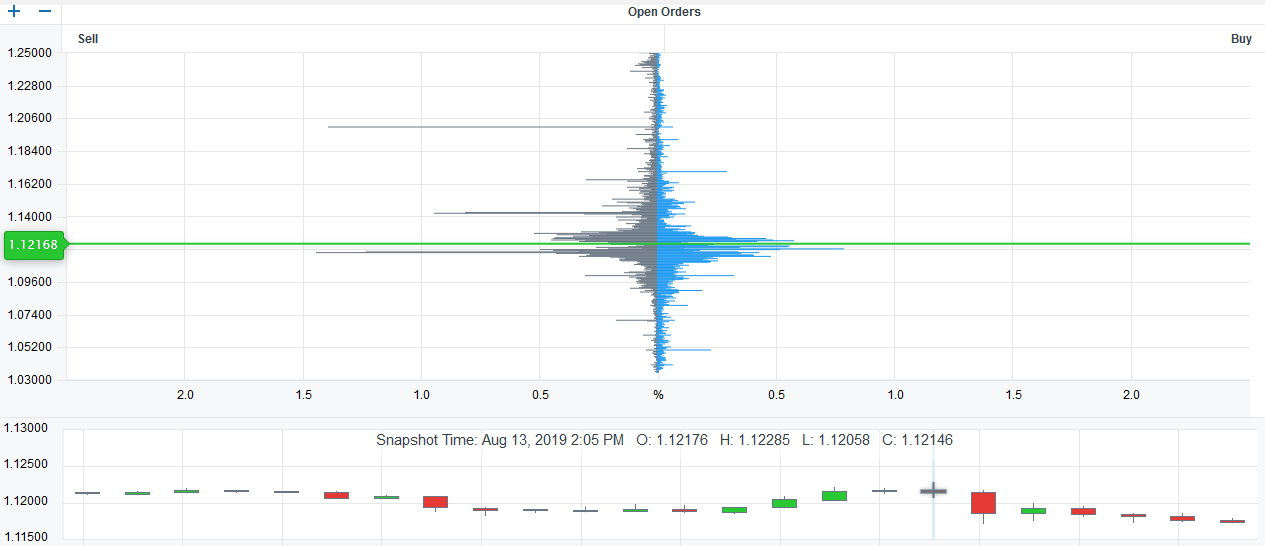
The order book is split into 2 sections – buy and sell – and is divided by a green line representing current price.
The sell orders above the green line are mainly sell-stop orders from open sell trades. The buy orders below the green line are mostly buy-stop orders placed in open buy trades.
So to find a stop hunt, just look at the bars in these two sections.
If several thousand stops, which are shown by a big bar, have built up at a particular price, you know a stop hunt is likely and can take the necessary action.
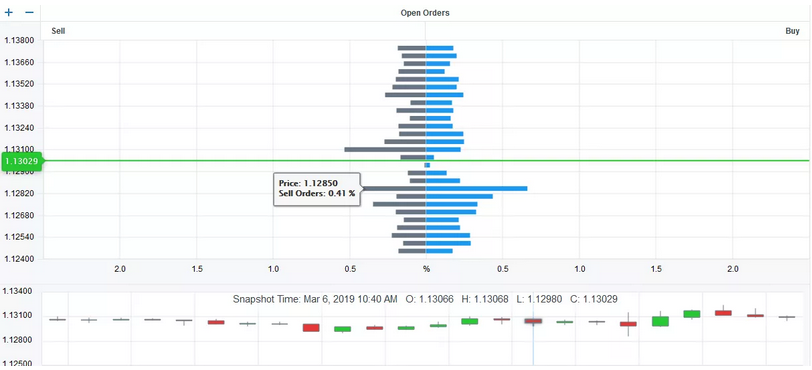
Above you can see a lot of sell stops have gathered around 12.2850.
The fact these stops have built up here tells us a stop hunt to 12.220 could soon take place.
And it does…
A few hours later, a big spike pushes price to 34.944, takes out all the stops (more had built up in the hours after), and then reverses.
Normally, this would have stopped you out of a trade. But with the help of the order book, you miss it completely.
It’s a good idea to check the order book every few hours or so, to get a sense of where stops and other orders have built up. Usually, a reversal will only happen if a big bunch of orders have built up at a single price, but you’ll sometimes get one when a collection have accumulated at similar prices, shown by small bars.
The order book is great for avoiding stop hunts, but you can also use it to enter trades.
I haven’t got enough time to explain it here, however you can learn more about it in my member’s post.
Summary
Well, there you have it… 7 price action secrets the banks don’t want you to know.
I know it’s not easy to get your head around some of the secrets listed here (they are secrets after all) but if you spend some time going over what I explained, understanding the theory behind them and looking back through some examples, you should get a grasp on how and why they work, and be able to use them in your trading.