Imagine trying to predict the market’s next move back in the 18th century… no fancy computers, no real-time data.
How did those old-school traders do it?
Enter the humble candlestick pattern.
These simple formations, like the Hammer, Shooting Star, and Doji, give us a peek into the minds of traders, offering clues about where the price might be headed. But let’s face it, there are a ton of patterns out there. Remembering them all can feel like an impossible task.
Well, not anymore!
Introducing: Your Candlestick Cheat Sheet
I’ve created a handy guide that covers the most crucial patterns you need to know: pin bars, engulfing candles, inside bars, and even those rare but powerful ones like the Morning Star and Evening Star.
We’ll break down each pattern, explain what it means, and show you how to use it to your advantage.
Overview Of Candlestick Patterns
Candlestick patterns – when one to three candlesticks line up in a specific sequence – can offer valuable insights into the underlying psychology of traders in the market.
Remember, every pattern forms as traders buy and sell based on their future market predictions. These candlesticks serve as a window into the market mindset, which you can leverage to anticipate upcoming price movements.
Keen on acing Forex?
Learning the most common candlestick patterns can give you a significant edge.
The predictive power of these patterns not only deepens your grasp of the market but also clues you in on the behind-the-scenes thinking of traders. This knowledge can sharpen your predictions about upcoming price shifts, helping you seize the advantage.
Many of these patterns can also act as confirmation signals when paired with other technical trading strategies.
For instance:
Bullish Engulfing candlesticks are a clear signal bulls have outpowered the bears – a potential sign of a market reversal. Seen at a demand zone, it’s a solid indication buyers are keen on reversing the current price direction, raising the chances of a reversal from that level.
Pretty neat, right?
Forex boasts around 32 distinct candlestick patterns.
But here’s the catch – you don’t need to master all of them to be successful.
In fact, keeping an eye on 12 patterns will do the trick – and of these, 7 are relatively rare.
These 12 key candlestick patterns fall into three separate categories based on the number of candles that make up the pattern: single candle, two-candle, and three-candle. Moreover, these patterns are further classified into three types, each hinting at possible price movements post-appearance.
Here’s a quick rundown of each category:
Reversal Patterns
Reversal candlestick patterns indicate price may soon reverse and change direction.
These patterns prove some of the most useful, often being used as confirmation signals for technical strategies, and come in both bullish and bearish varieties.
Notable patterns:
- Hammer/Pin Bars.
- Engulfing Candlesticks.
- Doji Candlesticks (Some Types).
Continuation Patterns
Continuation patterns signal a continuation – hence the name – of the prior movement or trend.
When they form, price has a high probability of continuing in the direction it was moving in before the pattern appeared. They’re most useful for getting into trending moves or adding to existing positions.
Notable Patterns:
- Inside Bar.
- Rising Three/Falling Three.
Indecision Patterns
The most common type of pattern… and the least useful.
Indecision patterns make up most candlesticks on our charts.
These patterns form when the bulls and bears battle it out but come to an impasse, resulting in neither side gaining control and causing an indecision candle to form.
Understanding these patterns, while not super important for analysis, can help determine when prices are in a period of indecision.
Notable Patterns:
- Doji Candlesticks.
- Spinning Top.
Single Candlestick Patterns
Single candlestick patterns are the most common type of pattern, making up most of the candlestick patterns we see on our charts. These patterns always consist of a single candle and can signal a reversal, continuation, or indecision between the bulls and bears.
Many of these patterns are used as entry signals in common technical strategies.
Over 13 different patterns exist, but here’s the 4 you need to keep your eye on.
Hammers/Pin Bars
Perhaps the most famous candlestick pattern of them all, Hammer candlesticks – or Pin Bars, as they’re better known by today’s traders – are one of the highest probability candlestick reversal signals that appear in the Forex market.
They come in 4 variations, each of which indicates a different reversal based on where and when they form.
- Shooting Star/Bearish Pin Bar.
- Hammer/Bullish Pin Bar.
- Inverted Hammer.
- Hanging Man.
Let’s go over each pattern…
Shooting Star Candlesticks
Shooting Stars – they’re not just wonders in the sky!
In trading, they’re potent bearish reversal patterns that tend to appear during uptrends or bullish swings.
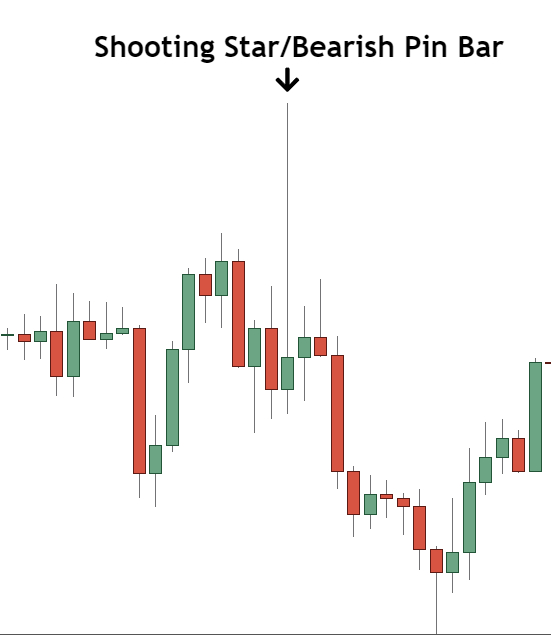
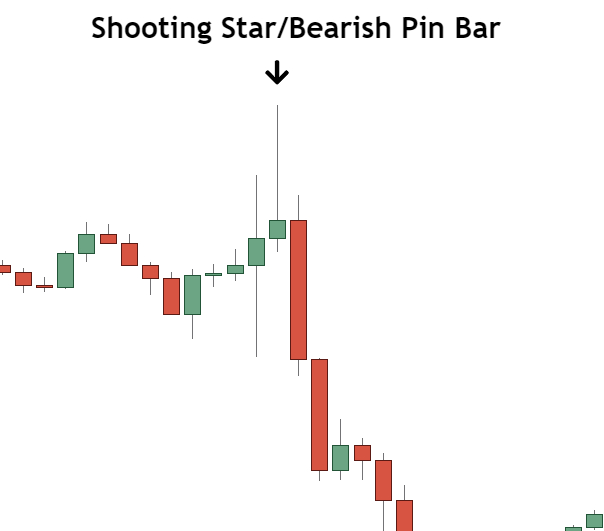
These patterns stand out with a distinctive long upper shadow (or wick, or tail, if you prefer). They form when the banks sell into a wave of heavy buying. This triggers a signifcant price decline, taking it back to the open. A Shooting Star hints at a faltering upward push and could signal an imminent reversal.
You could trade Shooting Stars solo, but they truly shine when used as entry signals in combination with typical price action hotspots:
- Supply and Resistance Levels,
- Supply and Demand Zones,
- Trendlines.
One key point to remember: While many textbooks attribute Shooting Stars to selling activity (which is correct), the real culprits behind this selling are the banks, not your average traders. These patterns often form when banks take profits, but they can also be created by banks entering reversal trades.
Want a deep dive into this?
Grab my book, “Pin Bars Revealed“, for a breakdown.
Key Characteristics:
- Appearance: A Shooting Star candlestick appears as a single candlestick with a small real body (the part between the open and close prices) at the lower end of the trading range, a long upper shadow (the line or “wick” above the body), and little to no lower shadow (the line below the body).
- Color of the Body: The body of the Shooting Star can be either color, but a red (or black) body (indicating that the close was lower than the open) is generally considered to be more bearish than a green (or white) body.
- Upper Shadow: The upper shadow of a Shooting Star should be at least twice as long as the body. This long upper shadow represents a period during which buyers were able to push the price up, but banks eventually took control and drove the price back down.
- Little to No Lower Shadow: The Shooting Star should have little to no lower shadow. If there’s a long lower shadow, it’s not a Shooting Star.
Trading Considerations:
- Context: The Shooting Star pattern is significant when it occurs after an uptrend or at a resistance level/supply zone, indicating a potential bearish reversal. It is not significant if it occurs during a downtrend.
- Confirmation: Confirmation of the pattern is important. Traders typically look for the next candle or set of candles to confirm the reversal. Confirmation could be a long bearish candle following the Shooting Star.
- Volume: While not a mandatory requirement, increased volume on the period the Shooting Star forms can add to the validity of the bearish signal. This increased volume represents a greater level of selling activity.
Hammer Candlesticks
The bullish twin of Shooting Star patterns, Hammer candlesticks (also called bullish Pin Bars) are a bullish reversal pattern that forms during downtrends/downmoves.
Here’s how they look…
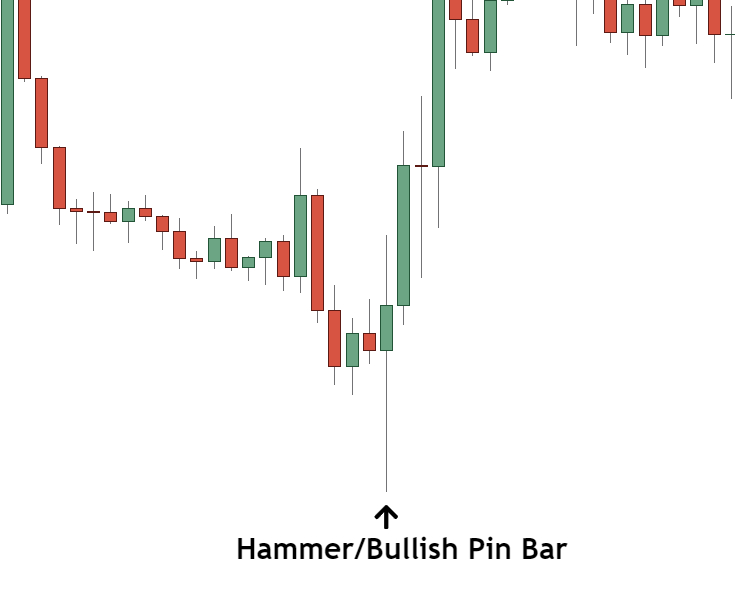
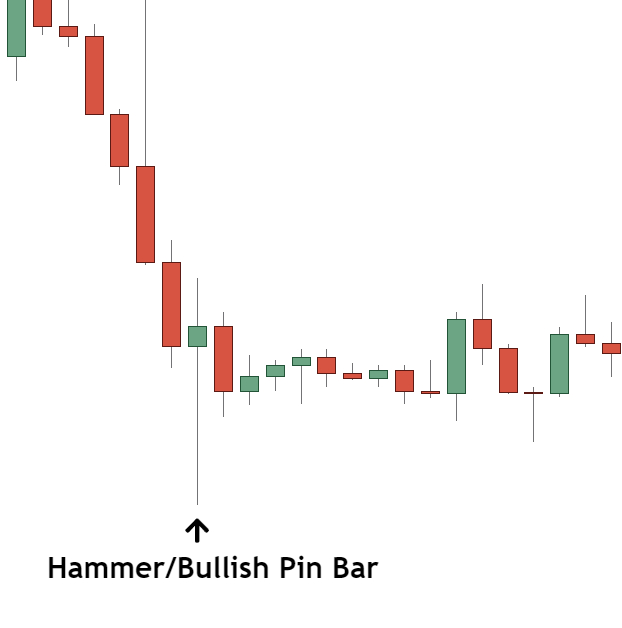
Hammer candlesticks form the opposite way to shooting star patterns: banks enter massive buy trades amid heavy selling, creating a long lower shadow. This long shadow is a tell-tale sign banks want price to rise, signaling a wobble in the downtrend and a possible reversal.
Hammers are a great entry signal into bullish reversal trades.
Pair them up with these key points:
- Supply and Resistance Levels,
- Supply and Demand Zones,
- Trendlines.
Key characteristics:
- Appearance: The Hammer candlestick has a small real body at the upper end of the trading range, with a long lower shadow and little to no upper shadow. The body can be either color, red indicating the close was lower than the open, or green indicating the close was higher than the open. Regardless, the close and the open are relatively close together.
- Long Lower Shadow: The lower shadow (the line or “wick” below the body of the candle) should be at least twice the length of the real body. This shadow represents a period during which sellers were able to push the price down, but an influx of buyers drove the price back up by the end of the period.
- Little to No Upper Shadow: The Hammer should have little to no upper shadow (the line or “wick” above the body of the candle). If there’s a long upper shadow, it’s not a Hammer.
- Small Body: The body (the part of the candle between the open and close prices) of the Hammer should be relatively small, indicating a small range between the open and close prices. The color of the body isn’t as important, but a green body is generally more bullish than a red body.
Trading Considerations:
- Context: The Hammer pattern is significant when it occurs after a downtrend or at a support level/demand zones, indicating a potential bullish reversal. It is not significant if it occurs in an uptrend.
- Confirmation: While the Hammer itself can be a bullish signal, traders typically look for confirmation on the next candle or set of candles. Confirmation could be a long bullish candle or any bullish candle that breaks the open the Hammer.
- Volume: While not always a requirement, increased volume on the day the Hammer forms can add to the validity of the bullish signal. It shows that the push up in price was backed by a strong demand by the banks and other big players.
Hanging Man/Inverted Hammer Candlesticks
Inverted Hammers and the Hanging Man patterns are also great reversal signals, though they don’t perform as well as Shooting Stars and standard Hammers.
Key Characteristics:
- Shape: Both the Hanging Man and Inverted Hammer candlesticks have small bodies, long lower wicks (for Hanging Man) or upper wicks (for Inverted Hammer), and little or no wick at the opposite end. The long wick is typically at least twice the length of the body.
- Color: The color of the body can be either bullish (green or white) or bearish (red or black), but traditionally, a bullish body for an Inverted Hammer and a bearish body for a Hanging Man are seen as more reliable.
- Preceding Trend: The Hanging Man candlestick appears after an uptrend and is seen as a potential bearish reversal signal, meaning that prices might start to fall. The Inverted Hammer, on the other hand, appears after a downtrend and can signal a bullish reversal, indicating that prices might start to rise.
- Confirmation: For these patterns to be considered valid, they usually need confirmation from the next candlestick. For a Hanging Man, the next candlestick should close lower. For an Inverted Hammer, the next candlestick should close higher.
- Psychology Behind the Patterns: The Hanging Man represents a situation where the market opens, sellers push the prices down significantly, but buyers manage to push the prices back up to near where they started, suggesting a potential exhaustion of the buying pressure. The Inverted Hammer represents a situation where the market opens, buyers push the price up significantly, but sellers manage to bring the price back down to near where it opened, indicating possible exhaustion of the selling pressure.
Doji Candlesticks
Doji’s are a special family of candlesticks (4 in total) that form when a candle closes almost exactly at the open, leaving little-to-no real body – much like a cross.
The candles appear similar to Spinning Tops, in that they show the bulls and bears are engaged in heavy battle, with neither side able to gain the decisive edge over the other.
The Long-legged Doji is the most common type.
The pattern signals indecision and can form anywhere during a price move (uptrend/downtrend). The doji can be easily identified by its almost equal-sized wicks, and it’s open and close being almost dead center in the middle of the candle.
The other 3 dojis all signal reversals, they are:
You’ll typically find the doji candlesticks near the ends of trends, as they indicate exhaustion on the part of the bulls or bears. Make sure to combine them with other technical points – e.g Support and Resistance Levels, Supply and Demand Zones – to confirm a reversal has a high probability of beginning.
Key Characteristics:
- Appearance: The primary characteristic of a Doji candlestick is its thin line appearance, representing a similar or equal open and close price. The line might have shadows extending above and below, indicating the high and low prices during that period.
- Open & Close: In a perfect Doji, the open and close prices for the period are identical. However, some traders consider Near-Doji where the open and close are very close, but not identical.
- Types: There are several types of Doji. The basic Doji has equal upper and lower shadows. Long-legged Doji have extended shadows, indicating significant volatility while the market settled at the open price. Dragonfly Doji have long lower shadows and no upper shadow, indicating a bullish reversal. Gravestone Doji have long upper shadows and no lower shadow, indicating a bearish reversal.
Trading Considerations:
- Confirmation: Doji are typically used in combination with other technical analysis tools. Many traders look for confirmation in the next period or candlestick. For example, after a Doji in a downtrend, if the next candlestick closes higher, it can confirm a bullish reversal.
- Market Context: Doji candles are significant when seen in the context of a preceding price trend since they can signal a potential reversal. For example, a Doji after a long bullish trend might suggest the bullish momentum is losing strength and a bearish reversal might be near.
- Indecision: A Doji represents indecision in the market. During the period of the Doji, neither buyers nor sellers could gain control, and the result was essentially a draw.
- Volume: Like other candlestick patterns, the Doji can be confirmed with high volume. This suggests that the indecision in the market has significant participation and may lead to a potential reversal.
Spinning Top
The Spinning Top – a common candlestick that signals a tug-of-war between the bulls and the bears.
This candle gets its name from its uncanny resemblance to a Spinning Top.
The candle contains a small body sandwiched between upper and lower wicks of similar lengths – that’s the classic look. But don’t get thrown off if the wicks aren’t always equal or if the body isn’t in the middle of the candle.
It’s still a Spinning Top, regardless.
What’s the Spinning Top reveal to us?
It’s saying, “I’m undecided.”
The Spinning Top doesn’t reveal too much about the market, except for the fact the bulls and bears were locked in a fiery duel, only to end in a deadlock with no clear victor.
Key Characteristics:
- Small Real Body: A Spinning Top candlestick has a small real body, which means the opening and closing prices are close together. The color of the body (which can be either red or green, depending on the specific charting style) isn’t particularly important for this pattern.
- Long Shadows: This candlestick pattern has long upper and lower shadows, also known as “wicks” or “tails”. These shadows represent a large trading range during the period, but because the open and close are close together, it’s clear that neither buyers nor sellers could gain the upper hand.
- Indecision: The small real body situated between long shadows represents market indecision. Both the bulls and the bears were active, but neither could secure a victory, resulting in a standoff.
Trading Considerations:
- Context: The Spinning Top is a neutral pattern by itself. It doesn’t necessarily indicate a reversal or continuation of the current trend, but rather a pause in the current trend. Its importance and interpretation can vary greatly depending on its location within a larger price trend or chart pattern. For instance, it may precede reversals when observed near levels of support/resistance, or during overbought/oversold market conditions.
- Confirmation: While the Spinning Top can suggest potential future reversals, traders usually wait for further confirmation from additional candlesticks or indicators. For instance, the appearance of a bearish candle after a Spinning Top in an uptrend might be seen as a confirmation of a potential reversal.
- Volume: The volume during the formation of the Spinning Top can provide extra information. Lower volume might suggest less conviction in the market’s indecision, while higher volume might indicate a stronger struggle between buyers and sellers.
Two Candle Candlestick Patterns
Some of the most famous candlesticks patterns are made up of two candlesticks.
These patterns can signal either a reversal or a continuation – no indecision patterns, like with single candlesticks. Given they take two candles to form, they tend to be rarer than their single candle counterparts, but still form frequently enough to warrant watching.
Here’s the 4 you need to keep you eye out for:
Bullish Engulfing And Bearish Engulfing
These next two patterns need no introduction.
Bullish and Bearish Engulfs are two of the most well-known reversal patterns in Forex, providing entry confirmation signals in a whole host of technical trading strategies.
Bullish Engulfing patterns usually appear near the end of down moves, indicating either a reversal or retracement. The pattern shows the banks have entered large buy positions, causing the prior bearish candle to get engulfed by a larger bull candle.
Key Characteristics:
- Prior Trend: For a Bullish Engulfing pattern to be valid, it must occur after a downtrend. The existence of a prior downtrend is important in making sure the pattern has reversal implications.
- Two-Candle Pattern: The Bullish Engulfing pattern is formed of two candlesticks: the first one is bearish (red or black) and the second one is bullish (green or white).
- Small First Body: The first candlestick should have a relatively small body that signifies a period of indecision or consolidation with a small move down.
- Engulfing Second Body: The second candlestick must be green, indicating that it was a period during which buyers outweighed sellers. Its real body engulfs the smaller, red real body of the candlestick from the period before.
- Second Body at Lower Levels: The second candle opens at a level lower than the first candle’s close, but closes above the first candle’s open. This gives the pattern its ‘engulfing’ nature.
Trading Considerations:
- Higher Volume: The second candle often has a higher volume than the first one, which demonstrates the strength of the buyers.
- Confirmation: Traders usually wait for further confirmation before acting on a Bullish Engulfing pattern. This could be in the form of another bullish candle following the pattern.
The ‘brother’ of Bullish Engulfs, Bearish Engulfing Patterns typically appear towards the end of up-moves and signals a reversal/retracement could be on hand.
The pattern forms when a bearish candle overwhelms a smaller bull candle, showing the banks have entered signifcant sell postions and want price to move lower. The size of the engulf usually correlates to the size of the sell positions entered by the banks.
Key Characteristics:
- Preceding Uptrend: This pattern should occur during an uptrend or at the top of a pullback within a larger downtrend. If it happens during a downtrend, it may not be a reliable bearish signal.
- Two-Candle Pattern: The Bearish Engulfing Pattern consists of two candles. The first one is bullish (green or white), and the second one is bearish (red or black).
- Smaller Bullish Candle: The first candle of this pattern is a smaller bullish candle, indicating buying pressure.
- Larger Bearish Candle: The second candle is a larger bearish candle that ‘engulfs’ the body of the first candle, meaning it opens at a price higher than the close of the first candle and closes lower than the opening of the first candle.
- Significant Size Difference: The size difference between the two candles is significant. The larger the second candle (compared to the first), the stronger the bearish signal.
Trading Considerations:
- Confirmation: While the pattern itself can be a bearish signal, traders typically look for confirmation on the next candle or set of candles. Confirmation could be another bearish candle, a gap down in price, or a drop below the pattern.
- Volume: Increased volume on the day the Bearish Engulfing Pattern forms can add to the validity of the bearish signal. This shows that the push down in price was backed by a strong selling pressure.
- Potential Resistance Zone: A Bearish Engulfing Pattern is even more significant if it forms at a key resistance or Fibonacci Retracement Level, after a prolonged price advance or near overbought levels (based on oscillator indicators).
Tweezer Tops And Tweezer Bottoms
Tweezer Tops and Bottoms are one of the most common two-candle patterns you’ll see form in the Forex market.
Comprised of two candles – one bullish and one bearish – these patterns usually appear at the end of trending movements and suggest a reversal of the previous trend – though in some cases, this turns out to just be a retracement.
Tweezer Tops are the bearish variation of the pattern. They only form at the end of up-trending movements, signalling a possible reversal to the downside.
The first candle in this pattern, which is usually (but not always) the last bull candle in the trending move, is always bullish with the second being bearish.
Key Characteristics:
- Prior Uptrend: The Tweezer Tops pattern is meaningful after an established uptrend. It suggests the potential exhaustion of the bullish momentum and the start of a bearish reversal.
- Two Consecutive Candlesticks: The pattern consists of two consecutive candlesticks that have the same or nearly the same high. The two candles can be any combination of bullish (green) and bearish (red) candles.
- Equal Highs: The defining characteristic of this pattern is the equal (or nearly equal) highs of the two candlesticks. This suggests that buyers attempted to continue the uptrend but were unable to push the price beyond the high of the previous day.
Trading Considerations:
- Rejection of Higher Prices: The pattern indicates the market rejected higher prices. When the second candle fails to close above the high of the first candle, it’s a signal buyers may be losing control.
- Confirmation: The pattern is confirmed when price falls below the lows of the two candles, indicating sellers have taken control. Some traders may look for additional confirmation from other technical indicators or a lower close on the following day.
- Volume: While not necessary, an increase in volume during the formation of the Tweezer Tops can strengthen the bearish reversal signal.
Switching over, we have Tweezer Bottoms…
These are bullish patterns that typically form at the end of down-trending movements, indicating a reversal to the upside.
Tweezer Bottoms are essentially Tweezer Tops but flipped the other way around.
Key Characteristics:
- Formation: The Tweezer Bottom pattern is a two-candlestick pattern. The first candle is a strong bearish candle (red), and the second is a strong bullish candle (green), representing a shift in control from sellers to buyers.
- Matching Lows: Both candles of the Tweezer Bottom have the same (or nearly the same) low point. This matching low point is the defining characteristic of the pattern, hence the name “Tweezer.”
- Preceding Trend: The Tweezer Bottom pattern occurs after a downtrend. It is a bullish reversal pattern, so it is significant only when it appears at the end of a downtrend.
- Variation in Body Size and Color: The size and color of the candle bodies in the Tweezer Bottom pattern can vary. The first candlestick can be long or short and is typically colored to reflect a bearish close (red). The second candlestick is typically colored to reflect a bullish close (green) and can be a variety of sizes, though a longer body suggests stronger buying pressure.
Trading Considerations:
- Confirmation: The pattern is confirmed by price moving above the high of the second candle. A break above this high point indicates that the upward reversal is likely to continue.
- Volume: While not always a requirement, increased volume on the second candle can add to the validity of the bullish reversal signal.
- Shadow/Wick: The shadow or wick of the second candlestick in a Tweezer Bottom pattern can vary, but a shorter upper shadow (or none at all) can add to the bullish reversal signal because it suggests that buyers were able to keep price close to the high of the period.
Three-Candle Candlestick Patterns
Three-candle patterns are some of the rarest but also most powerful in the market. They’re made up of three candles that form one after the other, signalling either a continuation or reversal of the current move. Due to their rarity, only a couple appear often enough to be worth watching for.
Here’s what they are:
Three White Soldiers And Three Black Crows
First, we have Three White Soldiers and Three Black Crows.
Much more common in stocks than forex, the Three White Soliders and Three Black Crows patterns provide high probability signals price could soon reverse its current direction.
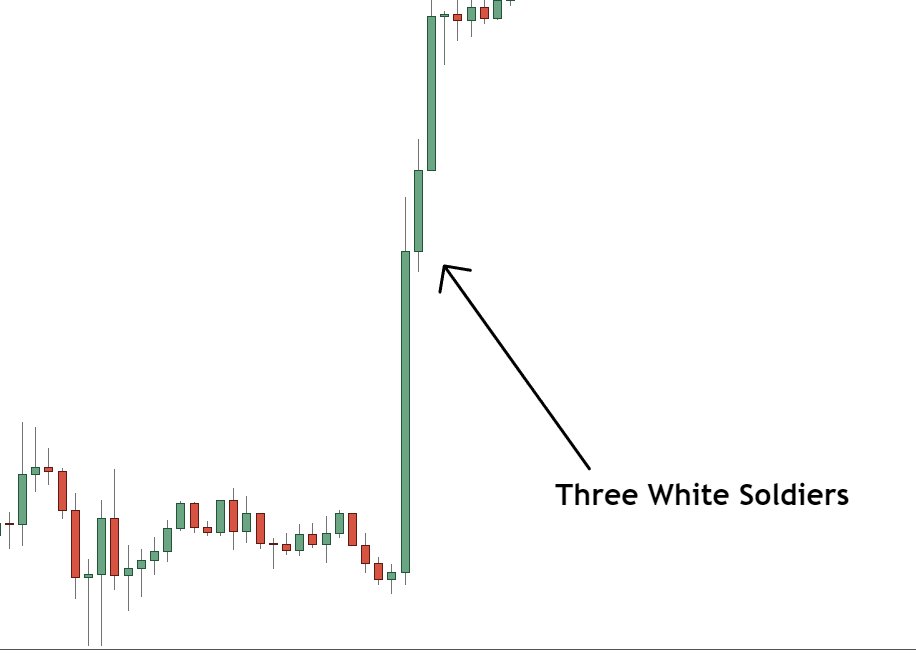
Three White Soldiers is the bullish variant of the pattern; you’ll find this forming at the end of downtrends.
The pattern consists of three bullish candles, all which form different sizes.
The first candle normally appears the smallest, as it forms after significant selling pressure. The second candle forms roughly double the size, and pushes price back into the prior down move. The third candle is the biggest and shows the bulls have overwhelmed the bears, resulting in a reversal.
Key Characteristics:
- Appearance: The pattern consists of three long-bodied candlesticks that have closed progressively higher on each subsequent day. All three should be substantial bullish candles, with little to no lower shadows (wicks).
- Candle Color: All three candles in the pattern are bullish (green), indicating the close was higher than the open for each.
- Sequential Growth: Each of the three candles closes higher than the previous one, indicating continuous bullish sentiment in the market.
- Size of Bodies: The bodies of the three candles should be approximately the same size. If the second or third candles are significantly smaller, it might suggest less conviction among buyers.
- Open Prices: Each candle’s open is within the body of the previous candle. Ideally, the open of each candle should be in the upper half of the previous day’s body.
Trading Considerations:
- Preceding Trend: For the Three White Soldiers pattern to be valid, it should appear after a pronounced downtrend. If it appears during an uptrend, it’s not a true Three White Soldiers pattern and might not have the same bullish implications.
- Volume: Ideally, volume should increase with each successive candle, indicating growing bullish conviction. However, this is not a strict requirement.
- Confirmation: Traders typically wait for additional confirmation before acting on the Three White Soldiers pattern. This confirmation might come from another bullish candle following the pattern, a gap up in price, or confirmation from another technical indicator.
On the other hand, we have the Three Black Crows pattern.
This is the opposite of the Three White Soldiers; it only forms near the end of up-trends and is made up of 3 bearish candles. The pattern indicates a reversal to the downside, with its three candles being a sign the bears have overridden the bulls and gained control of price.
Key Characteristics:
- Preceding Uptrend: The pattern typically appears after a strong uptrend. The trend preceding the formation of the Three Black Crows suggests market sentiment may be starting to shift from a bullish to a bearish outlook.
- Three Bearish Candles: The pattern consists of three bearish candlesticks, hence the name ‘Three Black Crows’. Each of these candles opens within the previous candle’s real body and closes lower than it, indicating a sustained period of selling pressure.
- Equal Size: Ideally, the three candles should be roughly the same size, indicating steady and persistent selling pressure.
- Candle Shape: Each of the three candles should be long and bearish, with little to no upper or lower shadows. This shows that sellers controlled the price action from open to close.
- Closing Prices: Each of the three candles should close near or at their lows, indicating that the sellers were able to push the price down significantly and maintain control until the market closed.
Trading Considerations:
- Volume: The pattern is considered more significant if it’s accompanied by high volume during the three days of its formation. This suggests strong selling activity and reinforces the bearish reversal.
- Confirmation: Traders typically wait for further confirmation after the appearance of the Three Black Crows pattern. This confirmation may come as a gap down or long red candlestick on the following periods.
- Reliability: The Three Black Crows pattern is a relatively reliable indication of a bearish reversal, but, like all technical patterns, it is not foolproof and should be used in conjunction with other technical analysis tools.
Inside Bar
The Inside Bar – one of the few continuation patterns on this list.
The Inside Bar forms when a handful of candlesticks (typically 3 or 4) are huddled within the span of one all-encompassing candlestick, affectionately known as the ‘mother bar’.
The Inside Bar can indicate both a continuation and reversal, with its signal hinging on where it decides to form.
Most often, the Inside Bar signals a continuation of the preceding trend or movement. But see it at significant technical level – say, a support or resistance level, or a supply and demand zone – and it transforms into a reversal signal.
Key Characteristics:
- Two-Bar Pattern: The Inside Bar pattern consists of two or more candlesticks. The second bar or candle is the “Inside Bar”.
- Position of the Inside Bar: The Inside Bar is completely contained within the high and low range of the preceding bar. In other words, the high of the Inside Bar is lower than the high of the preceding bar, and the low of the Inside Bar is higher than the low of the preceding bar.
- Indication of Market Pause: The Inside Bar indicates a period of consolidation. After a strong move in one direction, an Inside Bar suggests that the market is taking a pause. It can also represent indecision in the market.
- Multiple Inside Bars: Sometimes, multiple Inside Bars form within the range of the same mother bar. This can indicate an even stronger signal when the price finally breaks the range of the mother bar.
Trading Considerations:
- Breakout Confirmation: A breakout from the range of the mother bar (the bar before the Inside Bar) is used to confirm the signal. If the price breaks above the high of the mother bar, traders take it as a bullish signal. Conversely, if the price breaks below the low of the mother bar, it’s taken as a bearish signal.
- Potential for Continuation or Reversal: Inside Bars can signal both trend continuations and reversals. For instance, if an Inside Bar pattern forms during a strong uptrend, it might signal a continuation of the uptrend. If an inside bar forms after a prolonged downtrend, it might signal a potential reversal of the trend.
- Trading Volume: Usually, the Inside Bar is accompanied by lower volume. This represents the consolidation and indecision in the market.
- Market Context: Like any candlestick pattern, Inside Bars should not be used in isolation. The surrounding market context is important in determining whether to act on an inside bar signal.
Morning Star And Evening Star
One of the few three-bar reversal patterns, the Morning Star and Evening Star are strong signals price may be about to reverse and move in the opposite direction.
The Evening Star is the bearish variant that only appears at the end of uptrends and indicates a reversal lower.
The pattern forms when price makes a quick move higher but stalls at a high.
Sometimes a Doji will show price has stalled, but usually it’ll be some kind of indecision candle.
Price will then proceed to fall almost the entire length of the bull candle, creating the pattern.
Key Characteristics:
- Three Candle Pattern: The Evening Star is a three-candle pattern. The first candle is a large bullish candle, the second is a smaller candle (either bullish or bearish) that gaps above the first one, and the third is a large bearish candle that closes within the body of the first candle.
- Uptrend Preceding: The pattern occurs after an uptrend or during a bullish market. This is important for the pattern to be considered a reversal pattern.
- First Candle: The first candle of an Evening Star pattern is a strong bullish candle. This represents the continuation of the preceding uptrend.
- Second Candle: The second candle is small and can be either bullish or bearish. It always closes only slightly above the close of the first candle, indicating a possible exhaustion of the upward momentum. In some variations, this candle can be a Doji (where opening and closing prices are virtually equal), representing indecision in the market.
- Third Candle: The third candle is a strong bearish candle. Ideally, it should gap down from the second candle and close well into the first candle’s body, indicating a potential reversal of the trend. The further this candle closes into the first candle’s body, the stronger the reversal signal.
Trading Considerations:
- Confirmation: As with all patterns, traders typically wait for confirmation of the pattern before acting. This could come in the form of further bearish price action following the completion of the pattern.
- Volume: Though not always a necessity, some traders consider an increase in volume during the formation of the third candle as additional confirmation of a valid Evening Star pattern.
The brother of the Evening Star is, of course, the Morning Star.
As you can probably tell, the Morning Star is a bullish pattern. Compared to the Evening Star, it only forms at the end of downtrends or down movements and indicates a reversal to the upside.
The pattern forms when price falls sharply but is met with significant buying pressure, resulting in either a Doji or Indecision candle forming. The buying pressure continues on the next candle, causing a large bullish candle to form that terminates roughly a third of the way into the initial bear candle that caused the drop.
Key Characteristics:
- First Candle: The first candle of the Morning Star pattern is a long bearish (red) candle, indicating strong selling pressure.
- Second Candle: The second candle is a small-bodied candle, also known as a Doji or a spinning top, that closes only slightly lower than the close of the first candle. It can be either bullish (green) or bearish (red), indicating indecision in the market. This candle’s shadows can vary in length.
- Third Candle: The third candle is a long bullish (green or white) candle that gaps higher than the close of the second candle and closes at least halfway into the first candle’s body. This suggests buyers have taken control of the price from the sellers.
- Market Context: The Morning Star pattern appears during a downtrend. It’s a reversal pattern, so it’s important that it appears after a significant downward price movement.
- Trading Considerations:
- Confirmation: The pattern is confirmed if the price continues to rise after the third candle, especially if the fourth candle closes above the close of the third candle. This indicates that the bullish reversal is likely to continue.
- Volume: In an ideal Morning Star pattern, volume will decrease on the second candle and increase on the third, confirming the reversal. However, this isn’t always the case, and a Morning Star pattern can still be valid without these volume conditions.
Three Inside Up And Three Inside Down
Next, we have the Three Inside Up and Three Inside Down patterns.
Much like the Three White Soldiers and Three Black Crows, the Three Inside Up/Down is a rare reversal pattern you’ll usually find forming at the end of trends.
A bullish reversal pattern, the Three Inside Up only forms at the end of downtrends and indicates a move to the upside.
The pattern is made up of three candles: two bullish, one bearish.
The bearish candle forms first and is usually the last candle in the downtrend.
Two bullish candles then follow, signalling the bulls have taken over and will now push price higher.
Key Characteristics:
- Prevailing Downtrend: The Three Inside Up pattern appears during a downtrend, signaling a potential reversal to the upside.
- First Candlestick: The first candlestick in this pattern is a long bearish (red) candle that continues the prevailing downtrend. It reflects the continuation of selling pressure.
- Second Candlestick: The second candlestick is a smaller bullish (green) candle. It is contained within the real body of the first candlestick, meaning it opens higher than the previous day’s close and closes lower than the previous day’s open. This is known as a “bullish harami” pattern and indicates a potential decrease in bearish momentum.
- Third Candlestick: The third candlestick is a bullish candle that closes above the close of the second candlestick. This confirms the bullish reversal signal, suggesting that buyers have gained control from sellers.
Trading Considerations:
- Confirmation: Confirmation of this pattern is seen with either a gap up or long white candlestick on the following day to validate this reversal signal.
- Volume: In terms of volume, it’s usually high on the first day of the pattern and decreases on the second day. On the third day, when the new trend is established, volume may increase again.
The Three Inside Down formation is a bearish reversal pattern that foms at the end of up-trends.
Like the Three Inside Up, the pattern shows three candles: two bearish and one bullish, which form one after the other.
The pattern completes when the third candle forms; price should then reverse to the downside.
Key Characteristics:
- Previous Uptrend: The pattern occurs after an uptrend or during a period of rising prices, suggesting a possible reversal.
- First Candlestick: The first candlestick in this pattern is a bullish one, which means it has a higher closing than opening price. This candle continues the current uptrend.
- Second Candlestick: The second candlestick is bearish (closing lower than its opening), and it is entirely contained within the range of the first candlestick. This means that it opens higher than the first candle’s close and closes lower than the first candle’s open, signifying potential weakness in the uptrend.
- Third Candlestick: The third candlestick is also bearish, and its closing price is below the closing price of the second candlestick. This confirms the bearish reversal.
Trading Considerations:
- Size of the Candles: While not a requirement, the first candle being larger than the subsequent two often adds to the credibility of the pattern.
- Confirmation: Traders often look for additional confirmation of the bearish reversal. This could come from the form of a gap down or a long bearish candle following the pattern. Another form of confirmation can be a higher volume on the third candlestick.
- No Upper Shadow: In some variations, the third candlestick has little to no upper shadow, which can make the reversal signal stronger.
Rising Three And Falling Three
Technically a 4 candle pattern, The Rising Three and Falling Three appear rarely in forex and signal a continuation of the previous trend or movement.
The Rising Three (the bullish variant) only forms during upmoves, and signals a continuation of the prior rise.
The pattern forms when price makes a sudden, sharp move higher, but then retraces back into the large bull candle on the next three candlesticks, which can either be bullish or bearish, before price rises sharply again and continues the prior trend.
Key Characteristics:
- Prior Uptrend: The pattern starts with price in a clear uptrend, indicating bullish momentum. This is usually signified by a series of higher highs and higher lows.
- Long Bullish Candle: The first candle in the pattern is a long-bodied bullish candle, showing strong buying pressure.
- Three Small Bearish Candles: After the first candle, there are three (although it can sometimes be four or even five) smaller bearish candles. These candles must remain within the range of the first candle’s high-low range, forming a short period of consolidation or pullback. This is the ‘Rising Three’ in the pattern.
- Long Bullish Candle: The pattern is completed with another long-bodied bullish candle that closes above the close of the first candle, confirming the continuation of the uptrend.
Trading Considerations:
- Volume: Typically, volume is high on the first and last candles (the long-bodied bullish ones) and lower on the three small bearish candles. The surge in volume on the final candle helps confirm the strength of the bullish sentiment.
- Confirmation: Even after the pattern is formed, traders look for additional confirmation, such as a higher trading volume on the following day or another bullish candle.
The Falling Three (the bearish variation) only forms during downmoves, and signals a continuation of the prior movement.
The Falling Three is created when price falls sharply, but then retraces on the next three candles. Each candle forms within the range – between the high and low – of the big bear candle and makes successive lower closes.
Once the third candle has completed, the next candle should be a large bear candle that continues the prior movement.
Key Characteristics:
- Downtrend: The pattern occurs during a pronounced downtrend. This is the context in which the pattern has its meaning. Without a prior downtrend, a Falling Three pattern is not significant.
- Long Bearish Candle: The pattern begins with a long bearish (red) candlestick forming, which contributes to the ongoing downtrend.
- Series of Bullish Candles: This is followed by a series of three (or sometimes more) smaller bullish (green or white) candlesticks. These candles open within the previous long bearish candlesticks close and close within the candles open. They should remain within the range of the first bearish candlestick. These candles represent a brief period of buying or short covering that is generally considered a consolidation.
- Final Long Bearish Candle: The pattern concludes with a resumption of the downtrend, marked by a long bearish candlestick that closes at a new low with high volume. The closing of this candle should be below the closing of the first bearish candle, engulfing the three smaller bullish candles.
Trading Considerations:
- Confirmation: Traders usually wait for a confirmation of the pattern, which comes as a break below the final candle on high volume.
- Volume: In the Falling Three Methods pattern, the volume plays a significant role. It’s usually high on the first and last day of the pattern and lower during the three-day pause.
- Duration: This pattern occurs over five days or five candlesticks in any other timeframe.
The Bottom Line
Memorizing so many candlesticks patterns will never be a walk in the park.
However, with this cheat sheet, you now have a simple way to quickly identify the key patterns as well as easily figure out what they signal.
Which should make understanding patterns much easier.