
Trend lines are one of the most useful and versatile tools used by forex traders.
But when it comes to drawing the lines, many traders, especially new ones, encounter issues.
In today’s article, I’m going to show you how trend lines should be drawn.
I’m also going to detail a couple of different ways you can them in your trading, and give a quick overview of what they are, so if you’re a new trader who doesn’t know what a trend line is, this section will bring you up to speed.
A Quick Introduction To Trend Lines
Price can generally be described as moving up, down or sideways.
Price moving up or down, for any sustainable length of time, can be said to be trending.
In short: a trend line is a straight line drawn from A to B on your chart, connecting a minimum of 2 price points of interest, to highlight a potential trending movement.
There is no maths involved, no calculations or wizardry, just plain old simple straight lines! Trend lines are totally universal, too, meaning they can be used to analyse the existence of a trend on any instrument, on any timeframe and in any market.
It takes a minimum of two points to draw a trend line, but a minimum of three to validate it…
Let’s look at some examples…
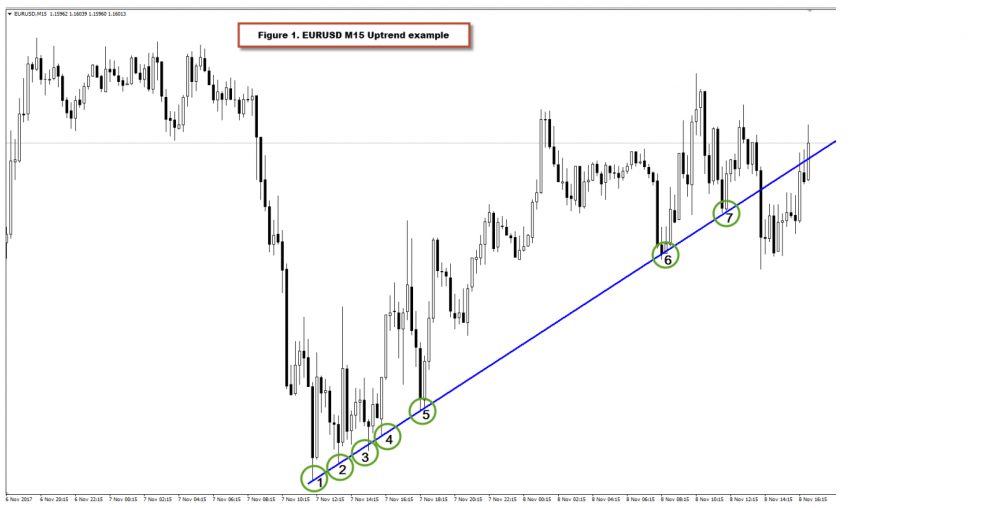
In the above figure 1, we can see some trending price action in the Euro which takes place over a 24 hour period on the M15 timeframe. During this 24 hour period, price touches and ‘respects’ the trend line a total of seven times before breaking it and closing well below.
The first and second price lows give the basic reference, or co-ordinates, for the trend line orientation.
The third touch gives the trend line validity and increases confidence that subsequent price touches will ‘respect’ or bounce off the trend line…until the trend line is finally broken with price closing below it…in this case, after touch seven.
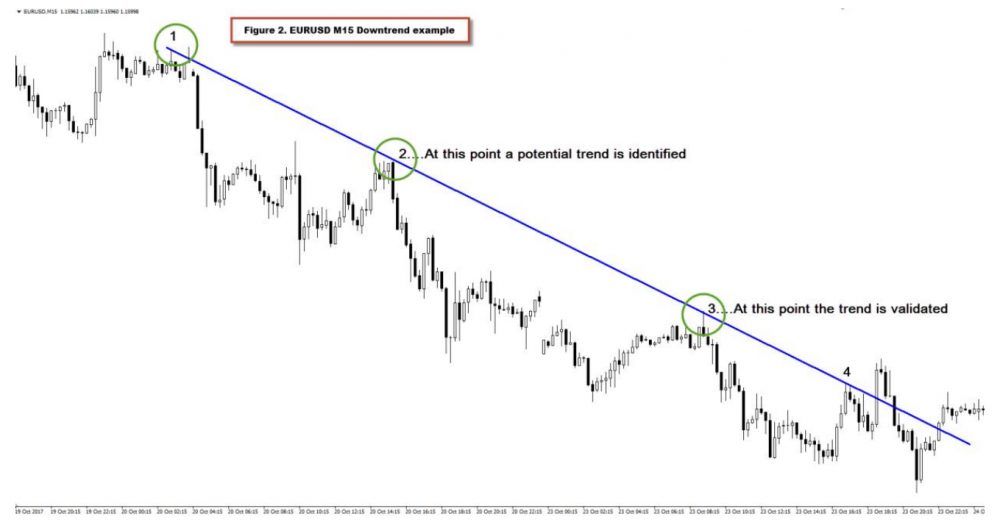
In the above Figure 2, we again see some EURUSD M15 trending price action, this time in a downtrend over a 60 hour period.
You will note there are far fewer trend line touches over a longer period of time.
Time is irrelevant when it comes to trend lines themselves, however, the more touches there are over a greater period of time, the more confidence you have that price is in an established trend and therefore the more likely it will be that price will respect the trend line the next time it approaches.
Of course, a trend line is just a straight line on a chart at the end of the day and in no way influences price.
It just gives us a perspective on how price is moving, but as you can see, a trend line can be a great visual aid to help us focus on the trending price action.
How To Draw Perfect Trend Lines Every Single Time
Did you notice the difference in the way the trend lines in the first two pictures were drawn?
When we identify a potential uptrend, we connect the first two low price points that print on the screen. That’s because an uptrend consists of higher highs and higher lows – the higher lows give us the upward angled line when drawn connecting them.
Conversely, when we identify a potential downtrend, we connect the first two high price points that print on the screen.
That’s because a downtrend consists of lower highs and lower lows – the lower highs give us the downward angled line when drawn connecting them.
For example, see figure 3 below.
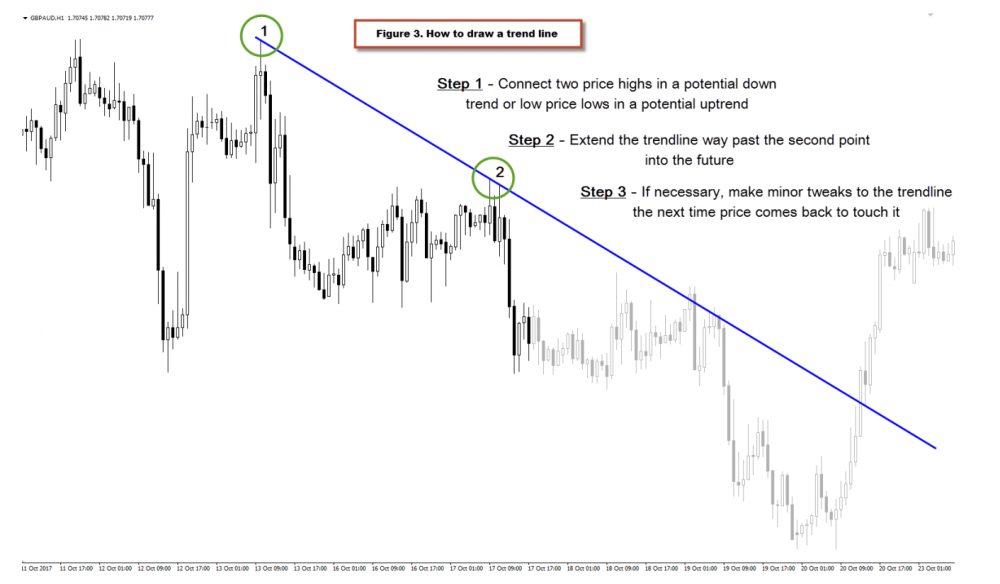
As you can see, drawing a trend line can be relatively straightforward.
Figure 3 shows points 1 and 2 of a potential downtrend.
After the price high at point 2 has been printed and price moves away convincingly with the same momentum as seen after point 1, you can then draw a straight line that links the two isolated price highs.
In the example above, we were lucky and caught a retest straight after, giving us a confidence boost in the potential of our newly identified trend. We don’t know if, or when, price will come back to retest the trend line again, so we extend the line well into the future.
As we monitor price and see it return to our trend line to touch for a 3rd time, we are looking to see if our existing trend line will hold to validate it, or if price ploughs straight through it to invalidate it.
This is why we need the 3rd touch, as without it we have no confirmed trend and the line is meaningless.
Ideally, we won’t have to tweak or move our trend line once price comes back to it, but we may find price does not react cleanly at the point of ‘contact’ and that a slight tweak gives the best fit through our 3 or more connected points.
Remember: Drawing trend lines is purely subjective and rarely perfect, since the market does what it wants to do, not what you want it to do.
As such, some leeway can be given to create valid and meaningful trend lines.
Price may sometimes close just the wrong side of a trend line, only for the next bar to open and immediately return back to and close back on the trend side of the line.
This is normal and happens sometimes.
If there are a lot of people watching the same level, either because they have the same trend line drawn, or it coincides with another point of confluence, then there might well be other traders looking to get in at the same price.
In this case, the added activity can cause price to oscillate around your trend line price level.
This can be seen at touch point 3 in figure 3 (not marked on the drawing).
Price comes back to the newly drawn trend line and validates it by closing at, or just beyond and then reversing and falling away quickly as shown by the large reversing and engulfing sell candle.
Price in fact tries to come back once again to test the trend line shortly after, but this time, price stops exactly at the trend line and price once again falls away as sellers resume control and the now established and validated downtrend continues.
Increased buying and selling action around trend lines can also create long wicks, as seen at points 1 and 2 in figure 3, where price is pushed up into a level where a sudden influx of sell orders ensures price falls away quickly and cleanly.
Important: Always Draw Trend Lines From Highs And Lows, Not Candle Bodies
It may be tempting at times to connect candle bodies, instead of the ends of wicks, to draw your trend lines.
It is sometimes true long wicks can just be representative of errant price action (spikes), but everything happens for a reason and until you are experienced enough or understand at a deeper level the relevance of price action in trends, stick to the wicks.
A perfect example of why is shown in figure 4, below:
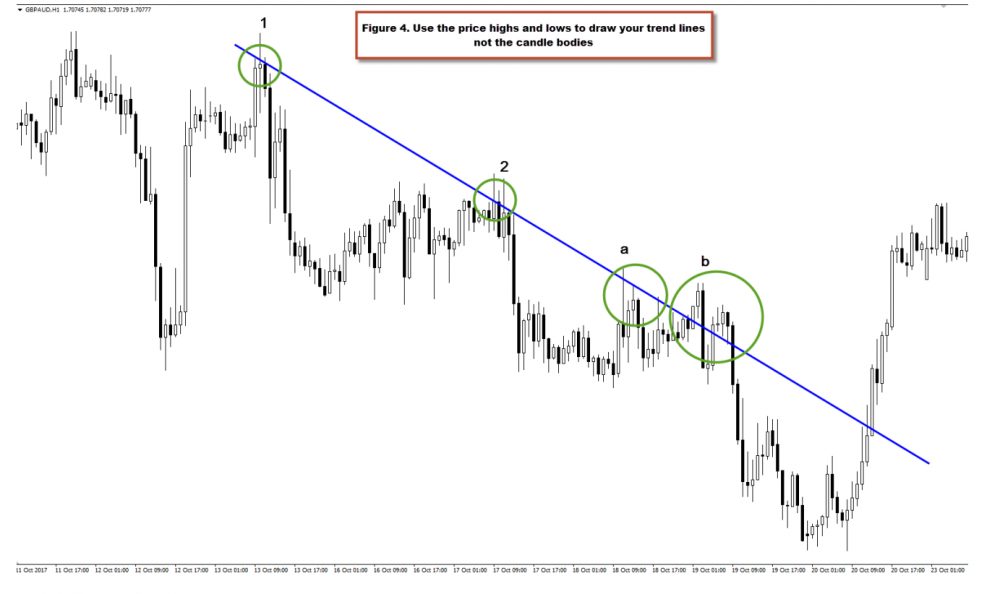
You can see above the trend line has been redrawn across the same two points, but instead of drawing the line from wick tip to wick tip, I have redrawn the line to rest on the candle bodies.
Ok, so it’s a line, parallel to the first one, nothing closes above it, so what’s the big deal?
Well, first of all, let’s look at what happens when price comes back at point a).
Price touches the trend line with a wick…twice and then moves away in the direction of the trend…. Great, we now have trend line validation. But the body of the candles did not this time touch the line…so does it count?
After price moves away for a couple of bars, it starts to head back towards the trend line, crosses it and then closes the other side.
The next bar opens and takes out the high of the previous bar and closes, thereby now invalidating your trend line and by your trend line rules, the current trend is now over….the very next bar is the large reversal engulfing candle which brings price back below the trend line.
An indecision doji bar forms and price again rallies, crosses and closes beyond your trend line and then hesitates before finally falling away with three large impulsive candles to the downside.
Confusing or what?!…
Well, just imagine if you were trading at levels a) and b).
If you were holding a position at a) or had entered short after validation at a), you would be creating unnecessary indecision and taking unnecessary heat, wondering if you had just made another school boy error as you watch price eat well into your stop loss, having just crossed, closed and opened the wrong side of your now invalidated, newly validated trend line!!…
All of this unnecessary tension could have been avoided, just by lifting the trend line to the highs of the wicks as in figure 3 and in figure 5 below.
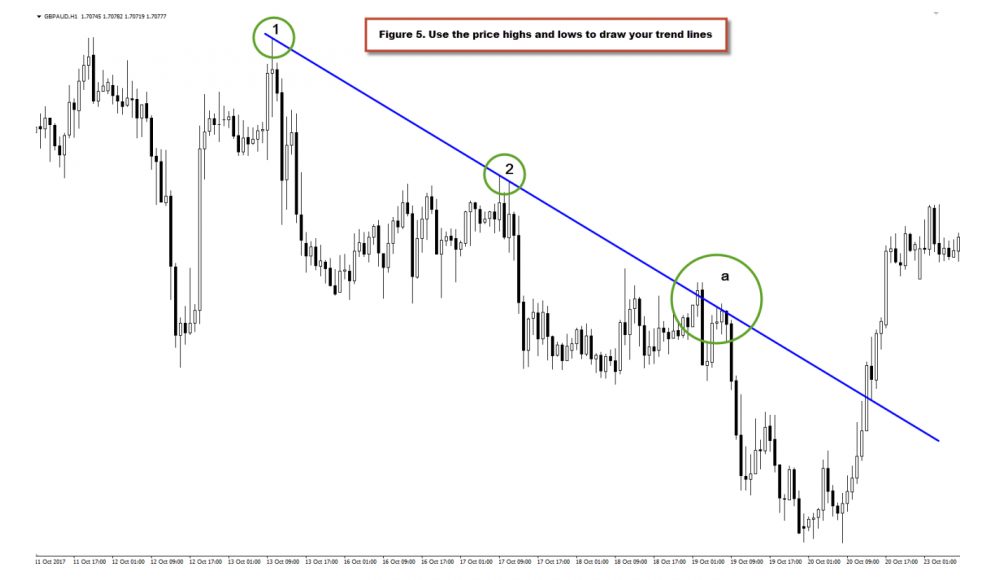
Now, with the trend line redrawn across the highs, we see a completely different story at point a).
It’s not until price actually closes at the trend line (just past it) and immediately reverses and falls away, that the trend line is validated.
The one touch and significant engulfing reversal candle gives us immediate confidence in the newly validated trend line. Even when price rallies and returns, this time with the trend line drawn correctly, price stops right at it, reverses and immediately falls away with no real cause for concern.
It was just by chance that the perfect opportunity existed to demonstrate not only the correct way to draw trend lines, but the reasons why we draw them that way.
It also demonstrates how, with amazing accuracy, price can respect trend lines and other levels of support and resistance, often to the pip….which when you consider that lines drawn on your screen are just that…lines!
It pays to be as accurate as possible with all your analyses, no matter how simple your techniques.
What Does It Mean When A Trend line Breaks ?
First of all, it DOES NOT ALWAYS signal a reversal!
It merely indicates that the trend you were following is now over.
From that point, price may move sideways, resume a similar trend at a later stage, or start to form a reversal. It is beyond the scope of this introductory article on trend lines to discuss in depth, the nature and behaviour of price action in trends, at the end of trends and in reversals, so let’s concentrate on the essentials.
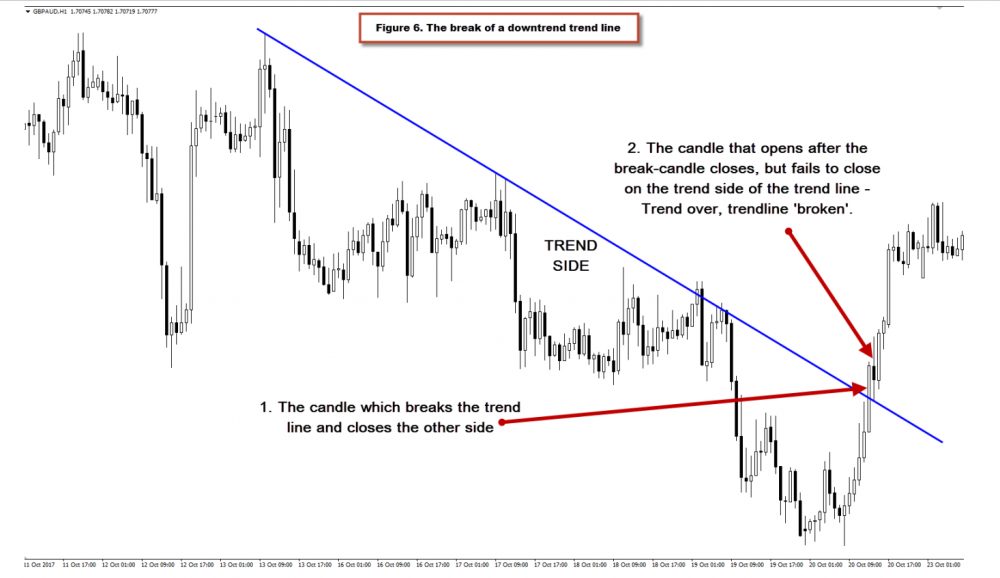
A downtrend trend line is considered broken – when price crosses and closes above the trend line and then the next candle opens and fails to close back on the trend side of the trend line.
An uptrend trend line is considered broken – when price crosses and closes below the trend line and then the next candle opens and fails to close back on the trend side of the trend line.
Let’s look at some examples to demonstrate this.
Using the previous downtrend example, in figures 3-5, we can see exactly what is meant.
Here’s another one…..
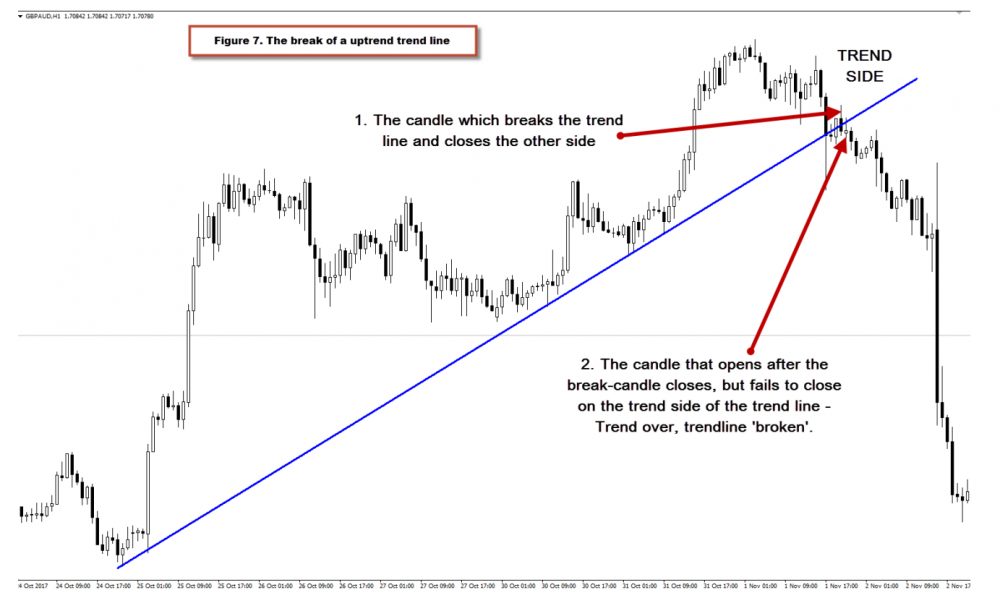
Hopefully, it is clear from the previous descriptions and figures 6 and 7 above, how we define a trend line break.
In figure 7 immediately above, we have a really well respected uptrend trend line.
It is interesting to note the first candle which breaks the trend line closes the other side of the line, but the next candle immediately reverses and closes back on the trend side of the trend line.
However, the buying pressure has died off and the following candle re-breaks the trend line, closes the other side and then the following candle fails to re-cross and close on the trend side of the trend line.
Therefore, the current trend is over and the trend line is considered broken.
Hopefully you can appreciate now, how important it is that trend lines are drawn correctly and precisely if they are to be used as an accurate guide to following a trend.
A long trend line which has not been drawn or maintained correctly can easily throw you off the trend trail at the other end if good, consistent trend line drawing practices are not maintained.
Two Ways You Can Trade Trend Lines
So now we know how to draw great trend lines and what they represent, let’s look at a couple of practical ways to use trend lines when trading.
1. Trend Line Bounces
Since we’ve accurately established and validated a trend line, the next thing to do would be to use it to profit from the market.
A bounce off a validated trend line is a sure sign that there is momentum behind the trend you are following, and that new market participants have entered the market trying to do exactly what you want to be doing….making money!…and in the direction of the trend.
There are numerous methods which you could employ as strategies within your own trade plan, but trading with momentum in the direction of the trend is an old-school favourite.
Whether you are trading the close of a reversal engulfing candle or other candlestick reversal pattern, or simply waiting for further confirmation beyond other support and resistance levels, as long as you have the trend and momentum behind you and your validated trend line as your springboard, then set appropriate stops and targets and get involved.
2. Trend Line Breaks
Trading trend line breaks can be a great way to get in early on developing reversal moves.
As was discussed earlier, a trend line break does not automatically equal ‘reversal opportunity’, but it is not uncommon for reversals to materialize, once the current trend momentum subsides after profit taking and a change in buyer/seller control takes place, resulting in a trend line break.
Often the decision to trade a trend line break may also be one of trade continuation.
Again, outside the scope of this article to discuss in detail, but needless to say that a retracement or price pull back may be a trend on one time frame, which might break down to resume a larger trend on another higher time frame.
Like all things in trading, it always pays to have a handle on the bigger picture.
Figure 8 below, shows an example of a trend line trend trade as well as a trend line break trade.
Plenty of food for thought!
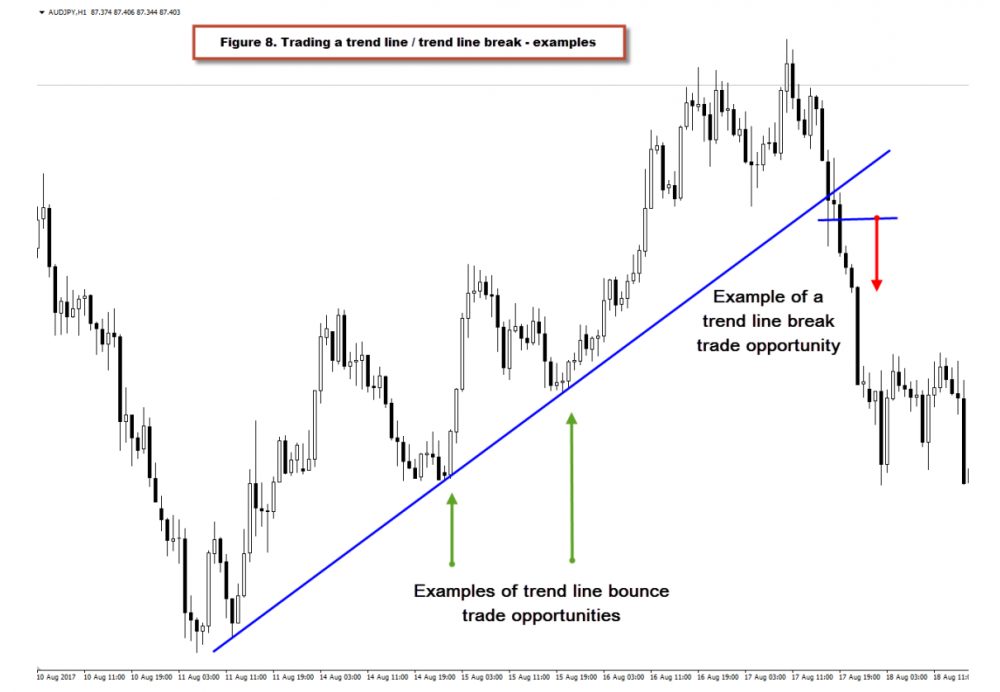
Note: A lower low takes a while to form on this break, so it wasn’t really suitable to enter a trade here.
Key Points On Trend Lines
- Always join price highs and lows to form trend lines and be quick at identifying trend line breaks, since reversals and price breakdowns at these junctions often come swift and hard.
- As with ALL technical analysis, never look at just one technique in isolation.
- Accurate trend lines are powerful, but their power is amplified significantly when the trend line bounce points are aligned with levels of support and resistance, as well as other significant price levels on the chart.
- If you are new to trend lines, some of the best advice I can give you is to practice drawing them and then monitoring what the price does when it comes back to them.
The Bottom Line
In this introduction to trend lines, you have hopefully gained an understanding of what they are, how to draw them properly, why we use them and briefly how we can use them to gain perspective on price and to profit from the market.
Trend lines are a simple yet immensely powerful analysis tool.
They can quickly describe if an instrument is trending or not and can easily identify potential trading opportunities on any time frame and in any market.
If you are new to trading and new to trend lines, the best advice I can give is to practice drawing trend lines, extending them into the future and then observing what price does when it comes back to them.
The beauty of trend lines is that they can be drawn on all time frames, so you can practice on the lower time frames without having to wait hours or days for price to return to them.
As you become more and more professional at drawing your trend lines and gain confidence in their use, you will uncover a powerful ability to benefit from numerous trading opportunities which have the wind of trend behind your back.
The Next Step? Learn The 5 Rules For Trading Supply Demand Like A PRO Trader...
Take your trading to the next level. Sign up today to download my FREE E-Book and learn how the pro's trade supply and demand - Includes Order Block PDF and S & D Guide PDF
Hi. Liam
can you write an article of how to trade with the inside bar I am waiting for this article for long time. I think you may forget it.
Thx
I’ll try get that one out soon, Tim.
Thanks for reminding me.
HI. This is Tim
when can you give us the method of trading with the inside bar.
you know. we are waiting for long time.
could you provide with exactly time.
thx
Yeah. I also wait for the inside bar post.
and waiting for long time.
so. please give us this post as quick as possible.
Thanks
hello,Liam. I’d like to buy your books, but Im from another country and I dont have a credit card. But I trade on crypto currency futures,so can I pay by crypto currency like USDT ? And how useful would you say are these strategies in trading cryptocurrency? thank you
Check your email, Keith.