
Having a detailed knowledge of candlesticks and what they signal is one of the key requirements for successful trading.
Candlesticks come in all kinds of crazy shapes and formations… pin bars, engulfing candles, inside bars, to name just a few. Most traders are familiar with these patterns, but there’s another candle that always gets overlooked:
The Spinning Top candlestick.
A candle you’ll find all over your charts, the Spinning Top is one of the most common candlesticks in forex. It forms from the bulls and bears battling for price supremacy but coming to a stalemate, and typically signals indecision in the market – which isn’t always true, as you’ll see later.
Today, we’re going to dive in and take a deep look at the Spinning Top candlestick… what it is, how and why it forms, the key insights gives about the price… so you, too, can start using it in your trading.
Sound interesting?
Let’s jump right in and see what the spinning top is all about…
Breaking Down The Spinning Top Candlestick
Tell me: have you ever seen a candlestick with a tiny body almost exactly in the middle of the candle and with a similar length upper and lower wick?
These candles form ALL THE TIME in forex.
Look at any pair on any time-frame, and you’ll see them everywhere. They’ll outnumber all other candlesticks by at least 3-1 – and that’s being conservative. Many traders discount these candles, but they’re actually really important.
Known as spinning top candlesticks, they signal indecision in the market.
Spinning tops form when the bulls and bears battle for control of price, but neither side can overwhelm the other.
Here’s how it happens:
First, the bulls push price beyond the open, causing the candle to turn bullish. The bears, of course, don’t like this. They come in and say: “Whoa, hold on a minute. We’re not having price move higher this time” and decide to sell to take price lower, resulting in an upper wick forming.
Now they’ve got control – or so they think.
They push price down again before the bulls step in and say: “We’re not having that, let’s take price higher again” and push price back towards the open, causing a lower wick to form.
This back and forth happens over and over; the bulls buy, the bears sell, the bulls buy again, etc…
Eventually, the battle comes to a stalemate with neither side able to get the edge on the other. At this point, the candle will close, and a spinning top will appear.
Identifying The Spinning Top
You won’t have much trouble identifying the spinning top – it’s one of the most common candlesticks, so you’ll see it pretty much everywhere.
It forms in a bunch of variations, but all have the same two characteristics:
- A small body in the middle of the candle.
- Almost equal sized upper and lower wicks.
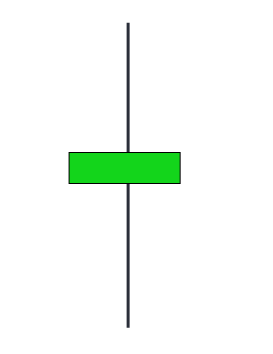
Sometimes the body will lean more towards one end than the other.
This doesn’t change anything; it’s still spinning top. It just means one side was able to edge the other slightly, but not enough for a decisive victory. It’s only when the body forms right at the end that it’s not classed as a spinning top… we call these pin bars.
The wicks will also have some size variation in them – bigger wicks mean a bigger battle went on.
These spinning tops can signal a reversal may soon begin, but DO NOT take them as entry signals. Most of the time, they form at market turning points, usually near a recent high or low.
Seeing one tells you the bulls and bears are really fighting it out – hence why the wicks are so big. So after one forms, watch for your typical signs of a reversal – pin bars, support and resistance, etc – as price could be gearing up for a large reversal.
Like all candlesticks, spinning tops can either close bullish or bearish.
Many traders think the close affects what price does next: e.g a bullish close indicates a rise, but that’s rarely the case. It depends more on which side attacked in the closing stages.
Even then, the chances are still almost 50/50.
Key Features
Here are the essential features of a Spinning Top:
- Small Body: The main characteristic of a Spinning Top candlestick is its small body. This suggests there is little difference between the opening and closing prices, indicating indecision or a stalemate between buyers and sellers.
- Long Shadows: The upper and lower shadows (or wicks) of a spinning top are typically long, showing that during the trading period, prices swung high and low. However, they closed near where they opened, again suggesting a tug-of-war between buyers and sellers.
- Indication of Potential Reversal: A spinning top can be seen as a signal the current trend might be losing its strength. This is because it represents indecision in the market, which often precedes a trend reversal. However, Spinning Tops are more effectively used in conjunction with other technical factors as they don’t always guarantee a reversal.
- Color-Independent: The color (red or green, bearish or bullish) of the Spinning Top doesn’t matter as much as the shape and position. Regardless of color, a Spinning Top indicates uncertainty and possible change in the market.
- Context Matters: While a Spinning Top can indicate a potential change in trend, it’s crucial to consider its placement within the broader price trend. For instance, a Spinning Top occurring after a long bullish trend may signal the bulls are losing control and a bearish reversal may be on the horizon.
Always remember, while Spinning Tops can provide valuable insight, they should be used in combination with other factors for more accurate predictions.
How To Use Spinning Tops In Your Trading
Spinning tops don’t have many practical uses compared to the typical candlestick patterns we use – like pins, engulfs, inside bars, etc.
That said, depending on when and where they form, they can give you some really important clues on what’s going on behind the scenes with the bulls and the bears.
Here’s how I typically use them…
Best Way To Use Tops: Early Reversal Signals
Spinning tops don’t make good entry signals, so DON’T use them.
You’ll only lose money and wonder why they didn’t work as expected. The best way to use tops is as an early warning signal the current move could be coming to an end, and price may soon reverse or retrace slightly.
People think spinning tops signal indecision, which they do…
But they also indicate one side of the market (bulls or bears) believe the current price is too high or too low.
For example, if price is rising and a spinning top forms, that means the bears came in and decided to battle it out with the bulls by selling. They obviously don’t want price to continue rising – it could mess up their trades, it may be due to some fundamental factor, or something else – so decide to sell to stop it moving higher.
With that in mind, we can use spinning tops as hints on whether a reversal/retracement is near.
If the bears are willing to sell to stop price rising further, causing a spinning top to form, we know one side of the market doesn’t want price to continue rising – making a reversal or retracement likely.
So that’s it then: all we need to do is wait for a spinning top to form, right?
Well, not exactly…
Spinning tops, even though they can signal a reversal, often don’t – sometimes price simply stalls or retraces slightly after they form, hardly reversing an inch. Needless to say, we want to avoid these tops and focus on the ones that have the best chance of causing a reversal.
And how do we do that?
Easy:
By concentrating on the tops that form in and around technical levels – supply and demand zones, support and resistance levels, fibs, etc..
Since these are the points where lots of buyers and sellers are active, when we see a top form around a technical level, we know there must be many people who believe the price is too high or low – more so than at any other point during the move.
That makes a reversal much more likely, meaning the top is a higher quality signal.
It’s simple enough – just watch for a spinning top once price hits a level or enters a demand zone. Then you know a reversal could be near.
Let’s go through an example…
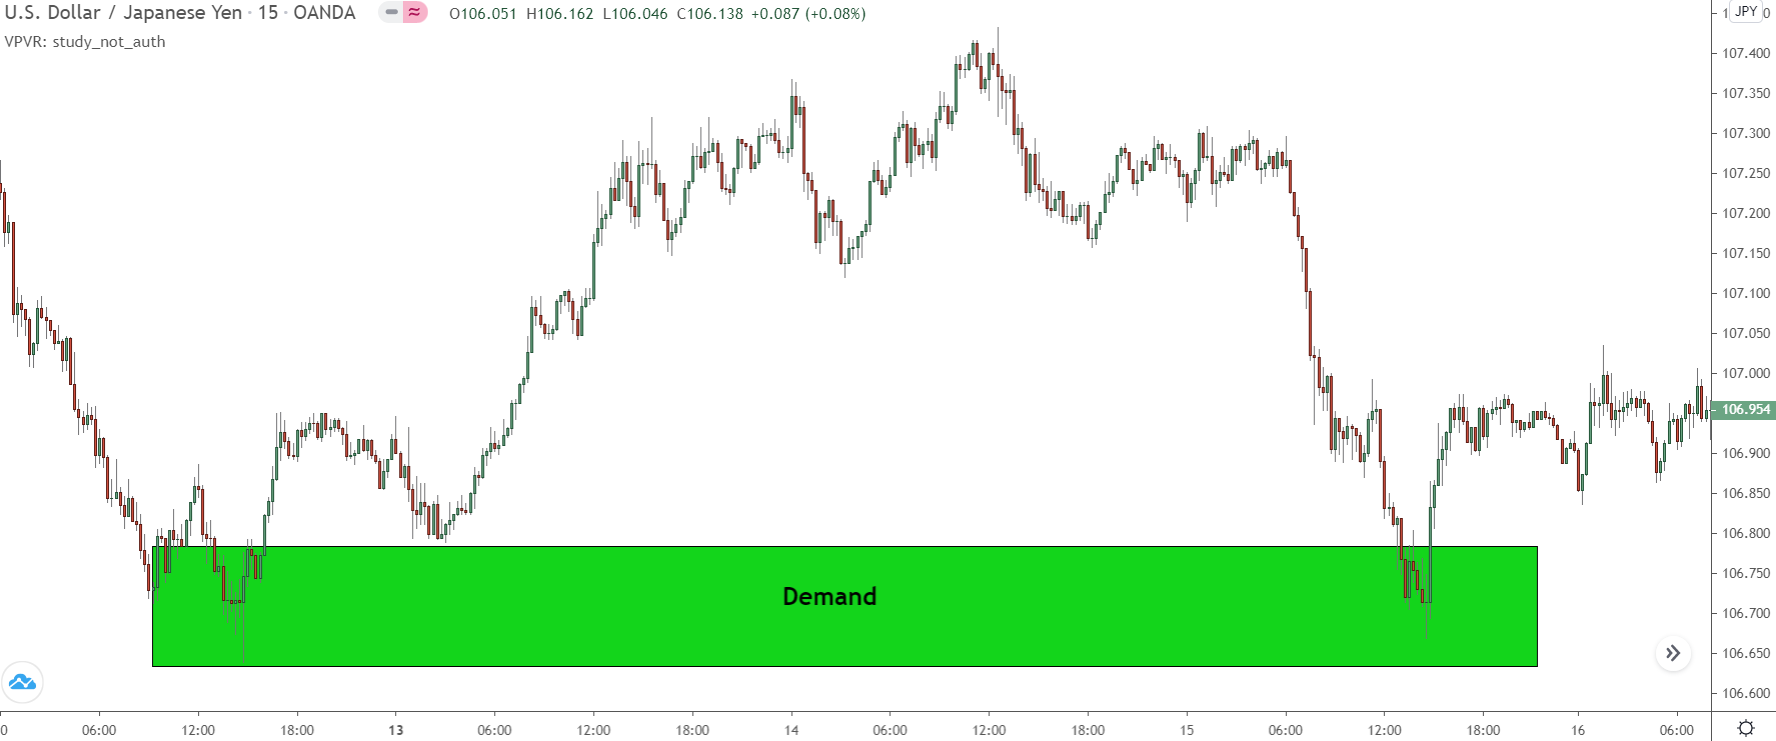
Here, you can see price has just entered a demand zone – a good zone, in fact.
We don’t know yet whether price is going to reverse from this zone.
As always, we must wait for price action signals – like pin bars, engulfs, etc – to confirm price is about to move away.
Then we can get in and (hopefully) catch the resulting reversal.
In the meantime, however, we can watch for a spinning top…
We know a spinning top at a technical point reveals sellers (or buyers in our case) think the price is too low/high – a good indication price is probably going to reverse. We can then use it to #1 know price still has a chance of reversing from the zone, and #2 as a timing mechanism on when to expect a PA signal to appear.
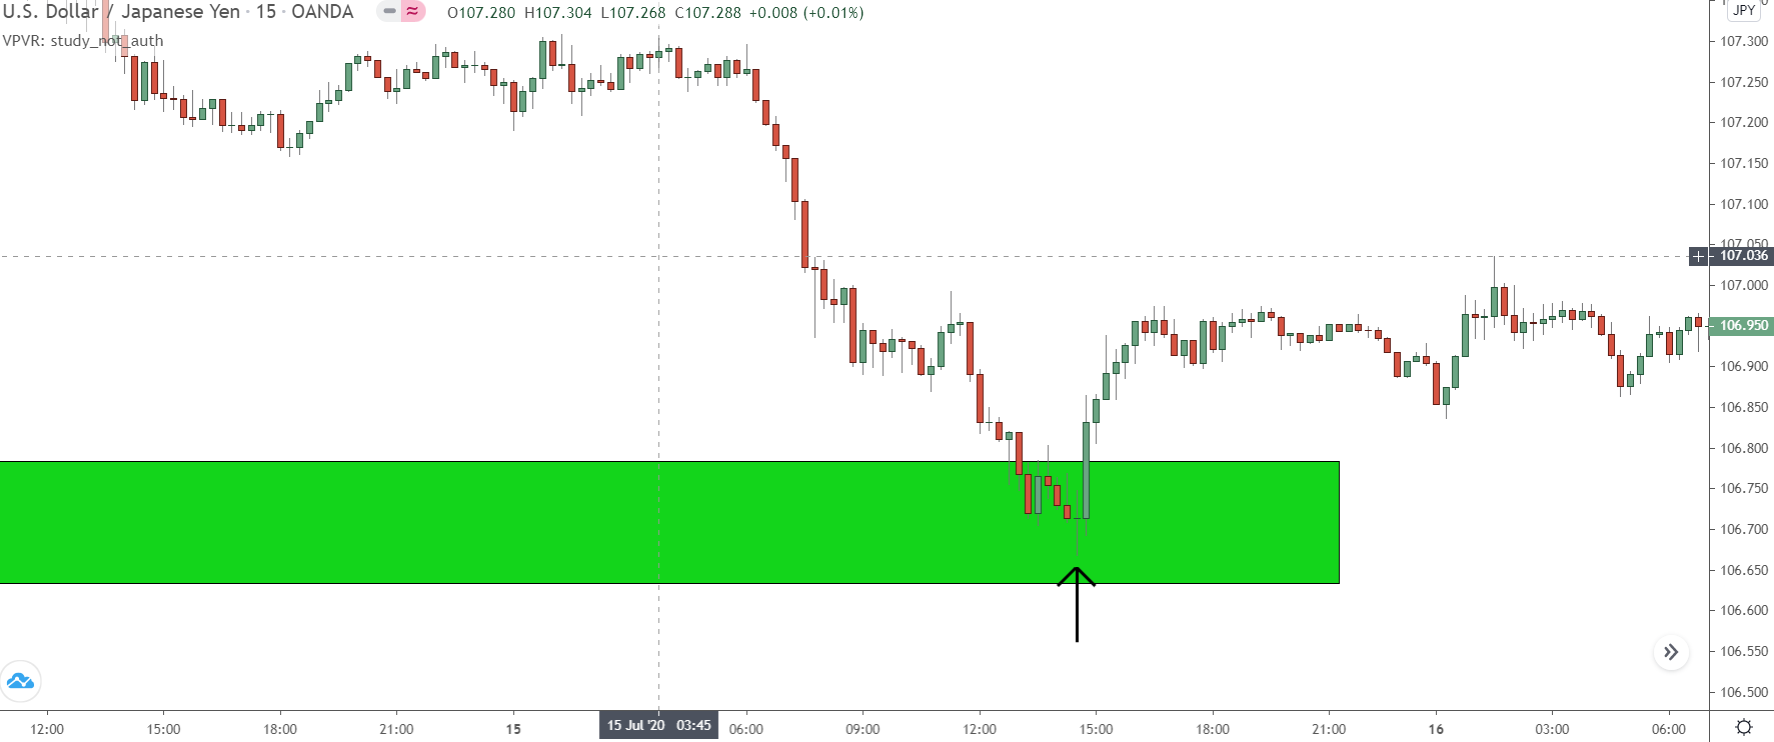
A spinning top appears 4 -5 hours after price enters the zone – some would call this a doji, but it’s really a spinning top.
With this top, we know lots of buyers still believe price is too low.
A bullish candle formed when price first entered the zone, but that got taken south.
So we didn’t know (for sure) if buyers were still interested or whether the zone would cause a reversal. The top reconfirms that, telling us YES, buyers are still around, keep your eyes open because an entry signal could soon appear.
We don’t actually get an entry in this case – after the top, price reverses on its own and jumps higher.
However, we still got confirmation the zone was valid for trading and a heads up that a potential reversal could soon begin… which in itself was a worthwhile signal we can use to our advantage.
So keep this in mind going forward, when you see spinning tops form at significant technical levels.
The tops tell you buyers or sellers are firstly interested in wanting price to reverse – why else would they start battling the other side? – and secondly, that a reversal signal could be near… not necessarily on the next candle, but within a short space of time on the time-frame you’re watching.
Now, let’s move on and look at a few key facts to remember about the spinning top.
3 Facts To Remember About The Spinning Top
Before we come to the end and you head off and start watching for spinning tops, here’s three important facts to remember when using them, what they signal, and how significant they are.
#1 Always Use Multiple Candles To Confirm Signals
A single spinning top tells you almost nothing about what’s going on, only that the bulls (or bears, depending on the prior direction) have come into the market and decided to battle it out with the other side again.
If you want to confirm the tops indicate a possible reversal or retracement, you must wait for other signals to form alongside.
For example…
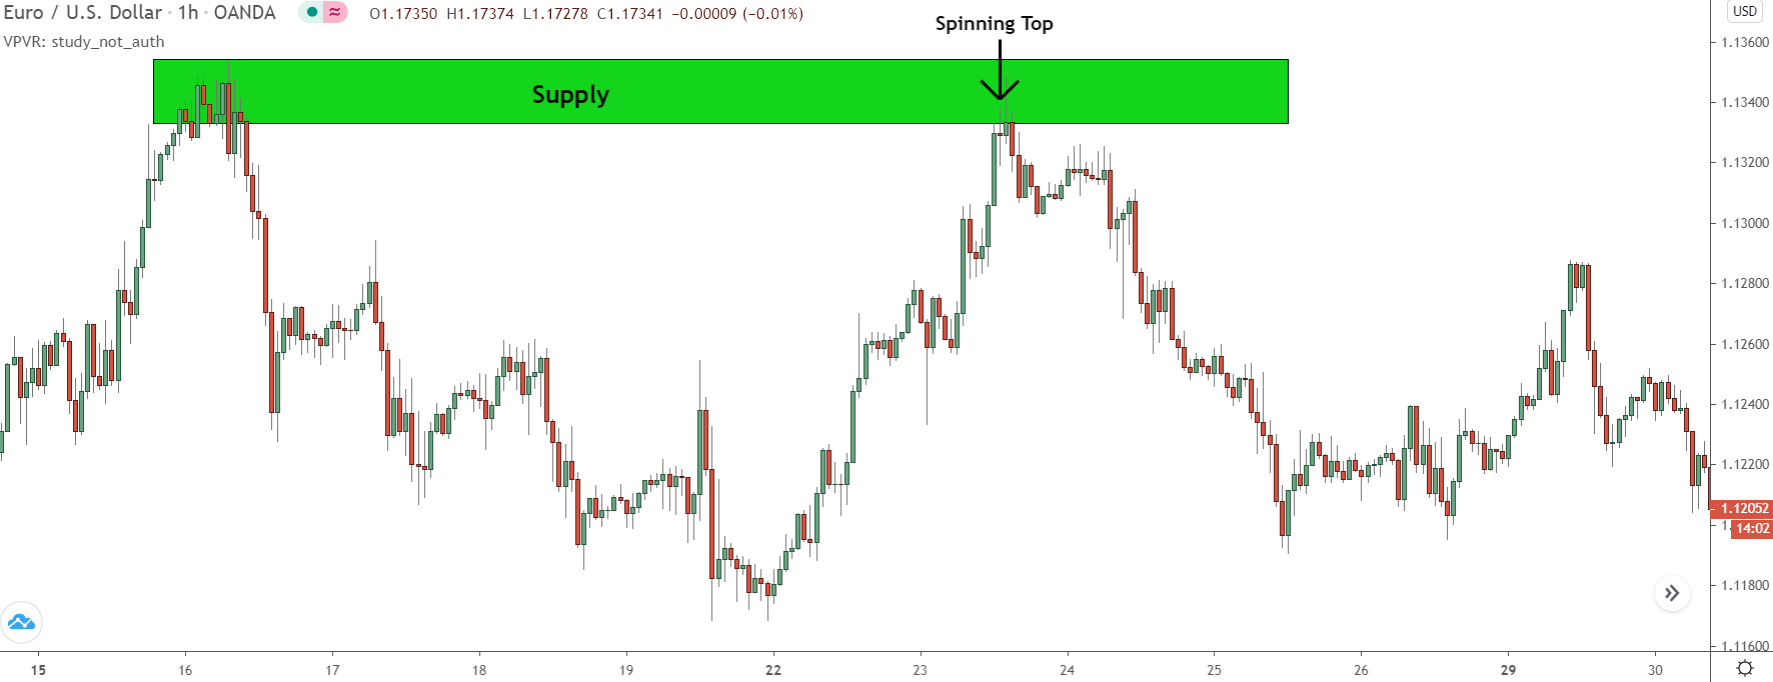
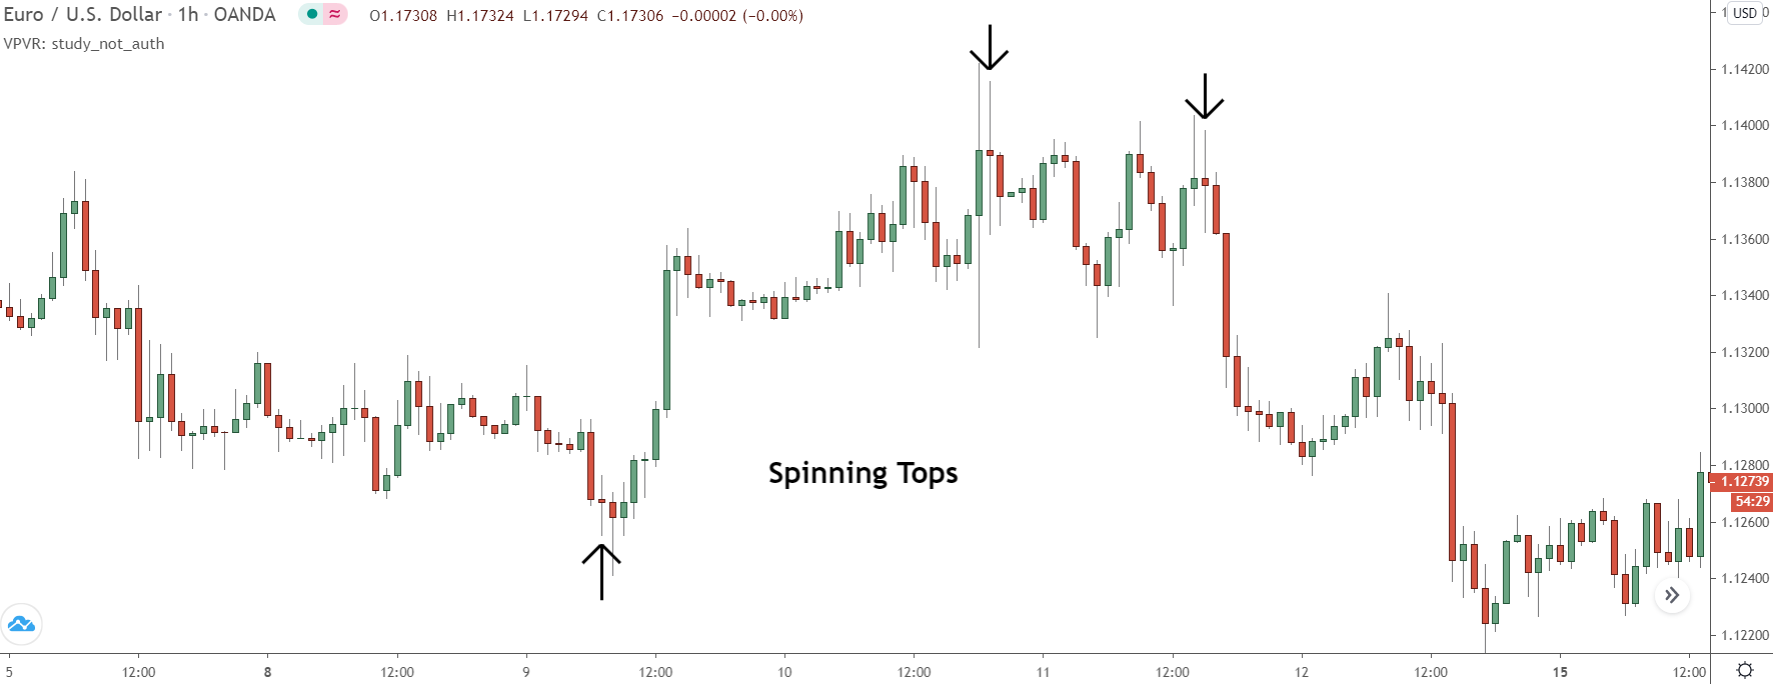
After a sharp rise, Eur/Usd moves into a supply zone and begins to show bearish price action.
At the initial point of contact, a spinning top with two big wicks forms revealing the bears have decided to battle it out with the bulls again – hinting a reversal could soon be in order.
Now, on its own, this isn’t a great signal because we don’t know whether the zone will hold or not.
So we need to wait for more signs price could be about to reverse before entering a trade.
1 hour after the spinning top appears, a large bearish pin bar – which we know is a good reversal signal – forms, adding more confirmation price is about to reverse. This would be the signal you use to get in short. The spinning top suggested the reversal, but now the pin bar confirms it.
Look what happened a little later too…
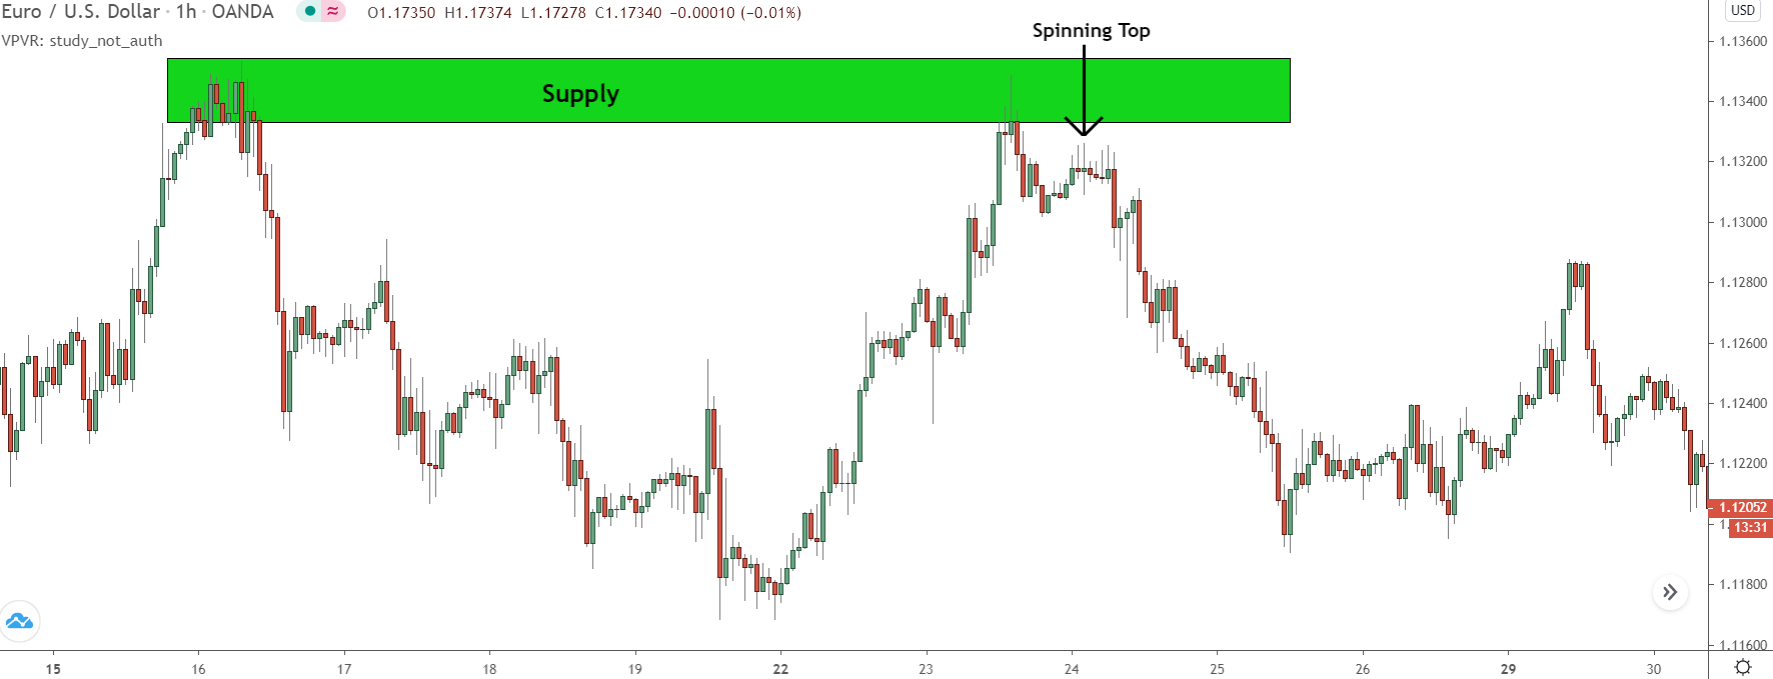
After price falls and a bearish engulf forms (also a good reversal signal – and probably the better entry option), price begins to move sideways, and another spinning top appears.
Again, this tells you the bulls and bears are battling it out, suggesting a reversal could be near.
You don’t know which way, though the expectation is obviously bearish given the recent drop, so you wait for more price action. 2 hours later, 3 consecutive big bearish pin bars form, telling you the bears have probably won the battle and that price could be about to fall, which it then does.
Easy, right?
Also, remember to combine this with what I explained in the previous section.
Spinning tops at support and resistance levels, supply and demand zones, or fib retracements have a much higher probability of indicating a reversal. Use them as a warning signal price is about to reverse away from the level/zone, then watch for confirmation using pin bars or engulfing candles.
This will help you in predicting exactly when price is going to reverse from a level or zone.
#2 Daily Spinning Tops Are More Significant
As with most candlesticks patterns, spinning tops are considered more significant when they form on the daily time-frame; they include more bulls and bears, so their battle is bigger and more significant for the market. To many, this may not sound that useful, but it can really help you out…
If a spinning top forms on the daily, you know a seriously big battle is raging.
Whoever’s come into the market to battle the other side REALLY doesn’t want price to continue in its current direction.
So what do think will happen if they lose?
Price is going to move, BIG TIME.
If they lose the battle, price will move sharply because there’s no-one left to stop it anymore. That liquidity (people buying or selling to battle the other side) has been removed from the market, so price must continue in its current direction until more buyers or sellers are found.
You can see the perfect example of this below…
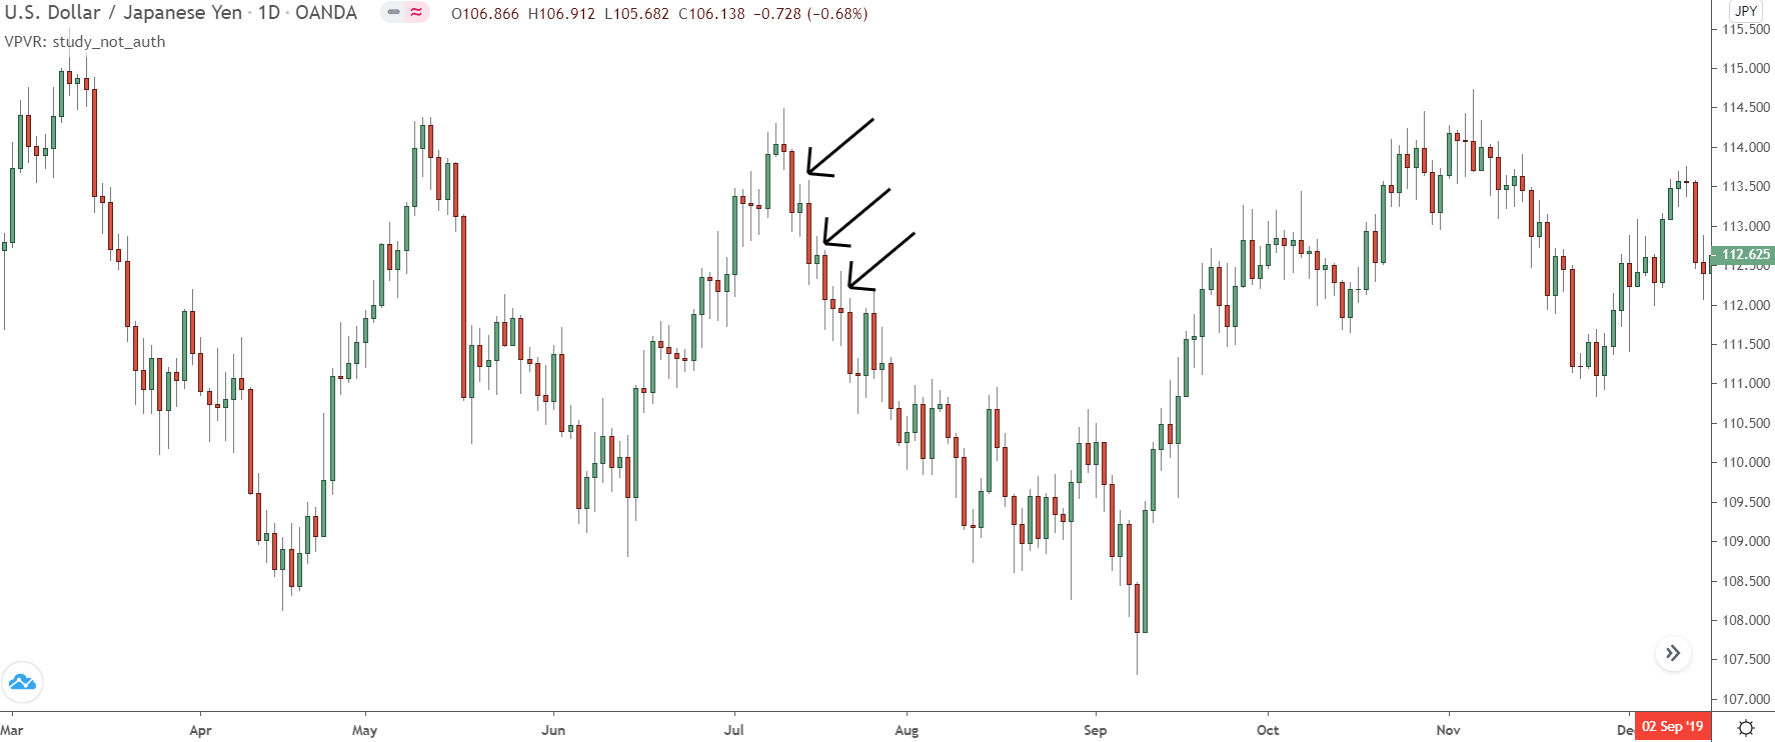
During this down move on Usd/Jpy, three spinning tops formed, followed by a sharp decline.
Each top represented a significant battle between the bulls and bears; bears wanted price to keep falling, bulls wanted higher prices. In each case, the bulls lost the battle. Once they did, no buyers were left to stop price falling, resulting in a sharp decline before a new battle commenced at a lower price.
See what I mean now?
So with this in mind, how do we use this knowledge in our own trading?
I think the easiest way is simply that: to know when a sharp rise or fall could be about to begin.
How many times have you been on the receiving end of a sharp move? Probably A LOT, right? And I wonder how many of those moves began after a spinning top appeared?… more than a few, that’s for sure.
Knowing a sharp rise/decline could be near is useful in other ways too…
If you’re short and a spinning top appears – signalling another sharp decline may soon begin – you can attempt to get short again on a lower time-frame, to scale in and increase the amount profit you make. You also know to take some profits off too, in the off chance price moves against you.
These are just a few of the insights you can get from seeing a spinning top appear, which is why I think it’s one of the most important candles to lookout for.
#3 They Don’t Indicate A Reversal Simply A Pause
Again, I’ve got to put this here.
It’s one of the main misunderstandings traders have about the spinning top and a key reason why price action traders lose money.
The spinning top isn’t a reversal signal; it just shows a pause in the market.
The bulls or bears which were in control either on the previous candle or prior move have come into the market and decide to battle it out again for price supremacy.
The bulls think price is too low and want it to move higher.
The bears believe it’s too high and wish it to move lower.
Whoever wins will control price, but that will only show on the next candle, not the spinning top.
This is why it should never be used as a reversal signal. The candle doesn’t reveal who won the battle, only that it took place! You have to wait for the next candle to show a pin bar or engulf to know who’s now in control of price.
So again, DO NOT use spinning tops as reversal signals, they don’t work.
Wait to see what price does on the next few candles to find out who won the battle.
If a pin bar or engulf forms, that’s a good signal of who won. If another spinning top forms, the bulls, and bears are still battling it out; stay on sidelines and wait for more PA.
The Bottom Line
I’ll be the first to admit that spinning tops aren’t the most useful of candlesticks.
Not compared to pin bars and engulfing candles, which give us a clear idea of what price will next. Even so, they can provide you with some really useful insights, which I hope you’ve gleaned from today’s post.
The Next Step? Learn The 5 Rules For Trading Supply Demand Like A PRO Trader...
Take your trading to the next level. Sign up today to download my FREE E-Book and learn how the pro's trade supply and demand - Includes Order Block PDF and S & D Guide PDF