
To master forex trading, you’ve got to learn how smart money operate. These guys are the big players who move the market and set the trends.
So, the real question is…
- How do we suss out what smart money are up to?
- Can we spot ’em on a chart and figure out their moves?
- Is that even doable?
Heck yeah, it is!
The best part: it’s way easier than you might think.
The smart money moves aren’t just visible on a chart; they’re quite obvious. In fact, they’ve been right in front of you the whole time you’ve been trading.
You just didn’t notice!
In this post, I’m going to let you in on how to figure out what the smart money are up to, like where they’ve jumped into trades, cashed in, and maybe even called it quits.
I’ll also toss in a couple of cool examples of how you can use this in your own trading:
- To guess when and where a reversal might kick off.
- To double-check if a reversal is really happening.
These tips will show you how keeping an eye on the smart money can help you be in sync with the market and make smarter trading moves.
Ready to jump in?
Let’s get started!
Tracking The Banks – Why Swing Highs And Swing Lows Are So Important
Now, you’d be right in thinking…
Understanding how the smart money operate in forex can prove tricky.
After all, the smart money are the craftiest traders around, people who work tirelessly to hide their footprints and concel their motivations. But it doesn’t mean it’s impossible to figure out what the SM are up to either.
As the saying goes…
Price reveals everything… including the smart money!
Charts reveal SM footprints, just like everyone else.
In fact: Finding and tracking the smart money takes little skill. You only need to understand a few facts about the market, namely:
- Buyers requires sellers (and vice versa).
- The more somone wants buy, the more sellers required.
These two facts can allow you to determine where/when smart money traders buy and sell, tracking their footprints in the market.
Sound cool?
Let me explain…
You’ve heard the phrase: “For every buyer, there’s a seller right”?
But what does it mean?
In a nutshell— the only way to purchase a currency hinges on other traders’ willingness to sell an equal (or higher) amount simultaneously at the current market price.
- For you to buy… others must be selling.
- For you to sell… others must be buying.
The larger the purchase? The more sellers required.
Simple as pie, right?
Here’s the crucial point: For retail traders (like you and me), finding the necessary number of opposing buyers or sellers is never an issue— our trades are so minuscule that only a handful of opposing traders are needed.
For the Smart Money (SM), however… it’s a whole different ball game.
The SM can only buy when thousands of opposing sellers exist, and only sell when thousands of buyers are at the ready.
So, what’s the takeaway?
To put it briefly:
- SM can’t buy when the price rises… too few traders selling!
- SM can’t sell when the price falls… too few traders buying!
The above uncovers a vital fact: All swing highs/lows form from the smart money executing different trading actions— placing trades, taking profits, or closing trades.
Now, ponder this: how does a swing high/low form?
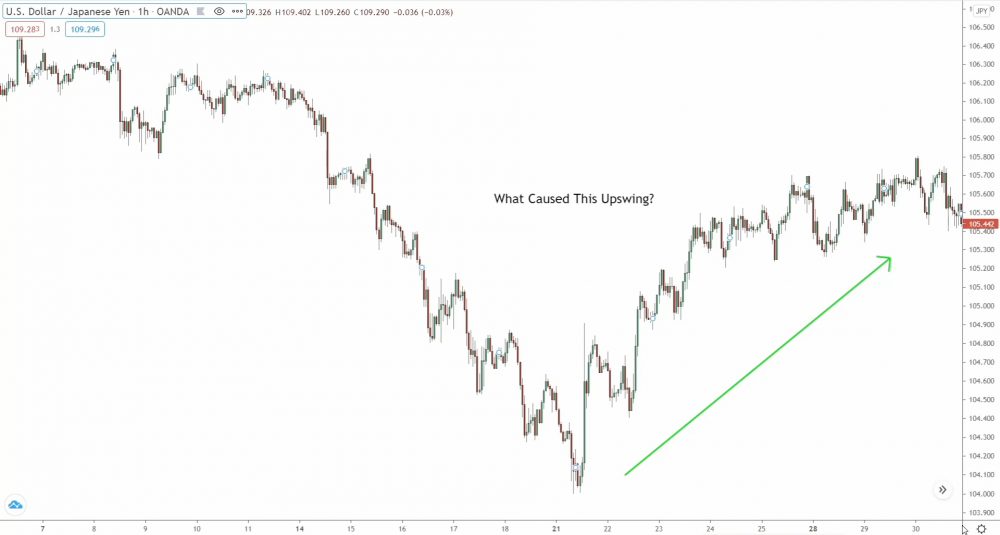
For the upswing above to form, what happened?
Somebody bought up all the sellers, right?
The only group capable of that… the smart money!
Only the SM possess the funds and resources to purchase from thousands of sellers. Just think about the sheer amount of capital it requires to reverse a massive downswing or downtrend! Plus, the smart money needs hordes of opposing sellers to enter buy positions anyway.
Putting it all together, this implies…
To track the smart money and pinpoint when/where they’re buying and selling, simply locate and examine swing lows and swing highs:
Swing highs/lows are the smart money footprints.
These highs/lows disclose when/where the smart money has taken action.
That’s why price reversed and formed the low or high in the first place.
Is it all clear now?
So, when examining this chart…
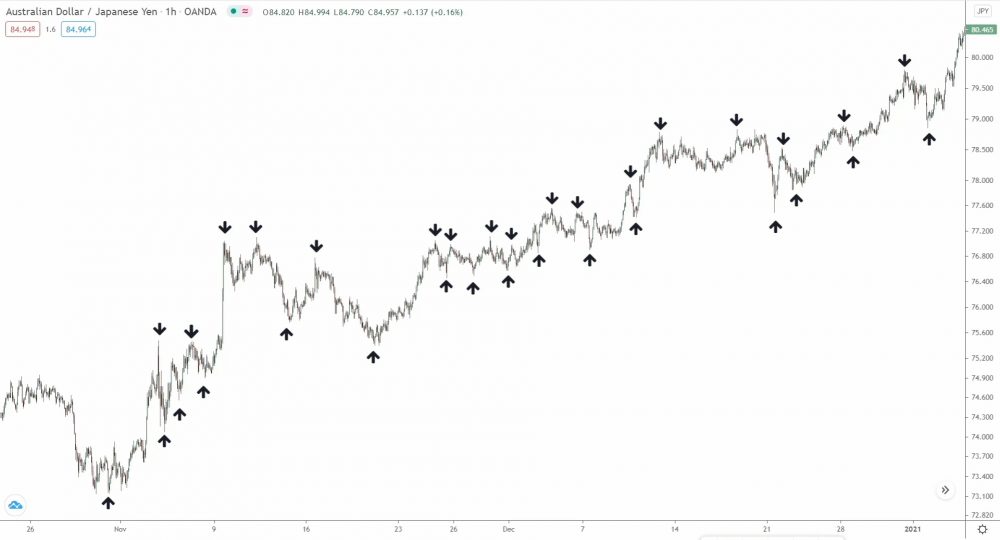
Every swing high and low above formed due to the smart money buying or selling to complete one of three trading actions:
- Taking profits
- Closing existing trades.
- Enter new trades.
Now, you can’t determine (for sure) which action corresponds created each high or low yet, but you can use probability alongside understanding where each high/low formed and what was happening at that time to make an educated guess.
For example:
The SM can’t enter massive positions will nilly – obviously.
The smart money require thousands of opposing traders buying or selling, which only happens after price has been moving in the same direction for a long time.
So, with the above in mind…
It’s clear: Most swing highs/lows are NOT created via the SM entering trades.
Same goes for closing trades…
To close a large buy trade, what must you do?
Sell back what you bought, which requires masses of buyers.
Bottom line: Most swing lows and highs are not created by the smart money closing large open trades. Closing requires thousands of opposing traders, which only happens when price has been trending or moving in the same direction for a long time.
Important Note: Many swing lows and highs form via the smart money entering smaller trades, but not massive positions that initiate market changing reversals.
So, only one other action remains – taking profits.
Profit taking creates most swing highs and lows in the market.
The smart money generate large profits during every price move, so they must take profits frequently to avoid overloading themselves and making closing the trade difficult.
What happens when the SM take profits?
Price moves in move in the opposite direction, forming a swing high or low.
Looking back at our example then….

It’s clear: Most swing highs/ lows above formed due to profit taking; the smart money took profits as price moved in their favour.
Also: Many lows/highs formed due to the SM entering small trades.
How else could price continue in the same direction?
A small number of swing highs AND lows formed via the smart money entering large trades or closing out existing trades. These actions require thousands of opposing buyers or sellers, so the SM can only execute them after a significant trend.
Quick Note:
Most (over 95%) of swing high or low forms due to the banks. However, I’ve only noted the most significant swing highs and lows – the swings created from a sizeable reversal.
The smaller highs and lows also form due to the SM’s actions.
But these are less significant than the highs and lows I marked.
The SM create these swing highs/lows by entering small trades or taking minor profits, making them insignificant in our analysis. Consider these highs/lows in your trading, but avoid placing massive importance on what they indicate about the smart money.
Now, lets look at the example again, but with the highs and lows marked:
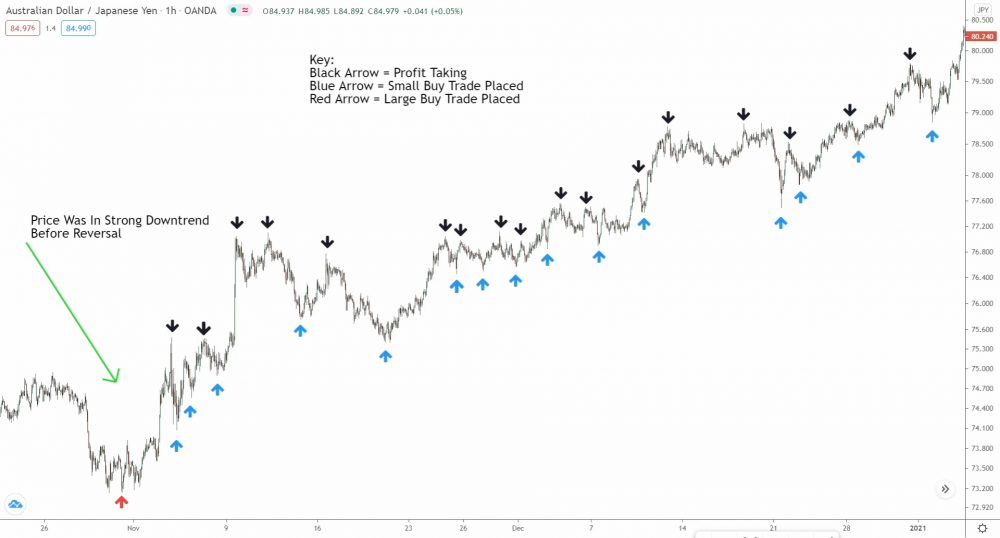
Right away, the distribution makes sense:
Out of 33 swing highs and lows…
- 17 formed due to the SM taking profits.
- 15 were created by the SM entering small buy trades.
- 1 formed due to the SM entering significant buy trades.
Here’s my main point:
While you can never know (for sure) what action created a swing high or low, you can gauge the reason the high/low formed by assesing the probabilities of what action the smart money traders could take at that time in the market.
You know…
- The SM can’t enter large trades very often, so most highs/lows don’t form for that reason.
- The SM must frequently take profits, so that’s what causes most highs/lows to form.
- The SM also enter small trades occasionally, which also causes a large % of highs/lows to form.
By combing these probabilities with our understanding of the market, we can accurately assess what’s caused a swing high or low to form and then use that to help us make better trading decisions.
How To Track The Smart Money (Quick Example)
So, now you know the truth…
The only reason swing highs and lows form is because of the smart money executing trading actions. With this information, you should have a much better grasp on what’s actually going on in the market and what the smart money are up to behind the scenes.
Before we come to end, though, I want to give you a quick couple of examples of how to use this in your trading.
Here’s example 1:
Example #1: Predicting Reversals
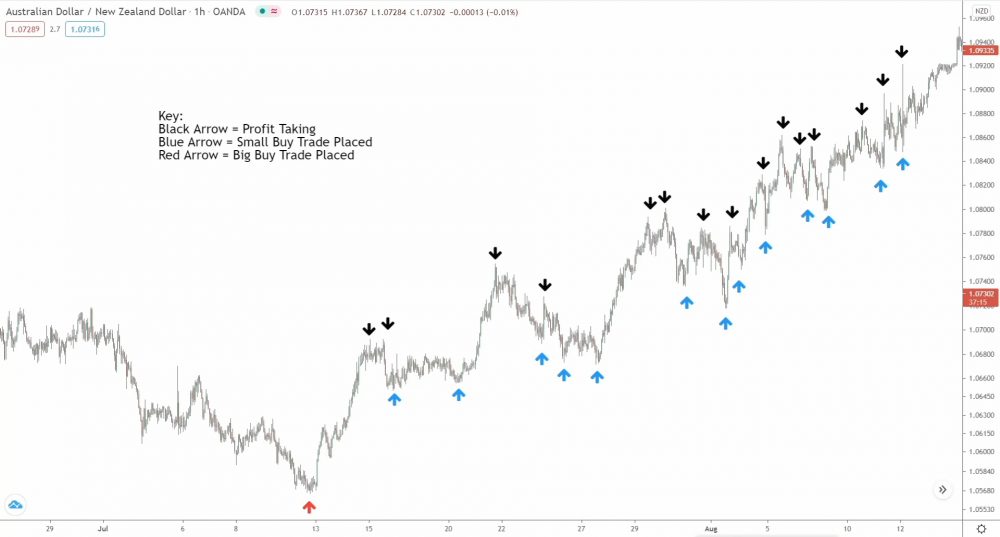
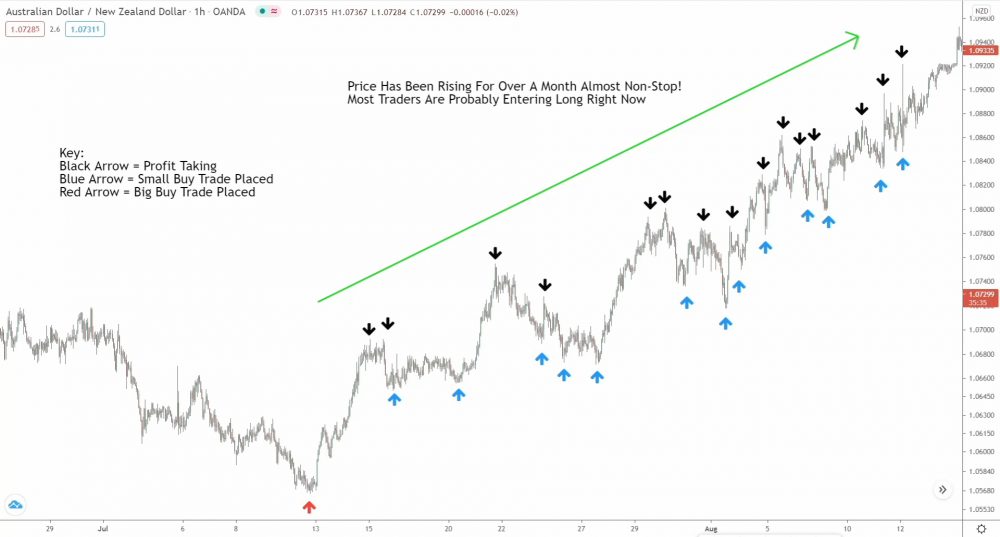
For example #1, I’ll explain this upmove on Aud/Nzd.
Here’s the lowdown:
Price has been trending higher for a while, causing multiple swing lows and highs to form. The smart money create these highs/lows executing one of three different trade actions: taking profits, entering new trades, or closing existing trades.
Top Tip: Always mark which action created each high or low. Either note the action on swing or keep a mental note to follow the SM’s footprints.
Imagine trying to predict where the upmove might end… what would you do?
Probably look at the nearest technical points, right?
- Supply zones,
- Resistance levels,
- Psychologoical levels, perhaps?
But here’s the real kicker: You can use your understanding of the smart money to help gauge where price will reverse, so you know which specific technical levels to focus on.
Here’s how:
First, look at price… it’s been trending for a while, right?
Multiple retracements and consolidations have formed along with the odd pause here and there.
But here’s the thing: Price can’t keep trending forever… at some point, the smart money must take price the other way to shake traders out. Remember, forex is a zero-sum game; the only way to profit is when other traders lose money.
The problem?
Shake outs can’t last forever – traders aren’t stupid.
When traders see price retrace multiple times and continue rising, they’ll eventually notice and use the retracements to enter the trend.
So, what’s the solution?
The smart money must initiate a significant reversal, deep retracement, or mega consolidation to shake out dumb money traders. The shake-out will make the dumb money think the up-trend has ended, allowing the smart money to reload their positions and generate profits by taking price the other way.
In short, this means:
The longer price stays in a trend, even with consolidations and retracements breaking up the action, the closer the price comes to reversing.
In our example…
The smart money have already taken profits a few times, creating some minor consolidations and retracements. What does this reveal?
The uptrend, my friends, may be coming to an end.
How will that happen?
One of three ways…
- A deep retracement.
- A large bearish reversal.
- A long protracted consolidation.
On top of that: Price is likely to reverse at one of the three major technical points:
- A higher timeframe supply zone.
- A major psychological level.
- A supply zone found within a HT zone.
You’re also aware that for the smart money to close a huge buy trade or jump into a significant sell trade, thousands of traders must be buying. So when are all these traders buying? When price has been moving higher for sustained time – exactly what you’re seeing in the example.
So yeah, it’s pretty clear: Price seems ready for a change.
Now, it’s time for the next step: Double-check if the price is close to one of those three technical points I mentioned.
One of these will bring this upmove to a halt and kick off a reversal.
And, would ya look at that…
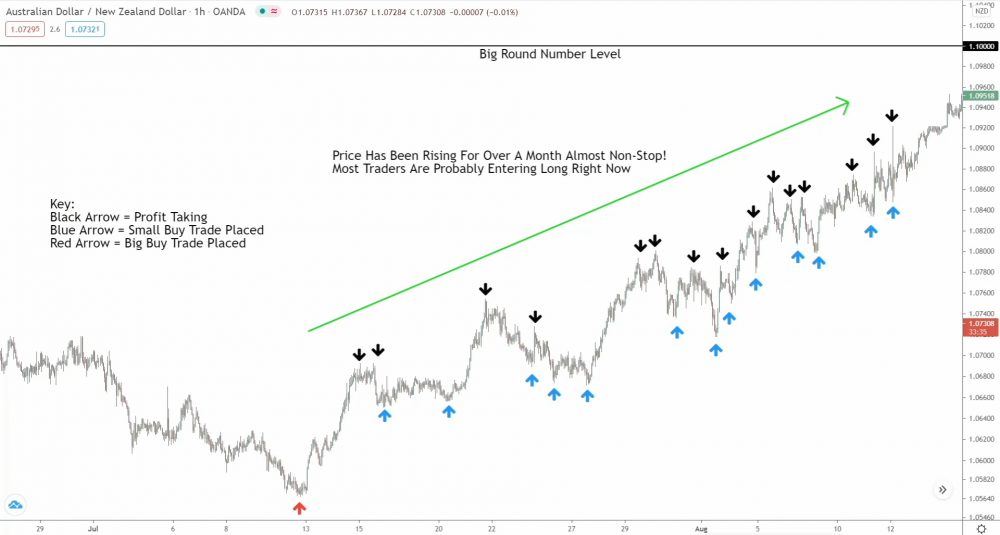
The 1.10000 psychological level sits just a few pips above the current price.
Chances that the price will reverse around here? SUPER high! (Want to know what makes those big round numbers so powerful? Check it out here).
So, what’s the game plan?
Keep an eye on that level for any signs of a reversal.
Now, let’s fast-forward a bit…
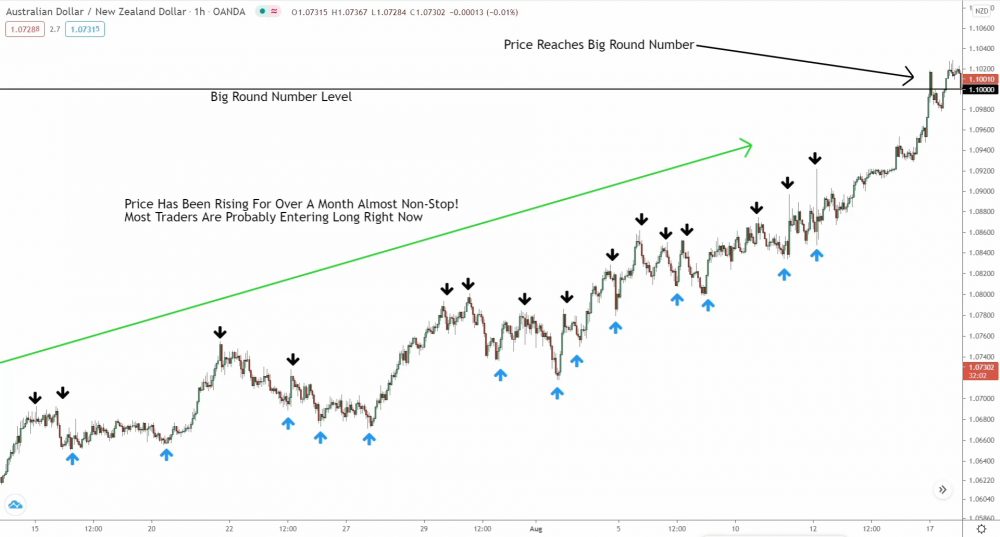
After a couple more downswings and retracements, price suddenly spikes higher and boop—taps that psychological level.
Next up on your to-do list: Look for clues price could be about to reverse.
You need some solid price action to signal a reversal, so you can find that perfect moment to hop on board before price goes south. There are tons of patterns and formations that might tip you off, but here’s my go-to strategy…
- Look for a steep price move.
- Check if price breaks the previous low.
- No steep move? Keep an eye out for a break anyway.
A sudden, steep decline usually means the smart money are selling—I mean, why else would the price drop like a rock when everybody’s buying’?
That’s right!
The Smart Money (SM) loaded up on massive sell positions!!
But hey, don’t jump the gun…
A quick, steep drop alone doesn’t give you enough confirmation of a reversal. Price has got to break past the previous swing high or low too—a break suggests those smarty-pants have cashed out their longs and are ready for the price to change course.
Alright, on to example #2!
Example #2: Confirming Reversals
At first, I was gonna do two separate examples here.
But example #1 flows smoothly into the second way you can use swing highs and lows in your trading, so I thought I’d just combine ’em… makes it a breeze to follow, right?
Here’s the deal:
Being aware that the smart money create swing highs and lows means you can also use them to confirm reversals. By keeping an eye on price breaking a swing high or low, you can confirm whether the smart money still have trades open.
Let’s jump back to our example…
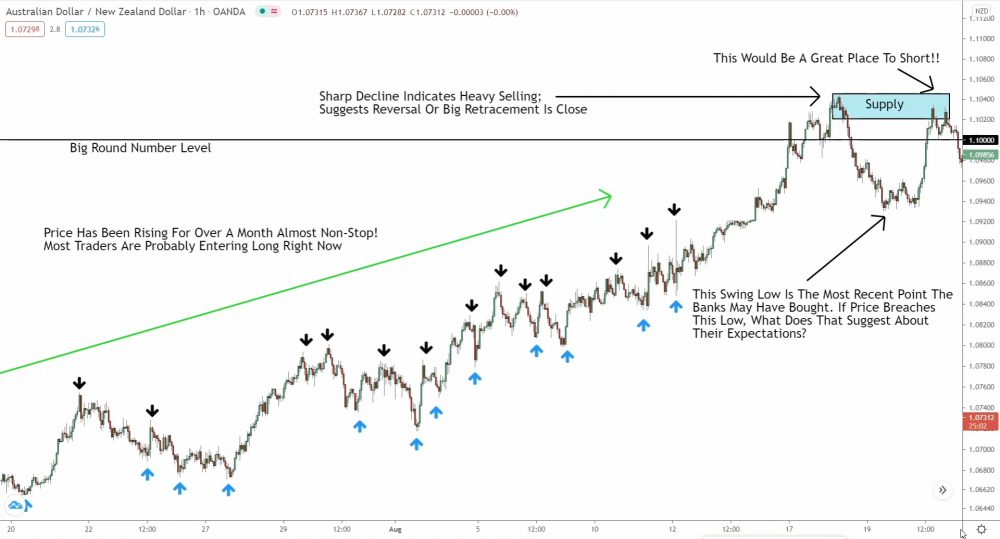
Price has just dropped, which hints a reversal might be just around the corner.
But, hold up!
You need more evidence!
Price must now break the most recent swing low—a break will confirm the reversal.
Here’s why…
The swing low reveals the freshest point where the smart money could have entered their buy trades. That was the last time price went up for any decent length of time.
Keep this in mind:
Smart money can only buy when thousands of traders are selling (i.e., when price is falling). So, the swing low has got to show where they jumped into long positions, causing the rise—where else were thousands of traders sell during the rise?
So, if the price now breaks the swing low, what’s that hinting at?
What’s a break revealing about the SM’s positions?
The answer… that SM ain’t long anymore!
When price smashes through the swing low – that is, with massive bearish candles – it’s a red flag the smart money traders aren’t holding onto long positions. Why? Easy: the decline would put their latest buy positions underwater.
Why would the SM put themselves in the red?
Why would they sell (to makeprice reverse) if it means taking a hit on their buys?
Doesn’t add up, right?
So, the only conclusion…
The smart money ain’t long anymore, and instead want price to head south. That’s why price reverses and breaks below the swing low.
And if we fast-forward again…

After breaking the low, price continues falling, and significant new downswing begins.
See the advantage of tracking the smart money using swing highs and lows?
You can use the highs/lows to not only gauge when the price might reverse—like in the first example—but also to confirm when the price has turned, like I just explained… This is why understanding how and why swing highs and lows form proves so important!
The highs/lows reveal the SM actions.
Analyze some old swing highs and lows; understand why they formed – from profit-taking, trade placing, etc. Then, see how you could have used them to your advantage!
Could you have timed a trade better?
Pin pointed a reversal with higher precsion?
Before long, you’ll start incorporating what the banks are up to into your own decision-making!
And guess what?
This should help you make better trading decisions.