
Choosing which trading system to use in forex is one of the most crucial and important decisions you must make as a trader, but with so many different systems out there, the question arises:
How do you know which to pick and use in your trading?
It’s not an easy decision, and it’s one I lost A LOT of time with using weak systems that rarely made money.
To help you guys out a little, today, I want to share a few of my own personal trading systems with you.
These 5 trading systems are a collection of strategies and setups I think are worth using and watching for in your trading. All based on price action, they require nothing but a price chart and your eyes and are easy to pick up and learn for beginners and experienced traders alike.
Sound interesting?
Let’s take a look at the first system…
Pin Bars At Support And Resistance Levels
What do you get if you combine two of the most useful and well-known price action concepts together?
The answer: A VERY good trading system.
Trading pin bars at significant levels of support and resistance is one of the oldest forex trading systems around, but it’s one that still performs extremely well today. It’s easy-to-learn for beginners, provides a good number of profitable trading signals, and best of all…
It’s REALLY simple to trade:
You mark some support and resistance levels on a chart, wait until the price reaches one, then see if a bullish or bearish pin bar forms.
- If price hits a support level and a bullish pin forms, you enter a buy trade.
- If price tags a resistance level and bearish pin forms, you enter a sell trade.
Let’s go through a quick example…

Here’s a bunch of support and resistance levels I marked on a chart of Eur/Usd.
If you look to the right of the chart, you can see price has just fallen sharply and is now close to hitting the support level at the bottom (the line marked blue).
If price hits this level and produces a bullish pin bar, it’ll be a signal for you to go long.
The pin forming at support suggests the banks and other big traders want price to rise; the support being a key point they would want a reversal to take place from, the pin confirming their interest at that level.
And what happens next…

A bullish pin bar forms!
This pin confirms price has a high probability of reversing away from the support level. It doesn’t mean price will definitely reverse and move away, but it does make it highly likely. So, upon seeing this pin form: enter a buy trade, place your stop-loss slightly below the low of the pin, then see if price reverses.
If everything works out, as it did here, you should get into a nice profitable long trade.
For trading resistance levels, you follow the same process: you wait for a bearish pin to form at resistance, place your stop just above the high of the pin, then see if price reverses.
Easy, huh?
Engulfing Candles Inside Supply And Demand Zones
Trading engulfing candles inside supply and demand zones is an offshoot of the supply and demand trading strategy popularised by Sam Seiden, and it’s one of the best reversal strategies on this list.
Supply and demand is all about identifying points of interest: supply and demand zones.
These function identically to support and resistance levels, only: rather than being lines that cover a few specific prices, they’re zones drawn at the source of large rises and declines.
There are two types of zone:
Supply Zones – points where the price is likely to fall.
Demand Zones – points where it’s likely to rise.
Now the ‘normal’ way of trading supply and demand, the way taught by Sam Seiden, is to place a limit order at the edge of a zone and then wait for price to (hopefully) execute it and reverse. This method works well; it can get you into some decent trades. However, it’s much better to wait for an engulfing pattern to form inside the zone before entering.
Engulfs form when the banks enter the market and conduct some kind of action – like place trades, take profits, close trade – so seeing one form inside a zone provides greater confirmation price is actually going to reverse.
Here’s how it works…

First off, mark a few supply and demand zones on the chart using the method outlined in my post. I recommend only marking the ones closest to the current price, so the chart doesn’t get too cluttered.

To draw the zones, (again, I’m really simplifying here) find the bottom of a sharp rise or the top of a sharp decline and draw a rectangle from the open of the last small candlestick that formed before price jetted away to the most recent major swing high or low; swing low for sharp rises and swing high for sharp declines.
With the zones marked, the next step to wait for price to return and see if a bullish or bearish engulfing pattern forms within or when price touches the outer edge.
For demand zones, a bullish engulf must form.
For supply zones, a bearish engulf has to form.
 In our case, a bullish engulf forms a few hours after the price hits the zone.
The engulf confirms the price the banks want price to move away from the zone, making a great signal a reversal be about to begin. So now, you enter a buy trade and place your stop loss just below the opposite edge of the zone.
If you’re trading supply zones, it’s the opposite way around:
Wait for the price to hit the zone and see if a bearish engulfing pattern forms. If it does, you enter a sell trade and place a stop ABOVE the opposite side of the area.
Easy.
Trading Pin Bars At Trend Lines
I’ve always said:
The best way to trade forex is to have one ‘core’ strategy that provides most of your trading signals (like supply and demand) and then two or three additional setups that give rarer signals but that have a higher probability of being successful.
One of the best setups you can use, in my opinion, is trading pin bars at trend-lines. Trading pin bars at trend lines!
This has a been a staple price action trading system for decades now, providing high probability low-risk entries into trending moves or big swings. Trading pins at trend lines isn’t a great core strategy – it doesn’t provide anywhere near enough signals. But, when used at a separate setup, it can get you into some good trades and help even out your profits.
It’s extremely easy to trade too, and only requires you to follow three simple steps:
- Draw a trend-line on an up/downswing.
- Wait for price to return to the trend-line
- Enter upon seeing a hammer candlestick form.
The key thing to remember, which almost everyone gets wrong, is always draw the line ON THE SWING HIGHS/LOWS of the swing, NOT through the bodies of the candles.
 When you draw the line on the candle bodies, the points won’t add up; price will often reverse after breaking the line; or won’t touch the line in the right place, not giving a valid signal entry signal if a pin bar forms.
To ensure this doesn’t happen, always draw the line on the swing lows or highs that make up the move.

This will give you the right trend line and allow you to trade pin bars at trend-lines correctly.
Pin Bars On Their Own
It’s no coincidence that most of the strategies on this list involve pin bars in some way… it is one of the best price action signals, after all.
But did you know: it’s also possible to trade pins on their own, with no other concepts or techniques?
Most price action gurus say you shouldn’t because they have a lower probability of causing a reversal – due to not being found at points of confluence, i.e at S & R, Fibonacci, trend lines, etc – which is true. However, they can a very profitable set up on their own if you understand one really important point…
Pin Bars DO NOT all form for the same reason.
Some pins, most in fact, form as a result of banks and other large traders taking profits off their trades or because of companies buying or selling for business purposes, like converting currency, for instance.
These pins obviously don’t have a high probability of being successful, so you need to avoid them at all costs.
To determine why a pin bar has formed, you must look at where it’s appeared in the market.
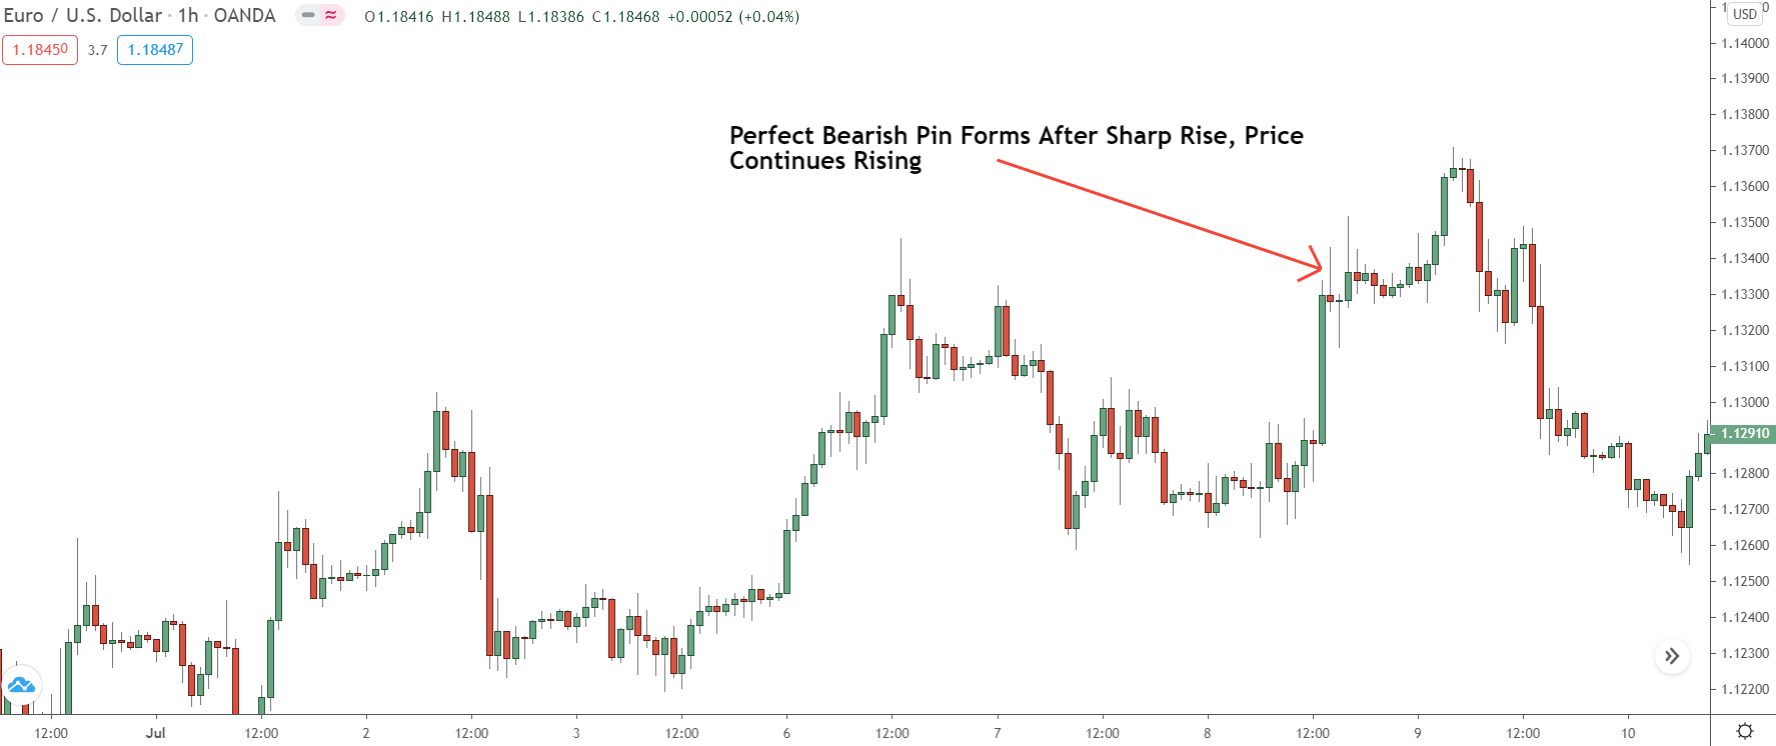
If a pin forms right after a sharp move, as you see here, chances are it’s formed from the banks and other big traders taking profits off their trades. Because think about it, the sharp move significantly increases the amount of profit on the banks buy trades.
If they’ve suddenly made a lot more profit, they’ll obviously want to take some off to secure it.
When they take profits off a buy trade, such as in this situation, they must sell some of what they bought, causing price to fall. The resulting candle shows up as a low probability bearish pin bar.
So, that’s how we find the low probability pins.
But what about the good pins that do have a high probability of being successful?
Really, that’s something I can’t fully explain here – it takes a lot of knowledge about the banks and how they operate to understand fully, which we haven’t got enough time to explore today.
If you get my Pin Bar book or read some of my other posts, you can get a sense of where the high probability pins are.
Check out the following links:
Pin Bars And Engulfing Candles At Fibonacci Retracements
Another great strategy, or ‘setup’ I think is a better name for this one, you should add to your arsenal of trading systems, is trading pin bars and engulfing candles at Fibonacci retracements.
Much like trading support and resistance levels, trading pins/engulf at fib retracements has you enter trades when price pulls-back to a Fibonacci retracement and forms a pin bar or engulfing pattern. The retracement levels provide likely spots for the pull-back to end, so seeing a pin or engulf form confirms a reversal could be nigh.
For the most part, trading pins/engulf at fib retracements is an easy system to use:
You draw a fib retracement on an upswing or downswing, wait for the price to return to one of the retracements levels, then enter a trade upon seeing an engulfing pattern or pin bar form.
Sounds easy, right?
Let’s go through a quick example…
So first of all, mark a fib retracement on an upswing or downswing.

To find the retracement of an upswing, place the tool at the lowest swing low of the upswing and then drag it up to the highest swing high, just as I have in the image above.
For downswings, it’s the opposite: place the tool at the HIGHEST swing high and then drag down to the lowest swing low.
Now you need to wait for price to return to one of the levels and see if a pin bar or engulfing pattern forms. The type of pin/engulf that must form depends on whether the retracement has been drawn on an upswing or downswing.
For upswings, a bullish pin or bullish engulfing pattern must form.
For downswings, a bearish pin or bearish engulf pattern has to appear.

In our example, price falls to the 50% level and rises, causing a bullish pin bar to form.
This pin provides some evidence the banks and other big traders are buying again, making it likely price is about to reverse and resume the uptrend, which it, of course, then does soon after.
So, that’s how you trade pins and engulfs at the retracements.
Another great setup you can add to your trading arsenal.
The Bottom Line
Picking a good trading system is one of the keys to successful trading. With the 5 systems listed here today, hopefully, you now have some ideas of which you might want to use or add to your own trading. Remember: give each system a whirl on a demo account before using it live.
Demo will give you a better idea of how the strategy works, and whether it’s suitable for your own trading, in a safe, risk-free environment. Saving you the headache of finding out later on during live trading.
The Next Step? Learn The 5 Rules For Trading Supply Demand Like A PRO Trader...
Take your trading to the next level. Sign up today to download my FREE E-Book and learn how the pro's trade supply and demand - Includes Order Block PDF and S & D Guide PDF