
“Pinpoint where banks are buying and selling.”
“Be ahead of the curve in the biggest reversals.”
Ever come across these promises?
If so, you’re in the right place…
I’ve got your back…
In world of Forex, “Supply and Demand trading” has gained a reputation as one of the most popular trading strategies. It combines the best elements of support and resistance trading with the timeless power of supply and demand.
What does this mean for you?
You get to:
“Pinpoint precisely when and where the banks make their moves.”
Today, I’m going to walk you through how to trade the Supply and Demand strategy.
Here’s a quick look at what’s in store:
- What is supply and demand trading, and how does it work,
- Why the conventional way of trading Supply and Demand misses the mark,
- How to identify and draw Supply and Demand zones accurately,
- The two ways to trade these zones,
Let’s dive straight into the guide…
Part 1: Supply And Demand Trading Explained
Before we get to grips with supply and demand as a strategy, let’s talk about supply and demand as a concept.
In economics, the law of supply and demand determines the price people pay for a product.
This law states:
When supply of a product is high and the demand is low, prices must fall to incite buyer’s interest; when the demand for a product is high and supply is low, prices must rise to represent the scarcity of that product.
Sound familiar?
Now Forex, as well as all other finanical markets, stocks, commodities, crypto, etc, are driven by the forces of supply and demand.
News events, economic announcements, and general market action make different groups of traders to buy and sell, causing changes to the supply and demand equation.
These changes manifest visually as the rises, declines, and consolidations on our charts.
- When price rises, demand outstrips supply.
- When price falls, supply outweighs demand.
- When price moves sideways, S & D are in balance.
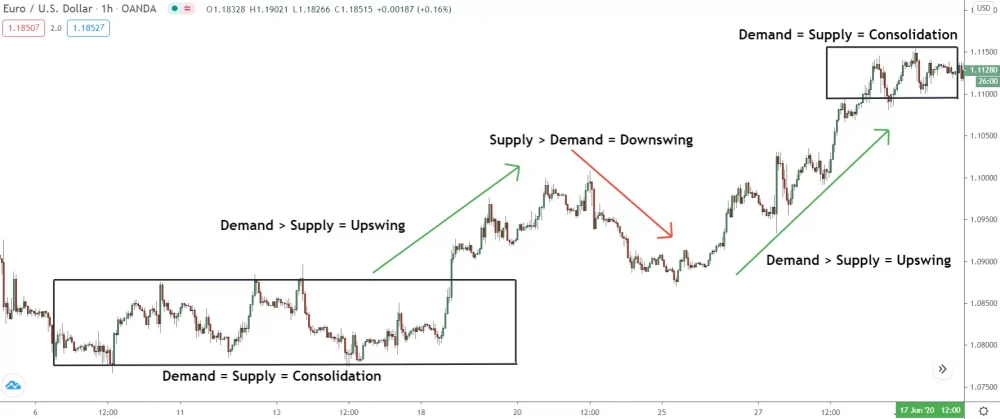
Observing the previous image, you can see how changes in supply and demand create price moves.
First: Supply meets demand, and boom – a consolidation forms! Prices move sideways for a while, then climb higher as demand increases.
Second: Suddenly, things take a turn, and supply starts overwhelming demand! A bunch of traders—or maybe just one big whale—decides to offload a massive chunk of EUR/USD, causing price to plummet!
Supply outstrips demand for a while, as more and more people decide to sell.
They see price fall, so decide to sell themselves.
Third: Demand comes in again, catapulting prices skyward , sparking a fresh upswing. This continues until more supply enters the market. With supply and demand now in relative balance, price moves sideways, and a tight consolidation forms.
It is a “play-by-play” commentary that goes on day by day, week, month, quarter, year, etc.
Cracking the Code: Why Do Supply and Demand Zones Form?
Pondering over the above, you might find yourself asking:
“What ties all this together?”
“Why and where do these elusive S & D zones crop up?”
And most importantly: how does this theory of supply and demand weave together a trading strategy, helping us predict where future trends might begin?
Well, here’s the thing… it’s not that complex!
It all boils down to what triggers shifts in supply and demand in the first place.
Here’s the deal: Supply and demand only changes when banks start buying or selling.
As retail traders, we don’t have the power to move the market! That power only belongs to the banks and other institutional traders, whose deep pockets and infinite buying/selling prowess can cause reversals and set off large trends.
But hold on, there’s a twist…
These market movers can’t enter all at once.
Their trades are too colossal!
With enormous positions to enter, the banks cleverly divide them into manageable portions, executing each trade separately at similar price points. This strategy sidesteps the risk of slippage, ensuring their subsequent entries don’t get placed at worse prices!
In effect, they enter a massive trade by placing smaller positions.
Cunning, don’t you think?
But here’s the problem:
These massive positions are such a handful that finding enough opposing traders to take the other side is a real challenge—even when broken down into bite-sized pieces!
Banks need thousands of opposing traders to execute trading actions:
- For buying, they require masses of sellers.
- For selling, they need masses of buyers.
So, here’s what they do:
- Place their initial positions using the available orders.
- Wait for price to return to the same point after the reversal.
- Enter their remaining positions to cause the main reversal.
On a chart, that process looks like this…
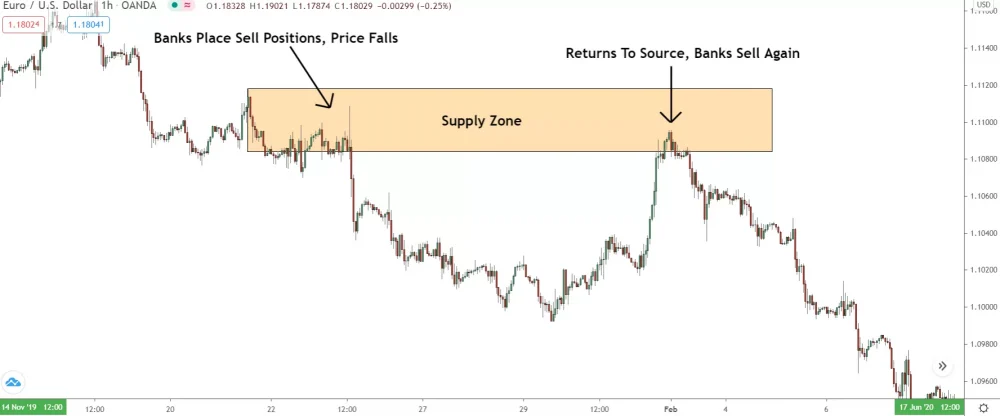
First: The banks place what positions they can, and price shoots away.
Next: Banks maneuver price back to the source, where they initially established their position. By doing so, they can add any remaining positions (trades) at a comparable price, essentially emulating the placement of a single, massive position in the market.
Then: The banks can allow price to fully reverse, and a large move ensues.
Using the supply and demand strategy, your job is to locate and trade these points where the banks enter their trading positions.
These are called: supply and demand zones.
These zones form at points where large price reversals take place, as the balance of supply and demand shifts changes from the banks entering massive positions.
Here’s a quick example…
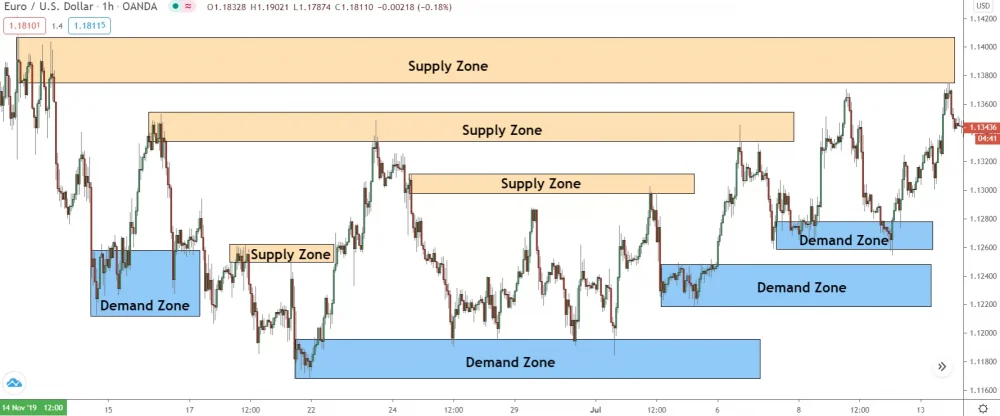
Price moves from supply zones to demand zones and back: over and over again.
This is supply and demand in action!
Supply And Demand: Understanding The Zones
Let’s go over the two zones now, so you can see how they work.
Demand Zones
Demand Zones represent points where the banks have placed a significant number of buy positions.
Think of these as the support levels of supply and demand trading.
Demand Zones form when the banks place a large number, or size, of buy positions. This creates excess demand, and results in the price reversing and moving higher.
The point where price reverses is the demand zone.
Key Characteristics Of Demand Zones:
- Historical Price Reversal: Demand zones often occur where price has previously reversed from a downtrend to an uptrend. This previous reversal suggests that the demand zone may be a point at which banks enter buy trades to make price reverse.
- Price Consolidation: Demand zones often coincide with areas of price consolidation, where price has moved sideways before a sudden increase in demand (buying) drove the price upwards.
- Volume: Increased trading volume can often be seen at demand zones as the increased number of buy orders leads to increased trading activity. However, this is not always the case, and a demand zone can still exist even if there isn’t a noticeable increase in volume.
- Support Level: A demand zone can act as a support level, where price struggles to fall below due to a concentration of buy orders. If price does break through a demand zone, it can be a bearish sign.
- Wicks into the Zone: Candlestick charts often show wicks entering the demand zone, indicating a rejection of lower prices. This demonstrates that each time price enters this zone, buying pressure overwhelms selling pressure and pushes price back up.
- Price Acceleration: When the price reaches a demand zone, it often rises quickly due to the abundance of demand and the lack of supply.
- Fresh Zones: The best demand zones are “fresh,” meaning price has not returned to them since they were created. Every time price returns to a demand zone, some of the demand (buy orders) gets filled, reducing the strength of the zone.
- Event-Based Demand Zones: These are formed due to a particular event such as earnings announcements, economic news, etc., causing a sudden increase in demand.
Supply Zones
On the other side of the fence, supply zones.
Supply zones indicate points where the banks place a significant number, or size, of sell positions – these are the resistance levels of S&D trading, points where price could fall.
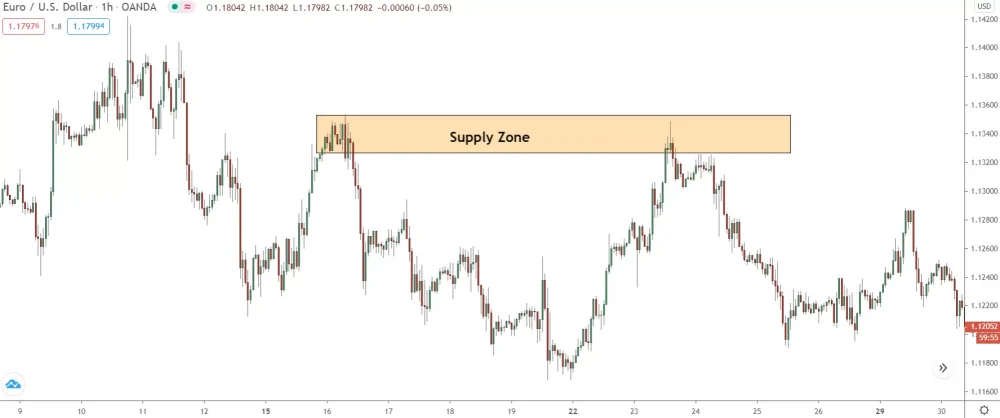
Supply zones form when the banks decide to sell a large amount of currency. The massive selling creates an excess of supply, which causes price to fall, creating the supply zone.
The point where price reverses is the supply zone.
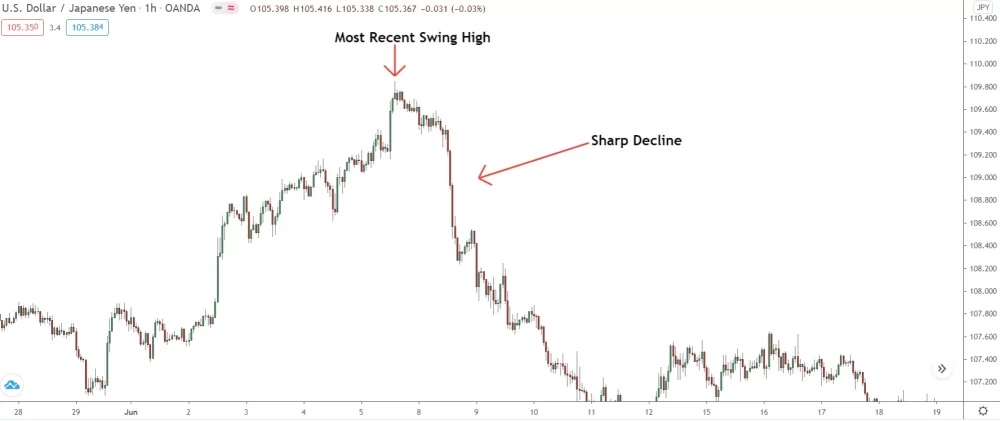
Pro Tip: 🌟 Want to find high probability S&D zones? Look for major swing highs and lows! Major swing highs and lows signal a massive shift point in the market – a tell tale sign the banks have entered significant positions, and created a supply or demand zone.
Key Characteristics Of Supply Zones:
- Historical Price Reversal: A supply zone typically refers to an area on the chart where the price has previously reversed direction from an upward trend to a downward trend. This historical reversal suggests that the area might be a point at which sellers enter the market in force.
- Price Consolidation: Often, supply zones are identified around areas of price consolidation. These are periods where price has moved sideways, suggesting a balance between supply and demand, before a sudden increase in supply (selling) pushed the price downwards.
- Resistance Level: A supply zone can act as a resistance level. If price returns to this level after a period of rising, it can struggle to break through due to the abundance of sell orders. If price does break through, it can be a sign of a strong upward trend.
- Wicks into the Zone: A supply zone is often characterized by candle wicks poking into the zone, reflecting a rejection of higher prices. These wicks indicate that every time the price enters this zone, selling pressure overwhelms buying pressure and pushes the price back down.
- Volume: In some cases, there might be an increase in volume at the supply zone, as the increased number of sell orders leads to an increase in trading activity. However, this isn’t always the case.
- Price Acceleration: Within the supply zone, or immediately after it, price often falls quickly. This rapid price decline represents an abundance of supply and lack of demand.
- Fresh Zones: The best supply zones are “fresh,” meaning the price has not returned to them since they were formed. Each time price returns to a supply zone, it consumes some of the supply, and thus the zone is weakened.
- Event-Based Supply Zones: These are formed due to a particular event such as earnings announcements, economic news, etc., causing a sudden surge in supply.
The Two Types Of Supply and Demand Zones
Although supply and demand zones serve the same purpose—areas where price might reverse—they can be classified into two types depending on whether they originate from a reversal or a continuation.
Continuation Zones:
- Rally – Base – Rally (RBR)
- Drop – Base – Drop (DBD)
Reversal Zones:
- Rally – Base – Drop (RBD)
- Drop – Base – Rally (DBR)
Continuation Zones:
Rally – Base – Rally and Drop – Base – Drop zones…
Form, when price moves in one direction,
Base, i.e consolidates or pauses, then
Continues in the same direction.
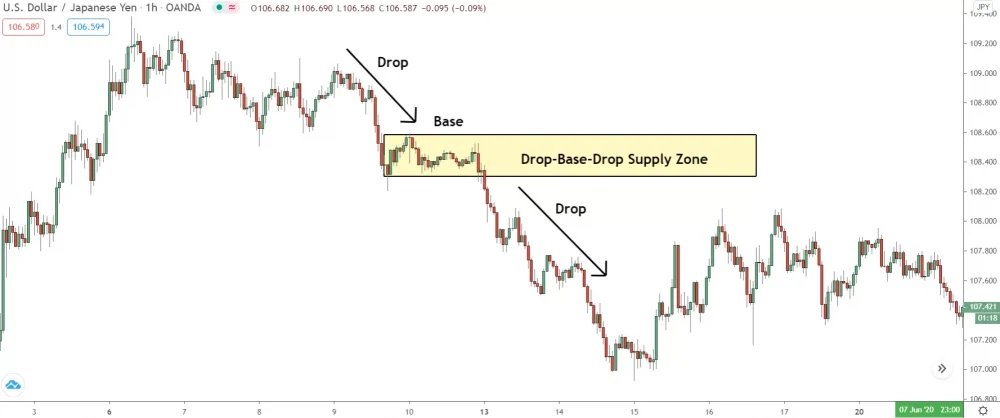
These zones always form mid-move, either from the banks taking profits or closing trades.
In contrast to reversal zones, continuation zones generally aren’t as effective. They develop from banks entering a limited number of positions in the market, meaning they lack the power of reversal zones.
Reversal Zones:
Rally – Base – Drop and Drop – Base – Rally zones…
Form, when price reverses direction,
Base, either by consolidating or pausing, then
Reverses in the opposite direction.
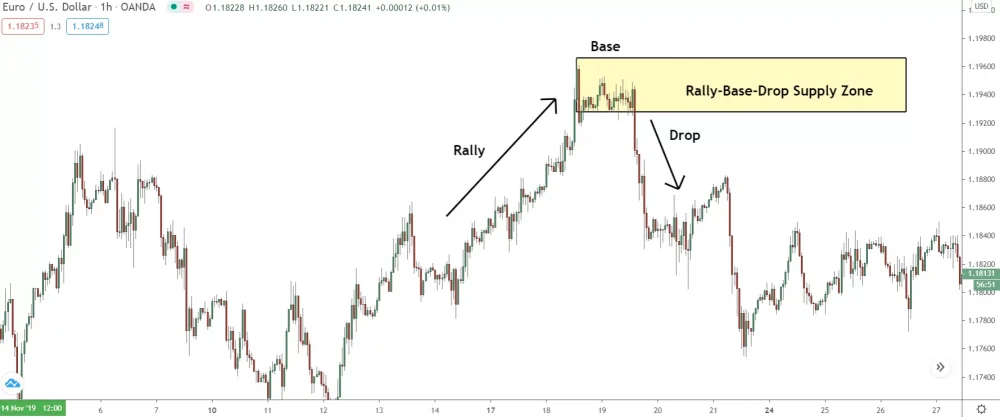
These zones form when one major swing changes to the other, usually caused by the banks buying or selling large quantities of currency.
Reversal zones are the ones you should be trading using Supply and Demand.
They’re the highest probability zones in the market.
Reversal zones are formed by the banks and other big traders placing huge buy and sell positions. These zones are much larger when compared to the much smaller positions they place to create continuation zones.
At the end of the day, don’t get too caught up on which type of zone you’re trading.
Starting out, your goal is to simply gain experience finding and trading zones.
Pro Tip: 🌟 Keep an eye on those reversal zones, but don’t let them consume you. Whatever type of zone you’re dealing with, what matters most is pinpointing the best zones and nailing their placement on your chart. That’s your ticket to success!
Once you’ve got a handle on that, you can start filtering the zones and only trading certain types.
Check my article, “The Two Types of Supply And Demand Zones,” for a more detailed overview of the reversal and continuation zones.
Unleashing the Power: How to Spot and Draw Supply and Demand Zones
Eager to conquer supply and demand trading?
You’ve got to nail finding high-probability zones and drawing them like a pro on your charts!
No worries—it takes time, practice, and experience, but with a couple of handy hacks, you’ll be breezing through it in no time!
We’ll start with finding the zones…
How To Find Supply And Demand Zones Like A Pro
Finding supply and demand zones might seem tricky at first.
Yeah, I get it… not the news you hoped for. But hold on! I’ve got a game-changing method that’ll make spotting zones a piece of cake!
Supply and demand zones form when the banks buy and sell large quantities of currency, right?
Well, what does that look like on a price chart?
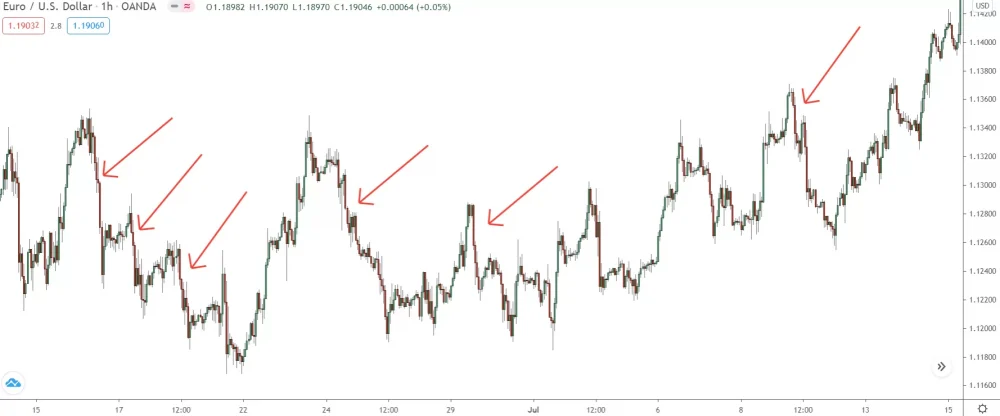
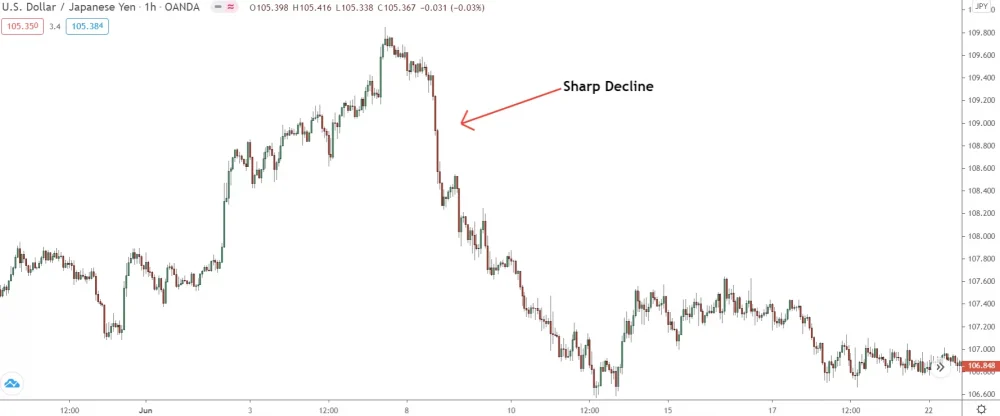
Typically: a steep rise, or a steep decline, appears in price.
So, to find supply and demand zones look for steep rises and declines in price.
These tell-tale signs reveal the banks buying or selling a large amount of currency, which means a massive build up of supply or demand must exist at the source of the rise or decline.
Let’s take a look…
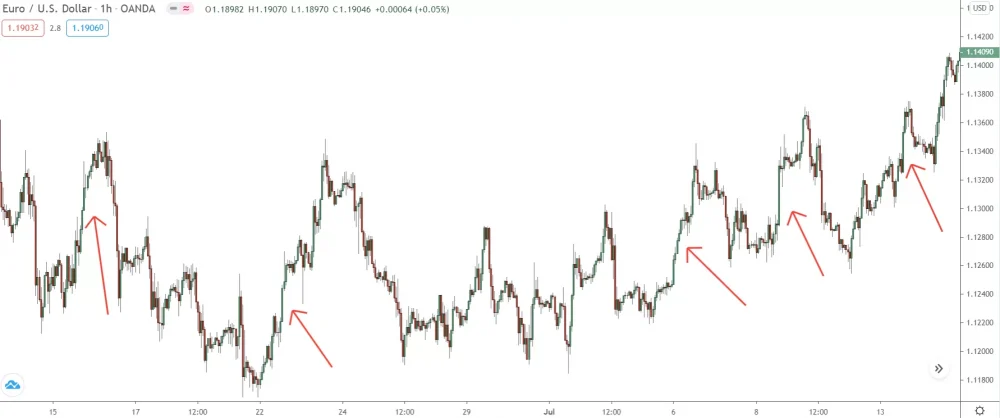
Check out the price rises above… see how steep they are?
Steep price rises only begin when a huge imbalance exists between supply and demand. Demand is outweighing supply in this case.
But what caused the imbalance?
Why did price suddenly shoot higher?
There are only 3 possible reasons:
- Banks buying to enter more positions
- Banks closing losing sell trades, which requires them to buy.
- Banks cashing in on their profits from a sell trade.
The banks can only cause price to rise via these three moves: buying, closing sell trades, or pocketing profits from open sell trades.
Each action demands a purchase, and while we can’t pinpoint the exact reason behind each rise (not just yet), we know these are only 3 actions that can cause a massive imbalance between S&D. Hence, that tells us any sharp rise must be a demand zone.
Does that make sense?
To locate Demand Zones, then, look for steep rises…
A steep rise reveals the banks decided to take action in the market, like enter major buy positions, which means price has a high probability of reversing once it returns to the source of the rise.
This is the demand zone.
Important: While steep rises (and declines) almost always indicate the presence of a demand or supply zone, many zones also form due to smaller, more shallow price moves too. Don’t dismiss these zones! They can provide high quality trades with massive R/R ratios.
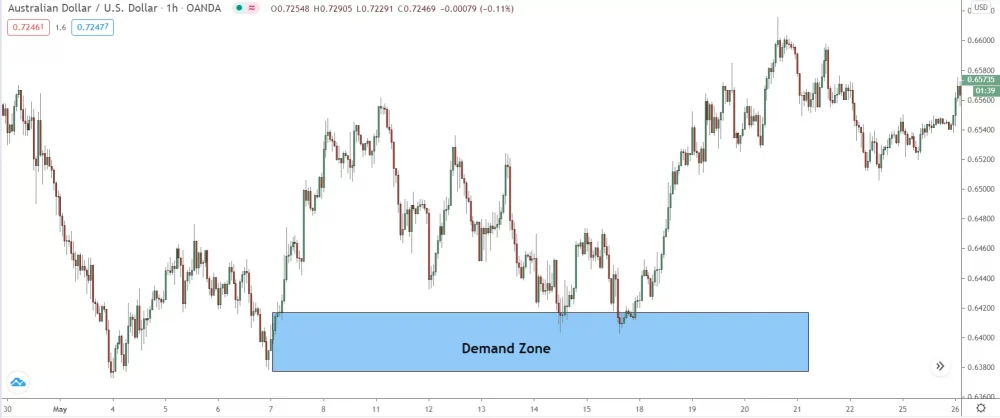
And with the zones marked, here’s how it looks…
")
See how accurate the zones are?
Every zone caused a price reversal or reaction.
Even with no reversal, price still moved away from the zone. That gives you a sense of how accurate S&D zones can be at predicting future price reversals.
ALSO: Notice how the zones are drawn from the swing base?
The base marks the point where demand exceeded supply and price shot up.
When drawing demand zones, which I’ll explain in a sec, always draw them from the base, down to the most recent swing low, to cover the area where the banks placed their buy positions.
Let’s switch over and look at Supply Zones now…
To find supply zones, follow the same process I explained with demand zones, only the other way around:
Rather than steep rises, look for steep declines.
Steep declines indicate massive supply (selling) has suddenly entered the market, which only happens when the banks sell. Again, for one of 3 reasons: selling to enter sell trades, selling to close buy trades, or selling to take profits from open buy trades.
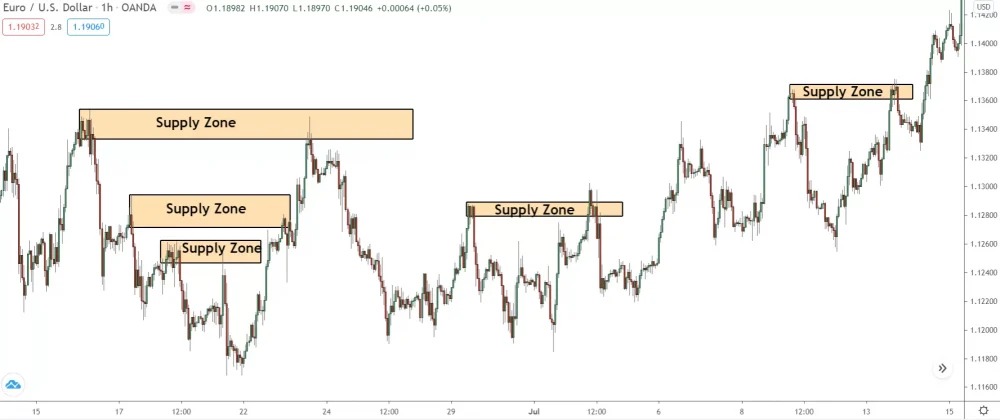
Again, almost all the zones cause some sort of price reaction.
Most result in a large reversal.
But, a couple only cause minor declines, which last for two or three hours.
It will take some practice to get good at finding the right zones, but if you follow these guidelines, you will pick it up fast.
Zone-In: Mastering the Art of Drawing Supply and Demand Zones
Pinpointing high probability supply and demand zones is crucial, but what you truly need to nail down…
Drawing supply and demand zones.
(This is where most traders tend to slip up)
Striking the perfect balance in marking your zone is absolutely key.
Get this wrong, and you’ll pay the price.
Draw an overly large zone, and you’ll be taking on a higher risk. You’d be spreading yourself too thin, covering more area than you should.
Go too small?
That’s a recipe for disaster.
Price might just miss the edge and reverse before it’s even touched the zone. You’ll be left in the dust, missing out on the reversal and the trade.
Sounds like a tough nut to crack, doesn’t it?
Well, here’s the good news – it’s not as tricky as you might think.
Mastering the art of drawing supply and demand zones is a breeze once you’ve got the knack.
Let’s delve into how to draw demand zones:
How To Draw Demand Zones
Drawing demand zones follows 5 simple steps:
- Identify The Base: Look for a significant rally in price. The area just before this rally is the base. This is where the banks entered buy positions to create the demand zone.
- Find The Base Candle: The candlestick that starts the rally is the base candle. It’s the last small candle that formed before price took off and formed the rise. The candle can be either bullish or bearish.
- Draw A Horizontal Line At The Base Candle Open/Close: The base candle marks where buying pressure overwhelmed selling pressure. For bullish candles, draw from the close. For bearish, draw from the open.
- Draw A Second Horizontal Line At The Most Recent Swing Low: The low represents the end of the demand zone. It’s where buyers stepped in and drove the price up, starting the rally.
- Examine The Area Between the Two Lines: The area between the two horizontal lines you’ve drawn is the demand zone. It visually represents where there was significant buying interest in the past.
- Watch for Price Retests: The demand zone becomes important when price approaches it again. A price retest of the demand zone can be an opportunity for a long position, as the banks may have leftover buy trades to enter that can drive the price up again.
Want a more detailed breakdown?
Here’s a quick guide…
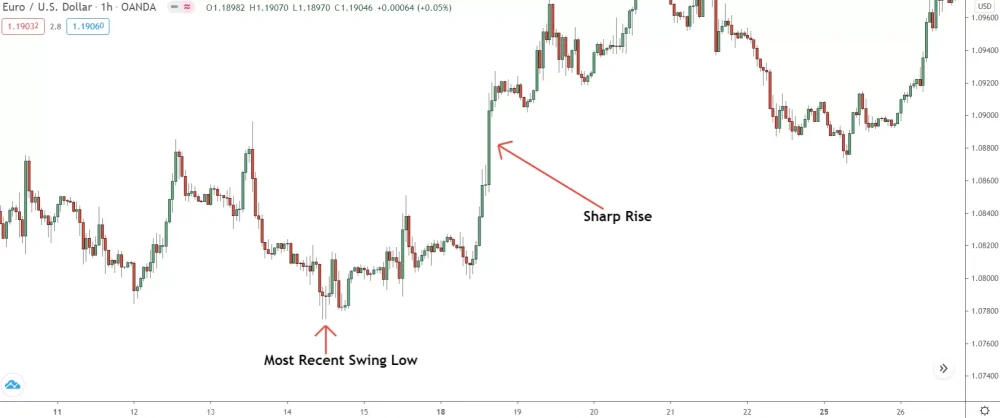
To draw a demand zone, find a steep rise where you think a zone has formed.
")
Yup, this rise seems good enough.
Now: Locate the source of the rise.
The source (or the base, as it’s known) is the price action that formed before price exploded higher and created the steep rise. This area of marks the point where the banks carried out one of the three actions listed earlier to cause the rise.
Why did they buy here and not during the rise?
Because in forex, buyers require sellers and vice versa. Banks can’t buy unless thousands of opposing sell orders are available, which only happens when most traders are selling. So, banks don’t buy during the rise, they buy when price falls during the base. That’s what creates the lows inside base area.
If the banks still have positions left to place, they will bring the price back to this point. You need to cover it with a zone large enough to ensure price reverses within it.
To draw this demand zone:
Open the rectangle tool from the tool menu, and place the rectangle on the MOST RECENT MAJOR SWING LOW that formed at the source of the move.
Technically, the swing low represents where the banks placed their buy positions.
It’s the point where the market looked super bearish to everyone, meaning the banks had thousands of willing sellers ready to take the opposite side of their buy positions.
Pro Tip: Can’t find the most recent major swing low? Look for the lowest low that’s formed since price changed direction and started rising. That’s usually the low to draw the demand zone from. Simple!
The banks need sellers to buy from; remember, this is the key: opposing orders.
However, we can’t just mark the low; because, buying came in above as well.
So, here’s what we look for:
Leave the bottom edge of the zone on the low, and
move the top edge up to the LAST SMALL CANDLE that
formed before price shot upwards and created the first big bull candle.
- If the small candle is bullish, mark it to the close.
- If the small candle is bearish, draw it to the open.
If drawn correctly, the zone should look like this:
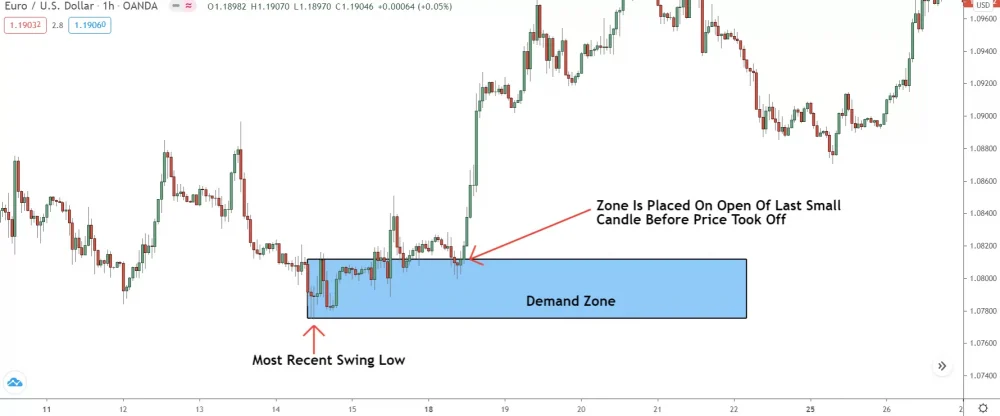
The lower edge should sit on the most recent major swing low.
The upper edge should rest on the last small candle before the first big bullish candle appeared – a small bull candle in this case.
Can’t figure out which small candle to draw the zone from?
No problem!
Draw the zone from the low to the point where price first breaks higher.
Nine times out of ten, that will suffice as a valid zone.
Your risk might be a tad higher, since the zone’s not exactly a perfect fit. But it should still deliver a solid trade if price reverses.
On to supply zones:
How To Draw Supply Zones
Drawing supply zones follows the same process as demand zones:
- Identify The Base: Look for a significant decline in price. The area just before this decline is the base. This is where the banks entered sell positions to create the supply zone.
- Find The Base Candle: The candlestick that starts the decline is the base candle. It’s the last small candle that formed before price dropped and formed the decline. The candle can be either bullish or bearish.
- Draw A Horizontal Line At The Base Candle Open/Close: The base candle marks where selling pressure overwhelmed buying pressure. For bullish candles, draw from the close. For bearish, draw from the open.
- Draw A Second Horizontal Line At The Most Recent Swing High: The high represents the end of the supply zone. It’s where sellers stepped in and drove the price down, starting the decline.
- Examine The Area Between the Two Lines: The area between the two horizontal lines you’ve drawn is the supply zone. It visually represents where there was significant selling interest in the past.
- Watch for Price Retests: The supply zone becomes important when price approaches it again. A price retest of the demand zone can be an opportunity for a short position, as the banks may have leftover sell trades to enter that can drive price down again.
Still not sure?
Here’s how to do it:
First, find a big decline where you think a supply zone has formed.
As with demand zones, you always draw supply zones from the base or source of the move.
That’s the point where the banks placed their sell positions.
If the banks still have positions left to enter, they will bring price back to this point to place their remaining positions at a similar price before causing the reversal.
Once you have found the source:
Place the rectangle tool on the most recent swing high, drag the opposite edge down to the LAST SMALL CANDLE that formed before price fell and created the first big bear candle in the down move.
- If the small candle is bullish, mark it to the close.
- If the small candle is bearish, draw it to the open.
With the zone drawn, here’s how it looks…
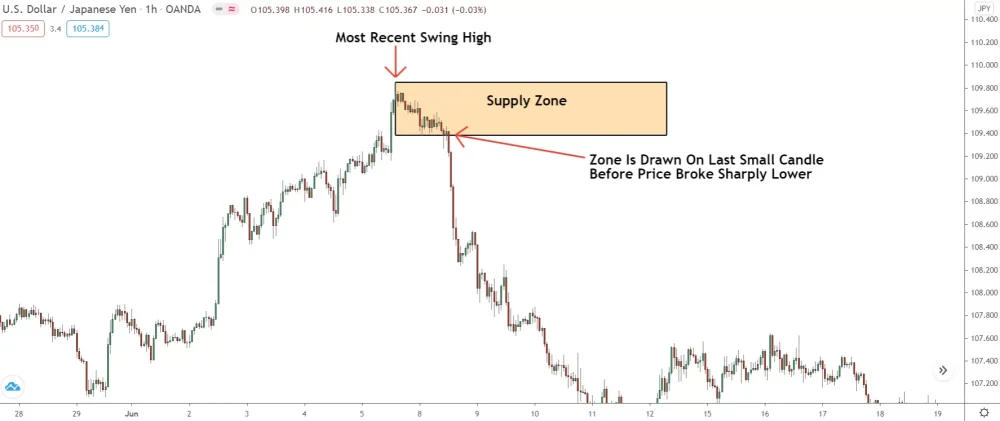
See how the top of the rectangle rests on the swing high?
And how the lower edge sits on the open of the last small candle before price fell sharply – a bear candle in this case?
Again, if the price action gets too confusing and you can’t figure out which candle is the small one: draw the zone from the high to the point where the decline really takes off!
Look for the first big candle in the decline.
That will give you a valid zone, just with a slightly bigger risk due to the increased size.
And with that, you’re all set!
Trading Supply and Demand Zones: The Key to Unlocking Consistent Profits
As trading strategies evolve, new ways of trading them get created. Sometimes these ways work better than the previous methods or better suit a particular style of trading.
Supply and Demand has also gone through this process, and today, there are TWO different ways of trading the zones…
Price Action entry, and Set and Forget entry.
Sound familiar?
Each method has pros and cons, and it is possible to be successful with either.
I have made money with both in my time trading Supply and Demand.
Let’s go over each method now, so you can see how they work.
Set and Forget Entry
Sam Seiden’s famous “Set and Forget” entry is most traders go-to method for trading supply and demand zones.
It’s the simplest, most widely-taught technique.
With set and forget, you trade S&D zones using limit orders.
By placing a limit order at the edge of the zone, when price returns, the order will execute and put you into the trade.
- The upside – you’ll never miss a reversal, which can happen from time to time with Supply & Demand.
- The downside – price may just blast through the zone, causing you to lose money, which happens a lot!
Here’s a quick example…
Start by marking a zone on the chart.
Found your zone?
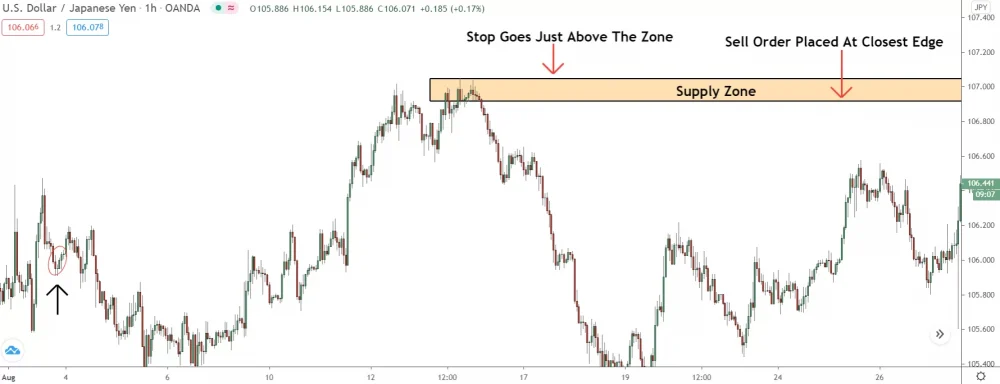
Great, now place a limit order at the edge nearest the current price.
For price to reverse from the zone, it must breach the closest edge. either by spiking through or by moving in via normal price action.
With the entry placed, now put a stop loss at the opposite edge.
Keep in Mind: Always set your stop just beyond the zone’s edge—leave a tiny buffer between the edge price and your stop price for added security! 💡
Now, see what happens…
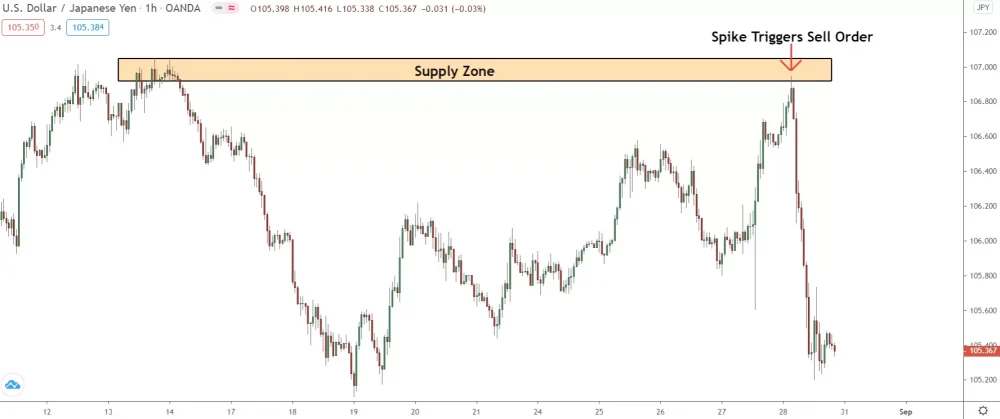
Nailed it!
The trade soared – price shot up, tickled the upper edge (activating our order), then reversed and moved lower.
A great trade, in anyone’s book.
All in all, the limit order entry can be a great way of trading supply and demand. I used it for a long time, and the results were pretty decent.
The problem?
Set and forget is flawed in a way the price action entry simply is not.
Sooner or later, you will get tired of this issue cropping up over and over again.
More on this in a minute.
First, let’s go over that price action entry.
Price Action Entry
My preferred way of trading supply and demand, and the method most pro traders use. Price action has you enter S&D trades using two common candlestick patterns:
- Pin Bars
- Engulfing Candles
Rather than place limit orders, you wait for candle patterns.
Look for pin bars or engulfing candles to form inside a zone and then enter. These price-action candles indicate the banks are interested in making price move away.
So, the price action gives you more confirmation price will reverse.
Here’s how it works:
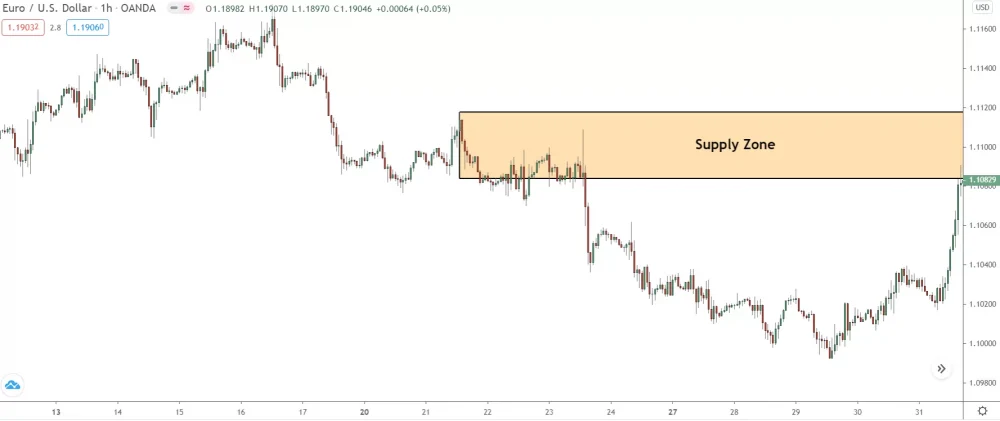
Find a zone and mark it on the chart using what I explained earlier.
Now with the price action entry, you must wait for price to enter or touch the edge of the zone BEFORE entering.
You want evidence price will reverse in the form of a pattern before entering a trade.
That gives our trade a better chance of being successful and making money.
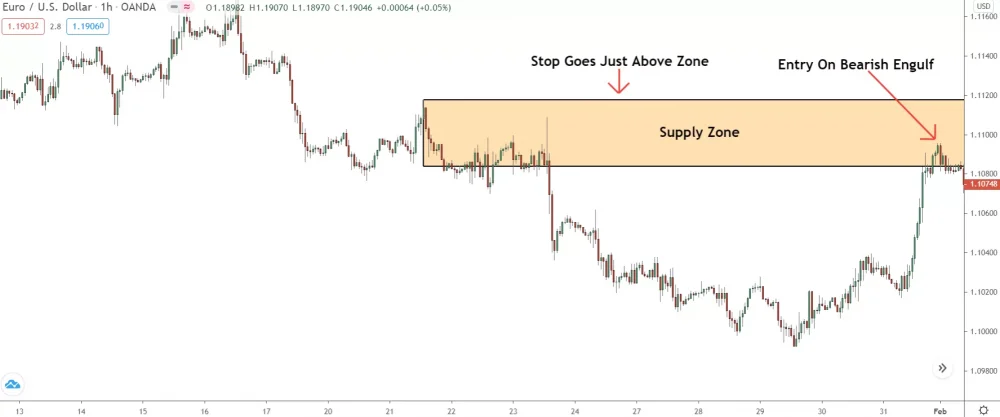
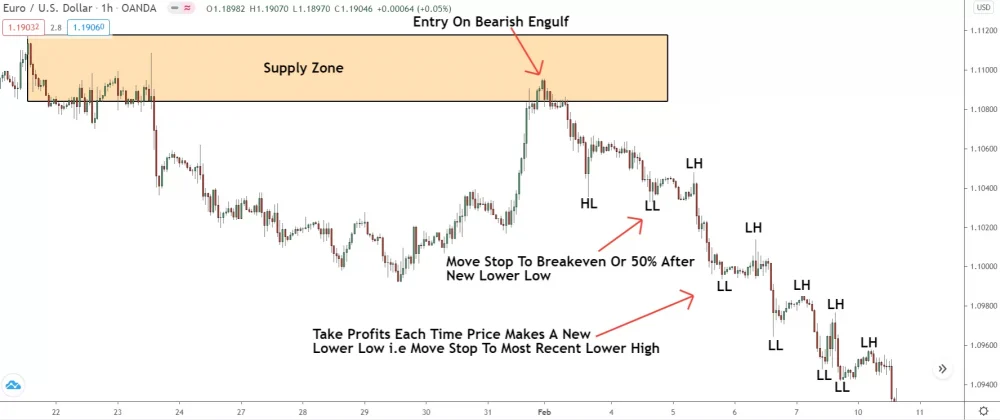
A bearish engulfing pattern forms soon after price enters the zone.
This is our signal to get in.
The engulfing pattern confirms the banks likely want price to reverse, so it provides confirmation a reversal is in the works.
Pro Tip: You can use pin bars for the entry, too, but in my experience, engulfs tend to work better. If you plant to use pin bars, make sure the candle has a long wick with small body. The bigger the wick, the better entry signal the pin suggests.
With the entry ready, place a stop above the zone.
Price could still rise and reverse from much higher inside the zone. This happens from time to time.
Now, wait and see if price reverses.
And, in this case, it does…
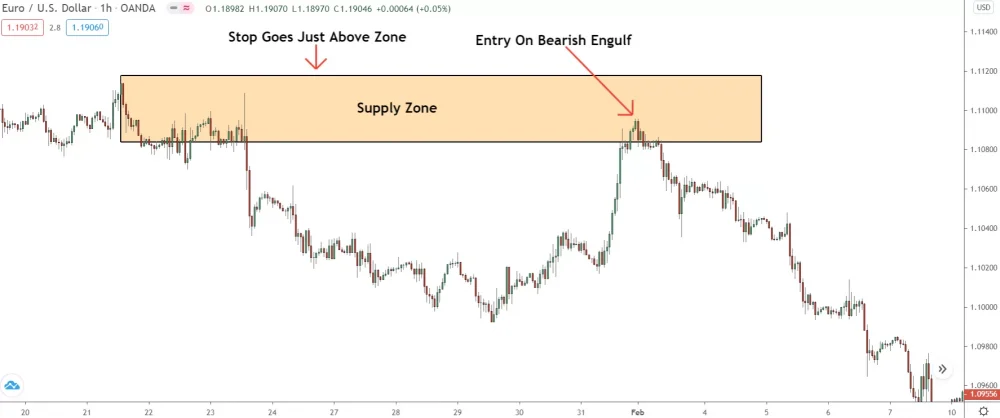
A few hours after the bearish engulfing appears, price exits the zone.
Now our next task is to:
First: Lower the risk by moving our stop to breakeven.
Then: Take profits as price continues to fall.
Taking profits really comes down to personal preference.
I prefer taking profits whenever a new swing forms in the market: a lower low for a short position, or a higher high for a long one. When I spot a new high or low, I adjust my stop to the new low (or high if I’m in a short position) of the swing that triggered the market’s new higher high or lower low.
No matter the technique, as long as it’s secure, it’s good to go.
The newest swing marks where the banks entered their most recent positions – the chances of price breaking past this swing, are extremely low.
So, in our example, I would take profits like this…
I also use the same method to move my stop to break-even.
When I see price first make a new higher high/lower low, I will move the stop to the low/high of the swing which was created from price making that new higher high/lower low.
That way, I reduce risk AND secure profits.
Why The Price Action Entry Is Better
I’ am’m not going to knock the set and forget entry too much, because it is a decent way of trading supply and demand, and you can be quite successful with it. I will attest to that.
When it comes to trading the zones, however, you need to stick to using price action.
The problem with using limit orders:
Confirmation.
The limit order entry provides NO confirmation price will reverse from a zone. You blindly place orders at zones and hope price reverses. If every zone was successful, this wouldn’t be an issue; But, that’s the thing, they aren’t!
Price blasts through zones frequently, usually without stopping.
With the limit order entry, you cannot avoid this.
So, you end up with a crap-ton of losing trades.
With the price action entry, however, things are different.
You must wait for a pattern to form inside or at the edge of the zone before placing a trade. This confirms the banks want price to reverse, which allows you to avoid zones where price just blows through.
Even so, the PA entry isn’t fool proof…
Zones can (and will) still fail even with the right price action entry.
But it still stands as a far better, safer way of trading the zones.
So, the point is clear:
Stick to trading supply and demand with price action.
Trust me, it’s
Trade Like a Pro: 3 Must-Know Rules for Supply and Demand
Now you know how supply and demand works and the two ways you can trade the zones (and which way is better).
You are ready to begin using the strategy in your trading.
But wait, not so fast… there’s more…
Before you start trading Supply and Demand, there are a few key rules you need to understand to find the right zones on the chart and trade them correctly using your amazing new entry method.
Here’s what they are…
1: Old Zones Rarely Work, Avoid Old Zones !
Suppose you look up supply and demand trading on the internet.
In that case, you’ll find that most experts claim that old zones have an equal chance of success as new zones.
I am going to tell you right now, that is complete hogwash!
THE FACT IS:
It is one of the biggest lies in the supply and demand community. And if everyone would stop and think about it for a minute, they would understand why makes no sense!
Supply and demand zones are formed by the banks:
The banks need to be buying and selling with huge orders.
The banks cause the zones to form by placing a few positions.
The banks make price return to get the rest of their orders placed.
Then, and ONLY THEN, can the banks set off the reversal.
That’s why price returns and reverses from the source of steep rises and declines.
Now, here is my problem with the idea of old zones causing reversals. If the banks want price to return to a zone, whether to place trades, close trades, or take profits, they would want it to return quickly, relative to the timeframe they are trading.
The banks would NOT want to wait weeks, months, etc!
The reason for entering may change.
I mean, think about it…
If a bank bought 50 million EUR/USD, and still had 50 million to buy at the same price, would they really wait another 3 months for price to return to the same spot!
Of course not, the whole market could have changed by then!
For one: the price action will have changed.
Second: the economic situation would also be different, and possibly not in their favour.
Plus: the orders entering the market might not be enough to fill their remaining positions.
So, it does not make sense the banks would wait a long time for price to return to a zone to get their remaining trades placed.
Really, they would want price to return ASAP.
The quicker they get their remaining positions placed, the less chance something could happen and change their outlook on the market: be it economically, price-action based, or something else, like maybe a pandemic.
Don’t trade old supply and demand zones:
they just DON’T work.
You will often see price reverse from old zones, yes. But, it is not the zone causing the reversal. It is probably some other technical factor.
It could be a:
- Support & Resistance level,
- big round number,
- economic announcement, or
- any number of other triggers.
Follow these guidelines to know when an old zone’s usefulness expires:
1. Daily zones = 90 days
2. Hourly zones = 20 days
3. Less than H1 = 1 day.
2. Always Put Your Stop Slightly Outside the Zone
You probably already know this; but, I thought I would put it in since it is a mistake I see many new supply and demand traders make all-too often.
Always put your stop slightly above or below the opposite zone edge.
DO NOT put it on the edge itself to skimp on the risk.
It is all- too-common for price to spike through the edge of a supply or demand zone before reversing. If you put your stop at the edge rather than leaving a slight gap, the spike will take you out and make you miss what could be a successful trade.
You can see that happen here…
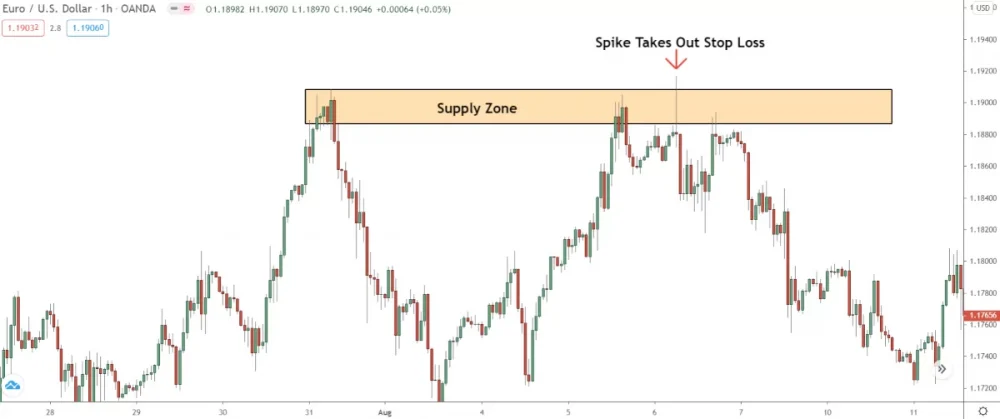
Just when it looked like price was about to reverse from this zone, price spiked through the upper edge.
Bye, bye stop loss!
To add further insult, price reversed soon after. You missed out on a great trade AND lost money. Talk about a bad day at the office.
SO: always leave a small gap between your stop and the edge of the zone.
How big should that gap be?
Well, it’s relative to the volatility and time-frame.
Higher Time Frames = larger gap, in pips, due to size difference.
In my experience, 15 – 20 pips should be sufficient for most zones.
Add a few pips for higher time-frame zones: think 4-hour, daily. Remove a few for low time-frame zones: 5 minute, 15 minute, etc.
That should give you headroom to avoid any random spikes while still keeping risk low.
3. Zones Cannot Cause Multiple Reversals Like S&R
Another big mistruth in the supply and demand community revolves around the idea zones have the power to cause reversals more than once like support and resistance levels.
And again, this is not true, not even close.
Supply and demand zones are ONE TIME USE: Not two times, or three times, one time ONLY.
Once price hits a zone and reverses, that’s it!
The zone loses its power and validity.
The probability price will reverse again in the future is extremely low.
The only exception to this rule: Zones created at the top or bottom of a consolidation. These zones can cause price to reverse two or three times. The banks are buying/selling from similar points, so price may reverse from a zone more than once before the consolidation ends.
However, once the consolidation terminates – the zone loses all its power and probably will not cause another reversal.
So, why don’t S&D zones generate multiple reversals?
If you think about why a zone forms, It is obvious why they lose power after one touch.
Remember: the banks cause supply and demand zones to form because they cannot place all their positions in one go. They have not been able to place/close all their trades or take all their profits.
Soon after placing what they can, they bring price back to the zone to enter their remaining positions. Once placed, the banks can make a similar amount from each position as well as keep their risk at the same level.
With this in mind: Why would the banks want price to return a second or third time?
After bringing price back a first time, why bring it back again?
They would only bring it back the first time if they knew enough orders were free to get their remaining positions placed.
Therefore: It’s pointless to bring it back more times.
See my point now?
Price will return and reverse from the odd zone more than once, but not often. And usually it’s down to some other technical factor that has nothing to do with Supply & Demand.
For this reason, only trade free/untouched zones.
FAQ And What to do Next
I’ve been crushing it with the supply and demand strategy for ages now, and it’s at the heart of my trading approach.
Of course, I can’t fit all the details about supply and demand trading in just one piece. So, I’ve got a lineup of awesome Supply and Demand articles for you right here, to level up your trading game from what you’ve learned so far!
These articles cover all the bases of supply and demand.
You will learn:
- How to find the highest probability zones,
- Why the normal way of trading S & D (a la Sam Seiden) doesn’t work,
- The biggest mistakes to avoid,
- How to draw the zones correctly…
- AND many other important aspects of a total trading regimen.
Check out my video course too…
This will detail everything you need to know when trading supply and demand.
I’ve also left a small FAQ containing the most common questions people ask about supply and demand at the bottom… Check it out if you have any questions about S & D – or leave a comment if your question isn’t answered.
3 Key Facts Sam Seiden Gets Wrong About Trading Supply And Demand

While Sam Seiden gets credit for coming up with Supply and Demand, many of the ideas he promotes about the strategy are flat out wrong and at odds with how the market really works.
In this post, I detail the 3 most important facts, and explain why they don’t make sense in the market…
Why You Should Avoid Rally-Base-Rally/Drop-Base-Drop Zones

Supply and Demand zones come in two flavours.
These two types of zones perform very different to one another due to what causes them to form. However, most traders don’t realize this… they mistakenly assume both zones form for the same reason.
I’ve written this article to explain why they don’t, and why you should stick to only trading one type of zone if you want to see good results.
Profit Taking Zones Vs Trade Placing Zones: What’s The Difference?

On top of two types of zones, they can also form for two different reasons: either the banks placing trades, or taking profits off trades. Each type of zone has its own quirks and characteristics which, if you know, can help you trade them and make fewer mistakes
To learn what these are, check out my profit-taking zones vs trading placing zone post.
Don’t Make This Mistake Drawing Supply And Demand Zones

Drawing zones correctly is the #1 skill to learn in supply and demand trading, but many traders make a simple mistake that causes them to draw the zone the wrong way: They don’t include the nearby points where price reversed.
When you fail to incorporate the nearby rises or declines when drawing the zone, you end up missing trades that otherwise would have been successful.
To avoid this, make sure you read my post below to draw the zones correctly.
Frequently Asked Questions About Supply And Demand Trading
Q: Who Invented Supply And Demand Trading.
A: Sam Seiden – a well-known forex guru.
Sam came up with S&D when working as an order runner on the Chicago Mercantile exchange. His story is interesting, which we haven’t got time to explain here, but not everything Sam claims about supply and demand is technically correct.
Check my Sam Seiden post for a detailed breakdown.
Q: Do The Banks Trade Supply And Demand?
A: No, but they do create the zones.
The banks create supply and demand zones by entering significant trading positions. In other words, they don’t trade the zones; they ARE the zones! So we use the S&D strategy to identify when and where they’re buying and selling to piggyback their trades.
Q: Is Supply And Demand A Smart Money Concept?
A: Yes, of course!
Smart money is the banks and other big insitions that create supply and demand zones. So while we can’t monitor the smart money directly, their actions and decisions still manifest as the price action we see on our charts as supply and demand zones.
Hence, the zones are a critical smart money concept.
Q: Is Supply And Demand The Same As Support And Resistance?
A: No, but they are similar.
Support and resistance are price levels where price could reverse. Supply and demand, on the other hand, are price zones where price may reverse. It’s a slight difference, but a big one. Additionally, S&D zones form due to the institutions – banks, hedge funds – entering major trading positions.
Support and resistance levels are simply points price has reversed multiple times in the past.
Q. How Long Will It Take To Find/Draw The Zones?
A. With practice, not too long.
Spend some time finding and drawing old zones. That’ll give you a good sense of how to draw them and what the quality zones look like. Over time your skills will improve until finding and drawing the zones will eventually become second nature.
Q. Can Zones Cause Multiple Reversals, Like Support And Resistance?
A. No, supply and demand zones are one-time use.
Sometimes you’ll see price reverse from a zone after it’s reversed once, but these zones typically form at the top and bottom of consolidations, so they are okay to trade. For all other zones, though, only take the trade the first time price returns to a zone.
Q. Is Supply And Demand Trading Profitable?
A. If you learn from the right places, VERY profitable.
However, most supply and demand gurus don’t know what they’re talking about. Some can provide quality info, but most possess limited knowledge of how the zones work. So if you learn from these guys, expect heavy losses.
If you learn from the people who use them in their trading, you should have a decent chance of becoming profitable.
Thank-you for your attention,
PAN

Grab Your FREE E-Book:
5 Pro Rules For Trading Supply And Demand
- Master the core principles of supply & demand.
- Advanced techniques for trading SD zones.
- Exclusive new lessons/books/tools every week!
Sign Up Now To Download Your FREE Guide:
🛡️ Spam-Free Promise: No spam, ever. We'll only send you relevant updates and content. Unsubscribe at any time.
so. for the entry signal
we should go down to lower timeframe to find or just stay the current timeframe we trade at
Hey Marvin,
Stick with the timeframe you trade off for now. You can use a lower time-frame but I need to explain it more, as there are a few things you need to be aware of. I’ll try to get a guide about it out in the next few weeks.
Hey Liam,
this is piece of art. I already read your S/D book and all articles from old web, but this is again eye open in another way. I have again some ideas how to read price.
Thanks
Glad you liked it Lucky.
Got some more S + D posts on the way. Keep a lookout for them over the next couple of weeks.
one more question. what about the profit taking lvl, I am little confused with it
thx
Hey Marvin,
The profit-taking level should be the closest zone on the higher time-frame. So if you trade off the 1 hour, you need to take profits once price reaches the next zone on the daily. If you trade off the 1 min or 5 min, take profits once price reaches the 1-hour zone. Don’t take profits right away, though. Wait for signs of a reversal first, and then take profits if you see something developing.
Great post, you have taught me how to draw supply and demand zones. I have more idea now how to draw these zones.
Great, glad to hear Sbo!
Let me know if you need anything else.
Thanks for your guidance in S&D. you enlighten me of some points as i am trading this method already. appreciating your efforts.
Thank you very much for making me know s/d zone but how do you identify it
No problem, lucky. Happy to help 🙂
Hi great article! I just found about this website and it is really helpful. Do you have any tips about profit-taking strategies you use? Do you take some profit at the first trouble area or do you just wait for it to hit the target? I have been having an issue where I tend exit the trade pretty early so I usually only earn around 2Rs per trade. I feel like you never know if the price is gonna reverse at the first trouble area. Did you ever has this issue when you were learning?
Like!! I blog frequently and I really thank you for your content. The article has truly peaked my interest.
Hello,
Can you please explain more about the curve? I trade the daily time frame and using H1 for confirmation when the price reaches the daily zone.
Hey Mandala, Liam here.
To be honest, I don’t really use the curve concept in my trading. I understand it is a part of supply and demand theory – the economic concept of S & D, I mean – but for trading, I just don’t think it adds anything valuable. It kind of narrows your view of the market and what zones are important, I think.
Much better to just concentrate on figuring out where the strongest zones are – zones created from the banks placing big trades – and then trade off of that, rather than focus on what the overall curve is, which may cause you to put more importance on zones that aren’t that important if that makes sense?
Liam.
quick question. for test demand zone which candle must be appear red or green candle . what if whole candle touch the demand zone without wick on distal line ,does it consider rejection? if i saw demand zone in Day chart , still i have to go small time frame or not. when should i go small time frame ? your expedite reply would be wonderful. thank you
It can be red or green, Roshan, doesn’t matter which. The candle must touch the edge of the zone to signal a rejection, that’s the most important thing. If it doesn’t touch the edge, it’s not classed a proper rejection, just a normal spike. As for daily zones, you can drop down to a lower timeframe if you want, it depends on your preferences really. I like to drop down to lower risk, but you can stay on your normal timeframe too – it’s up to you, really.
Please what is your take on this?
I trade zones if price returns within:
5 min TF = 2 hours of zone creation
15- 30 min TF = 6-8 hours of zone creation
1 Hour TF = 24 hours of zone creation
Daily TF = 1 month of zone creation
Weekly TF = 1 year of zone creation
Try these instead, Steve:
1 min/5 min/15 min – 1 day.
30 min/1 hour/4 hour – 20 days
Daily – 3 months
I’ve tested these myself going back quite a few years, and they seem to work really well. Just give a little leeway with the times; you don’t need to be super specific, e.g if a zone forms 1 day over the daily TF time, that’s still a valid zone. You can’t be exact with things like this, so you have to allow for a little variance with when price should return.
I’m very grateful sir. You’re doing a great job
Hi Liam,
Would like to know if S & D zones could be traded at anytime of the day, i.e. Asian, London & New York market hours. Thank you
Yes, you can trade them at anytime, Steve. The time of day doesn’t matter, only whether the zone is strong or not.
Noted with thanks sir
Hi Liam
thank you for the quality lesson above . your material has proven helpful for me and i change my whole perspective on trading.
please see “How To Trade Supply And Demand On The Daily: Full Guide + What You Need To Know” as the page does not open
thank you
Would Like To Know If You Have Written The Guide On Using The Lower Timeframe To Enter S&D Zone … And the guide on how to trade S&D zone daily
I haven’t got a guide on entering using a lower timeframe zone, Esther – I’ll try to get something out in the near future. I have got a guide on trading S & D on the daily, though…I took it off the site as I’m going to re-purpose it for another post, but I’ll send it over to you so you can read it.
Cheers,
Liam.
Hello PAN,
I have searched your site to see if you have ever written any articles relative to identifying “Fresh” zones of S/D and can’t seem to find any. If you have written information on the subject can you kindly point me in the right direction so that I may read your input?
Additionally, does the daily average range play a role in your strategy?
As mentioned before, I enjoy your site and believe that its content is going to provide hours and hours of reading and hopefully results in my becoming a better trader.
Presently I am demoing and although not consistently profitable I am pretty much B.E. Breaking even isn’t the way I want to go. Studying your material has brought a new understanding of how the market is really set up to make me lose money.
If I can figure out how they plan to do it the better off I’ll be. I purchased your Zero Sum Fun book and it is opening my eyes even further.
Regards,
I don’t have any articles on identifying fresh supply and demand zones… but I’ll try to get something out in the near future.
Got my hands full at the minute!
My Main Strategy: Pinpoint zones around major swing highs and swing lows.
Every swing high or low forms due to the banks either taking major profits off their trades or placing significant trades to cause a market reversal. Price has a much higher probability of reversing at zones formed from these swings compared to zones which form in the middle of moves—(rally-base-rally or drop-base-drop zones).
As for the Average Daily Range (ADR), it’s not a primary tool in my strategy…
I sometimes use it to gauge the potential limits of market movement during a given day.
I’ll try to explain it further in some upcoming articles. The ADR you’ve noticed in my screenshots isn’t the best, as it only displays data for the past 20 days… I really need an ADR with more customization, showing the ADR for the past 5 days, 10 days, and so forth.
Hope this helps,
PAN.
Good afternoon,
I hope all is well with you!
I had last week received my free S & D trading booklet – of which I found very useful!
However, I have 2 questions for you:
1. In order for a Supply or Demand zone to be considered tradeable, does the candle-stick that follows have to fully engulf the one beforehand?
2. Do zones expire once they’ve been hit and ‘used’ once? For example, say price moves into a Supply zone and then begins to move back DOWN out of it. If price then moves back up into this zone, is this zone still considered to be tradable, or would you consider it to be expired?
I have been experimenting lately with a variety of strategies, finding that some work better than others, am interested to see how this one works!
Regards,
Hi Pan,
Thanks for sharing your experience. Sam talks a lot about staying outside of fair value but doesn’t give much away on what rules he uses to identify fair value except for it’s where the majority of trading is taking place. Just wondering what your experience is with fair value and if you consider it at all?
Thanks,
Daniel
Hi,
I find your explanation on the S&D very interesting and it was different from what i have learned. May i know are you still using this S&D to trade currently? Btw, is all course content updated and applicable to current trading environment? What other courses you are teaching other than current courses found on this website?
Regards,
Ben