
Supply and demand zones can identify mega reversal trades, but like all technical concepts, the success rate of zones can be improved further.
How?
By watching for the zones to form at specific technical points .
Or, in other words: by watching for confluence.
Confluence occurs when multiple technical indicators or levels coincide at a specific point on a chart, reinforcing the significance of that particular price level or area.
For example:
If support level falls in-line with a demand zone, that’s confluence.
The level occurs at the same location, which heightens the likelihood of a price reversal due to the convergence of two factors at that specific point. Numerous confluence points can be employed in conjunction with supply and demand zones, including:
- Fibonacci retracements.
- Technical indicators.
- Support and resistance levels.
However, there are 3 main points you should always concentrate on that provides the strongest confluence and the best chance of causing price to reverse.
Here’s what they and how to use them.
Confluence Point #1: Psychological Levels
Here’s a quirky lil’ test for ya:
Open up the 1-hour chart on your favourite pair (as long as it’s one of the majors or minors – don’t try this on any exotics).
Now, mark an arrow or line on the point where the most massive reversals started.
Take a peek at the nearby prices… notice anything?
Spot anything odd or out of the ordinary?
Look a bit closer…
What you’ll find is this: The largest market reversals usually start either at or super close to psychological price numbers.
We’re talking prices ending in: 000, 0000, or 500.
Don’t believe me?
See for yourself…
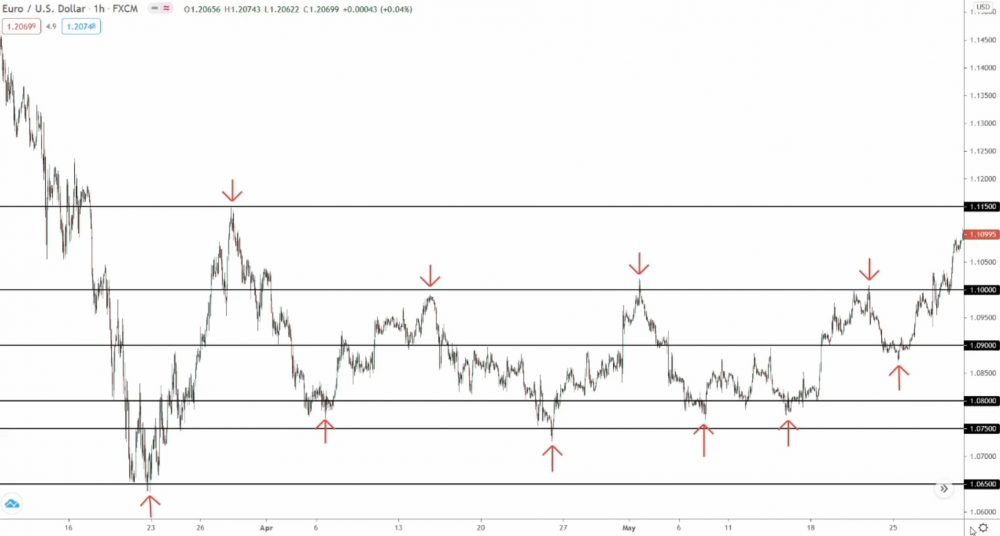
Every major reversal above began when the price either reached or came close to a psychological levels.
Coincidence?
Nah, it’s because psychological prices create some of the most potent points in the market!
Psychological levels act like magnets for buy and sell orders.
Loads of traders, both retail and institutional, place buy and sell orders at psychological levels, for two key reasons:
- #1: The whole number makes the order a cinch to remember.
- #2: The media hype around certain big round number figures.
I mean, c’mon…
How often do you see forex news talking about the price breaking through a psychological level?
Happens all the time, right?
So, heaps of traders place orders at these numbers.
Together, this causes thousands of orders to pile up at significant big round number price levels. The smart money (banks, hedge funds, etc.) can use these orders to get their trading positions going. Remember: Smart money traders need thousands of counteracting orders to execute their positions.
- To enter sell positions, SM needs a boatload of buyers (buy orders).
- To enter buy positions, SM needs a ton of sellers (sell orders).
And that’s why price reverses from psychological levels!
The smart money traders use the orders to help enter their own positions. They shove price into the orders, then use the liquidity to hop into their trades.
That’s why most significant reversals begin near round number prices.
Remember: Smart money traders CANNOT jump into a large trading position all at once. Their positions are so enormous that not enough traders exist on the other side to buy or sell at the current price. So, they gotta break their positions into smaller, more manageable chunks.
Consider supply and demand zones, for example:
The smart money places one position, then place the second later.
That’s why price returns to S & D zones – it’s the SM entering their 2nd position.
As a result, smart money traders are always on the lookout for points where hefty orders stack up. Then they use the orders to help enter their positions.
That’s why stop runs are so dang common:
The smart money (banks, hedge funds, etc.) uses the stops to enter more positions before the price reverses.
So, here’s the deal:
Because of how many orders pile up around psychological levels, they make the perfect spots for smart money to push the price and help enter their positions.
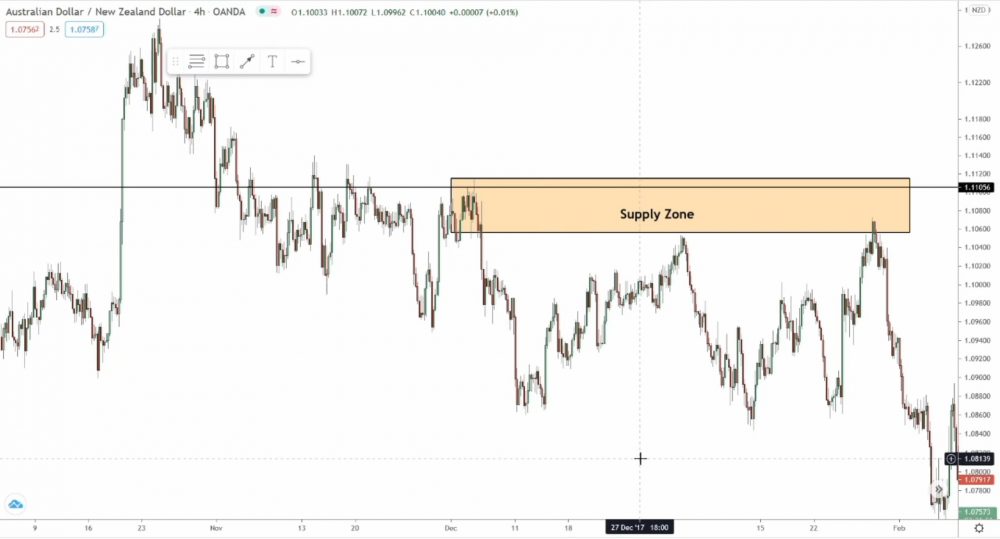
For instance, check out the chart below…
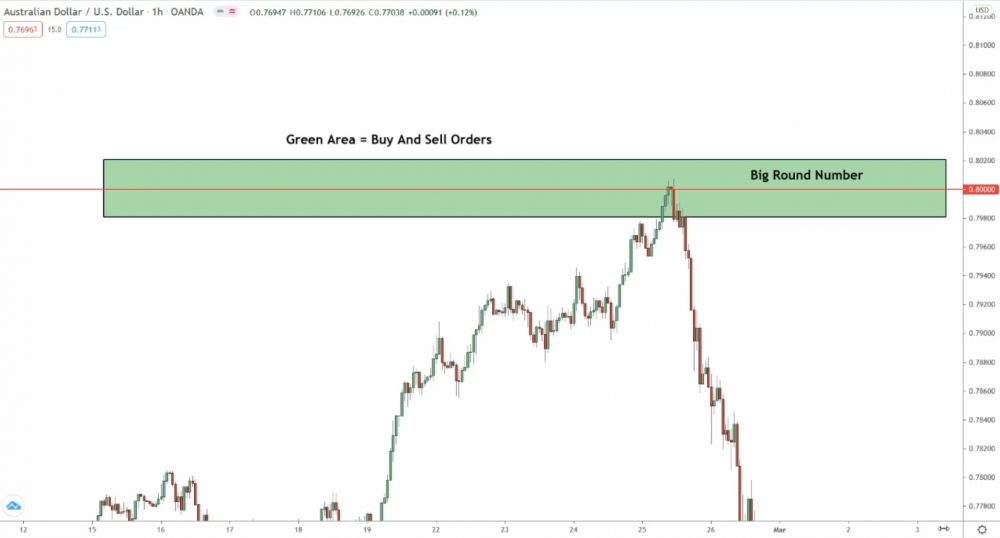
The shaded area above shows how orders cluster around psychological levels.
Once price returns, it smacks into these orders, and the smart money traders hop into their positions. Price then flips, and a huge down-move kicks off.
So, how do you use psychological levels with supply and demand zones?
Easy: Look for zones that form at or close to psychological levels.
If a supply or demand zone forms within 150 points of a psychological levels (Big Round Number), on either side; the two points have confluence.
Let’s zip through an example real quick…
Heads up: Psychological level confluence works best on timeframes below the 4-hour. Don’t bother with psychological levels on the daily or higher – the prices appear too squished together.
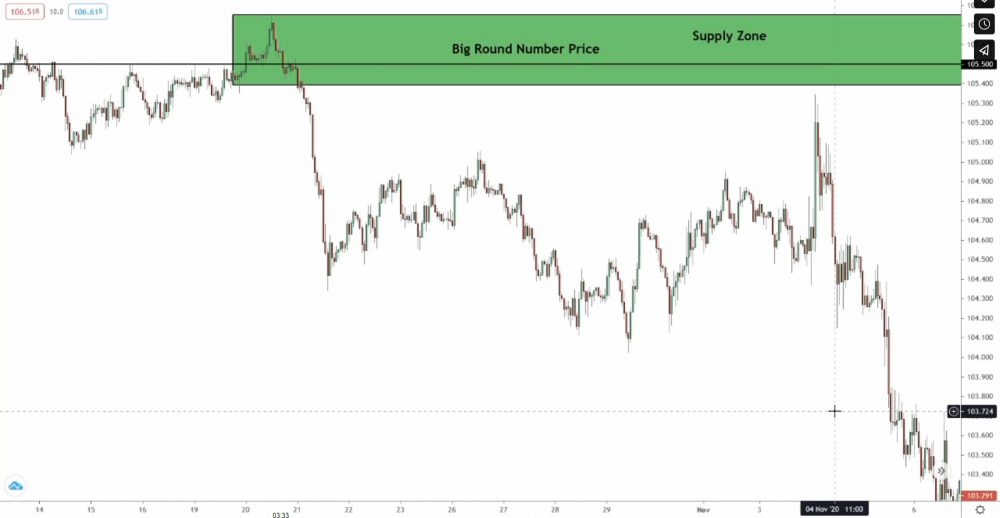
Check out this sweet 1-hour RBD zone on USD/JPY.
Notice how the 105.500 level lines up with our zone?
That’s what we call confluence!
The supply zone and psychological level are hanging out at the same spot.
Price has a way better shot at reversing when it comes back here, because there are more orders piled up thanks to the psychological level. The smart money traders can jump into much bigger positions, which seriously ups the odds of a reversal.
The outcome?
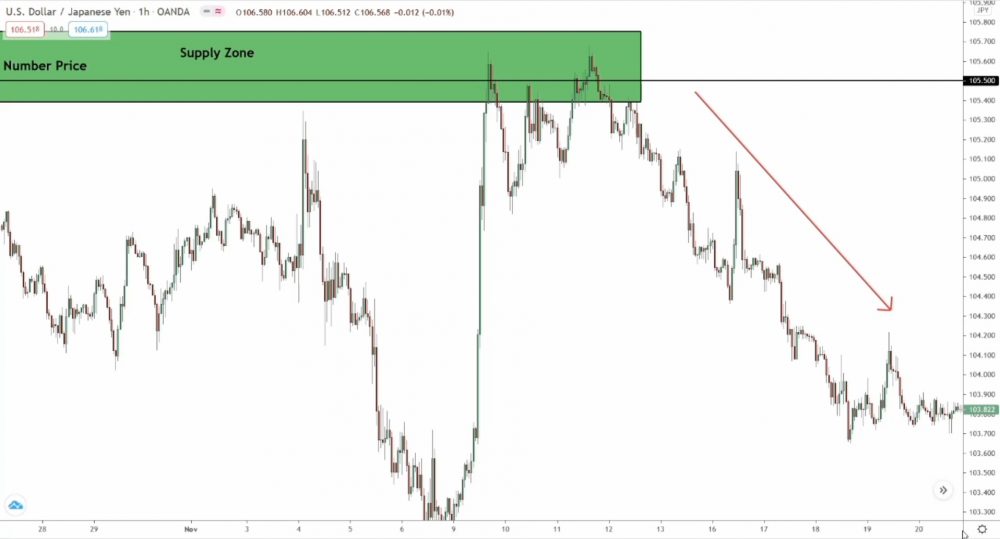
A whopper of a reversal when the price returns to the zone.
Pretty simple, huh?
Now, keep this in mind:
Just because an RBR zone forms at or near a BRN, that doesn’t automatically make the zone stronger than an RBD zone. The zone’s strength (the length of the move before it) trumps any confluence the zone has with other technical points.
Confluence is just there to back up what you think… NOT to overrule the basic rules of how supply and demand zones work.
So, remember this, not just with BRNs, but with the other points of confluence we’ve talked about.
Time for confluence point numero dos…
Confluence Point #2: Higher Timeframe Zones
Here’s another awesome point of confluence: Higher timeframe supply and demand zones.
You see, higher timeframe zones are generally stronger than lower timeframe zones. And this strength scales with the timeframe – the higher the timeframe, the stronger the zone.
But why’s that?
Well, it takes a whole lot more oomph (aka cash) to move the price on a higher timeframe (HT) than a lower timeframe (LT).
For the price to rise on the daily, the big shots (banks, hedge funds) need to buy a truckload from everyone selling on shorter timeframes, like the 4-hour, 1-hour, and even the minute timeframes.
That’s a ton of traders!
So, the smart money have to buy waaay more to push the price up on the daily chart compared to, say, the 1-hour chart. That’s because there are way more people selling in those faster timeframes than in the higher ones, all thanks to the longer time difference.
Now, here’s the real kicker:
Supply and demand zones are actually fractal patterns.
Lower timeframe zones both create and form inside higher timeframe zones.
For example: A daily demand zone is made up of multiple 1-hour demand zones, which themselves contain a bunch of 5-min zones, and so on…
So, when a lower timeframe zone forms within a higher timeframe (HT) zone, it usually packs a bigger punch than a zone that doesn’t form within a HT zone.
Why, you wonder?
Because: HT traders are expecting a price reversal from the HT zone.
And where do they wanna buy or sell? You got it!
The lower timeframe zone – the same spot where they bought or sold before to create that zone.
Here’s a quick example:
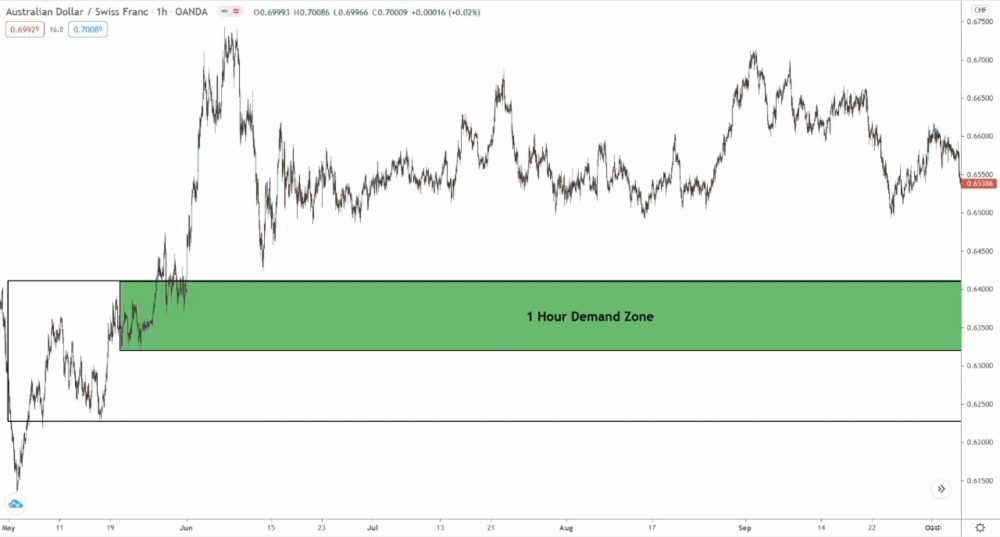
The 1-hour demand zone above formed within a larger daily demand zone (the black outline). If price swings back here, it’ll probably reverse inside the 1-hour zone.
Why, you ask?
Because that’s where the SM bought to create the daily zone.
So, our 1-hour zone’s got a pretty good shot at being successful.
It’s the most likely spot for those daily smart money traders to jump into any remaining trades they couldn’t place during the inital purchase.
Now, let’s see what goes down…
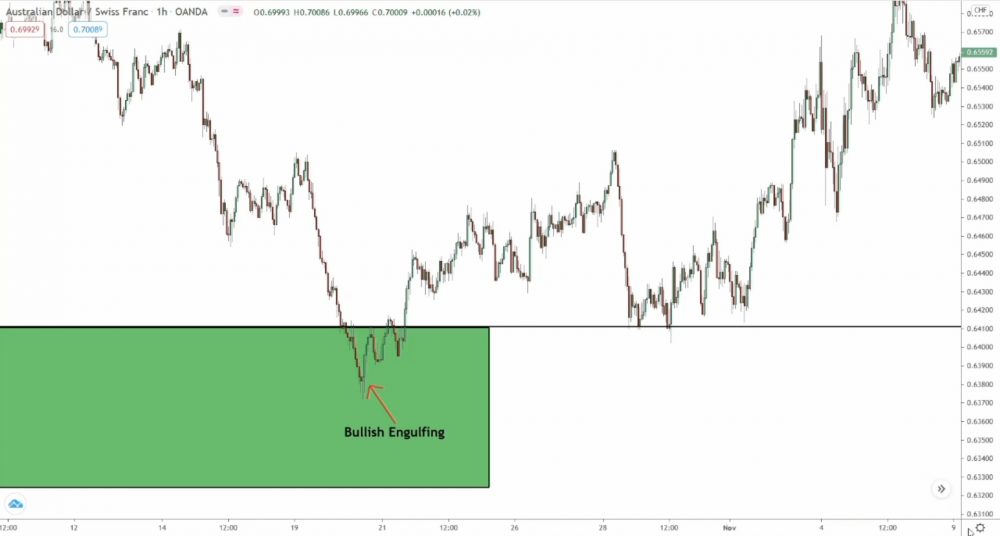
Price sneaks back into the daily zone and creeps into the 1-hour zone.
A big old bullish engulfing pattern (a sweet entry signal, amirite?) pops up, making the price reverse from both the 1-hour zone and the daily zone, and bam!
We’ve got ourselves a successful long trade.
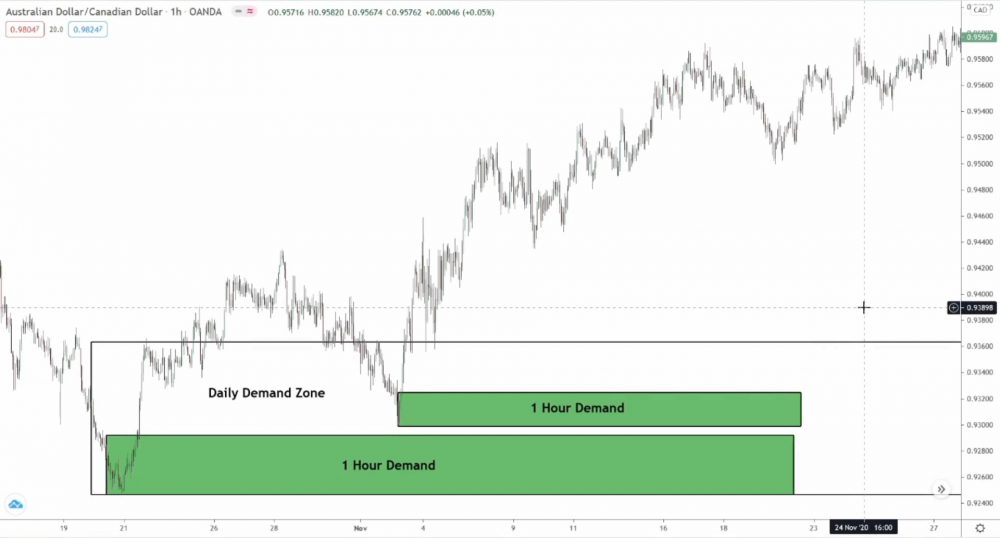
But wait, what if you’ve got a situation with multiple lower timeframe zones nestled within the higher timeframe zone?
What’s the game plan then?
In this case, you’ve got a couple of options:
- Trade the zones individually,
- Or just stick to trading the HT zone.
There are pros and cons to both, my friend:
When trading the LF zones individually, there’s always that chance price might dance between the zones – a pretty common scenario. But hey, look on the bright side: you’ll actually be cutting down on your risk exposure.
You won’t have to stress about covering the gap between zones or the area that stretches out to the latest daily zone’s swing high or low.
That’s the trade-off with each option.
In my humble experience: Stick to trading the HT zone when you’ve got two or more LT zones forming within an HT zone.
While you can trade LT zones individually, price often decides not to reverse at the zones.
Instead, it reverses in the gap or in the space between the swing high or low, leaving you hanging or losing money.
So, just trade the HT zone when you’ve got multiple LT zones all inside.
Sure, the risk goes up a notch, but at least you’ll get in when the price reverses. Can’t always say that when trading the LT zones – one of the main downsides.
Heads up: To use HT zones as confluence with LT zones, only pair specific timeframes with each other.
For instance:
Don’t go hunting for 5-min zones within daily zones – you’ll end up with a gazillion tiny zones!
Here’s the combos I usually roll with:
- 1-hour & daily = Watch for 1-hour zones inside daily zones.
- 15-minute & 1-hour = Watch for 15-min zones inside 1-hour zones.
- 5-minute & 15-minute = Watch for 5-min zones inside 15-min zones.
Other timeframes?
Meh, not so much.
They’re either too short, like the 1-minute chart, or too long, like the weekly and monthly. You’ll wind up with a whole heap of zones overlapping, so using them for confluence ain’t the brightest idea.
Alrighty, here’s our final point of confluence…
Confluence Point #3: Support And Resistance Levels
And finally, drumroll please… Our last point of confluence to watch for supply and demand zones: Support and resistance levels!
Support and resistance levels?
Yeah, they’re pretty basic stuff.
For those not in the know: Support and resistance levels are lines that pinpoint where price has a high chance of reversing.
Picture supply and demand zones, but swap zones for lines.
That’s S/R in a nutshell – same idea, different style.
Since support and resistance levels and supply and demand zones are like two peas in a pod (both form from the smart money buying and selling), these levels make fab confluence points to keep an eye on alongside zones.
Ready to put these levels to work?
Here’s the game plan:
Using support and resistance levels as confluence is similar to using those psychological levels from earlier.
- Mark a zone on the chart.
- See if an S/R level zips through or hangs out nearby.
- Then, jump in using the standard S/D rules.
And that’s all there is to it!
If a level strikes through the zone or happens to be nearby, like in the example above, they’ve got confluence. The level’s flashing a sign that smart money traders (banks, hedge funds, etc.) are active around the zone, which means the odds of a reversal are higher.
But hey, don’t forget this one key point:
You should only consider the support or resistance level legit if price failed to break through the level during the two (or more) most recent touches.
No unbroken touches?
Well, the level loses its cmojo – it’s invalidated.
Support and resistance levels form because of smart money traders placing huge positions, just like supply and demand zones. The difference? The levels mark a spot (a price) where orders are quietly piling up behind the scenes, kind of like psychological levels, but with waaay fewer orders.
Smart money traders nudge price towards these levels to help enter their positions – that’s why price reverses from S&R levels more than once.
The smart money enter using orders built up around the level.
So, why do so many orders gather at S&R?
Mainly because support and resistance levels are famous these days.
The idea of support and resistance has become such a big deal for traders that many will place buy and sell orders at these levels, expecting price will reverse. And sometimes it does, which just reinforces their belief in the level’s validity.
In a way, the S&R turns into a self-fulfilling prophecy:
- People believe the levels exist, so orders pile up.
- Smart money traders use those orders to help enter positions.
- Price reverses, which validates S&R levels in traders’ minds.
Now, here’s a critical nugget:
When the smart money uses a support or resistance level to enter a major trading position, they always chop the position into smaller bits to reduce the number of traders required on the other side of the trade.
Yup, same as S&D zones.
On a chart, this position slicing looks like the price failing to break a level once, twice, or even three times. After cutting up the position, the SM execute the first trade, causing a bounce from the level. They then enter the second position near the same spot, leading to another bounce pretty soon after.
By doing this – executing the second trade at a similar price – the smart money mimic the effect of placing a single, massive position at one specific price.
That’d be their dream scenario if enough buyers or sellers were up for grabs.
Each failed break = banks making another trade.
Check it out below…
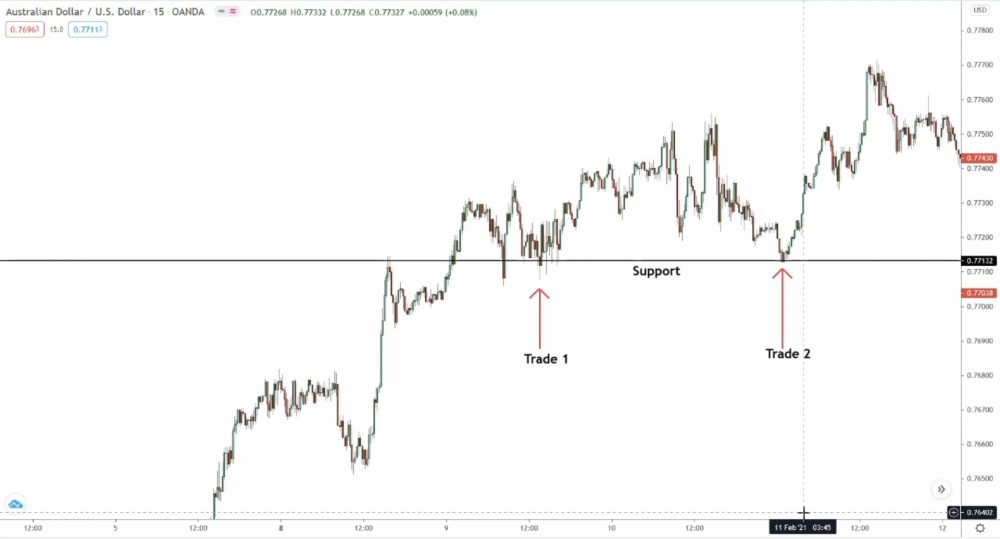
- Trade 1 caused the 1st bounce, which was minor.
- Trade 2 created the 2nd bounce, which caused price to reverse.
If a demand zone lines up with a support level or forms nearby, you can be extra confident price will flip when it returns: You know the smart money have already entered trades that caused the two previous bounces.
For these trades to remain open, SM must make price reverse from the zone.
Otherwise, they’ll lose money.
Moving forward…
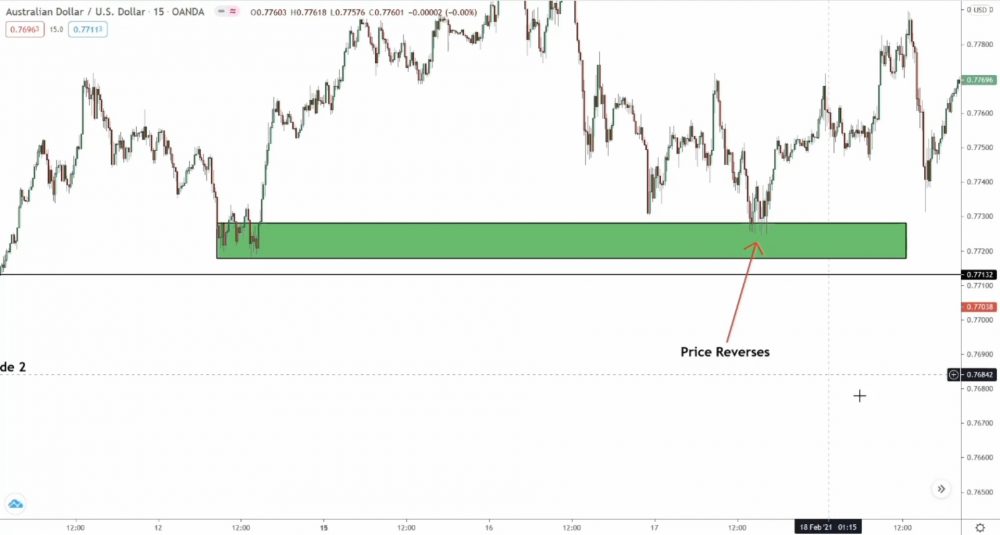
A demand zone pops up just a few pips above the support level, and then – whoosh – price reverses after coming back a short time later.
But why did the price do a 180 here?
Well, because the smart money jumped into more trades.
Those bounces from support? Those were their first couple of trades. And then, the demand zone plus the return happened because they entered their biggest trades.
That’s why the reversal kicked off once the price reached the zone.
Get how support and resistance levels provide confluence now?
These levels give us a peek into where (and when) the smart money is placing trades – or doing other trading stuff, like cashing in profits. When an S/R level shows up near or in line with a zone, you can bet your bottom dollar the SM already have their trades locked and loaded.
That’s what those two or more unbroken touches are telling us!
If a level hangs out with a zone, it boosts the odds of a reversal.
Go ahead, take a look back at some S & R levels near S & D zones, and you’ll see this with your own eyes.
Zones in-line with or nearby unbroken S/R levels (with at least 2 touches) usually result in some pretty big reversals. Why?
Because the smart money have placed a whole bunch of trades to make price reverse.
That, my friends, is why you see the touches and the price create and then bounce back from the zone.
The Bottom Line
So there you have it – the three main points of confluence to keep an eye on for S & D zones.
Give these a look when you spot a zone forming – they’ll help you find higher probability zones. Of course, they won’t work all the time – hey, that’s trading for you; nothing’s set in stone. But they’ll definitely give your zone a little boost in power.

Grab Your FREE E-Book:
5 Pro Rules For Trading Supply And Demand
- Master the core principles of supply & demand.
- Advanced techniques for trading SD zones.
- Exclusive new lessons/books/tools every week!
Sign Up Now To Download Your FREE Guide:
🛡️ Spam-Free Promise: No spam, ever. We'll only send you relevant updates and content. Unsubscribe at any time.