
Ever seen price return to a supply or demand zone, fail to form a pin bar or engulfing pattern, but then reverse anyway?
Ugh, yeah – so annoying, right?
This happens way too often when trading supply and demand, but hey, there’s a way to get in on those zones…
You see, while most supply and demand traders only use pin bars or engulfing candles as their go-to entry signals, there are actually 3 other signals you can use – and they’re pretty darn awesome.
In this post, I’m going to break down these entry patterns and show you how to use them to get into supply and demand zone trades.
Let’s kick things off with pattern #1:
Entry Pattern #1: Large Range Candlesticks
Pop open those charts and find a recent big rise or decline.
Got one?
Sweet!
Now, take a look at the candles that make up that rise or decline. Notice how two or three chunky candlesticks usually show the movement?
Candles like these, for example…
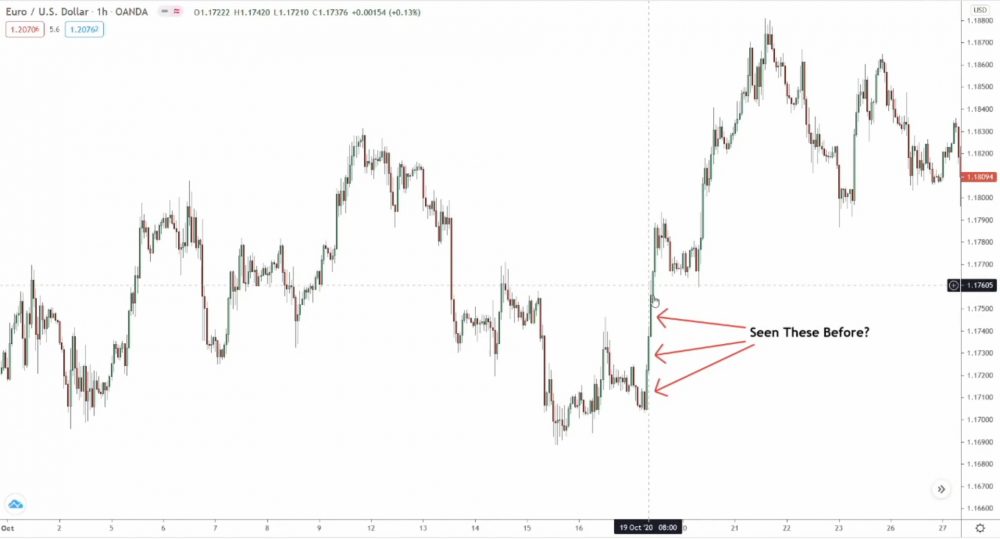
Seen these before?
Though they might seem pretty ordinary, large body candlesticks like these play a crucial role in the market. They reveal the buying and selling of other traders, specifically, the smart money traders (banks, hedge funds, you know the drill).
These fellas also have a nickname: Large Range Candlesticks – or LRCs for short.
Most traders don’t give large range candlesticks the attention they deserve, mainly because they show obvious price information:
A large price change happened – hence their size.
But hold up!
LRCs aren’t just about a massive price change on the surface.
Behind the curtain, large range candlesticks reveal when and where the smart money traders enter the market and get down to business.
Most often, this happens when they form at supply and demand zones.
So, what do LRCs tell us about the SM?
In short: The candles reveal when the SM’s large trading positions bulldoze the opposing side, making a price reversal way more likely.
For instance…
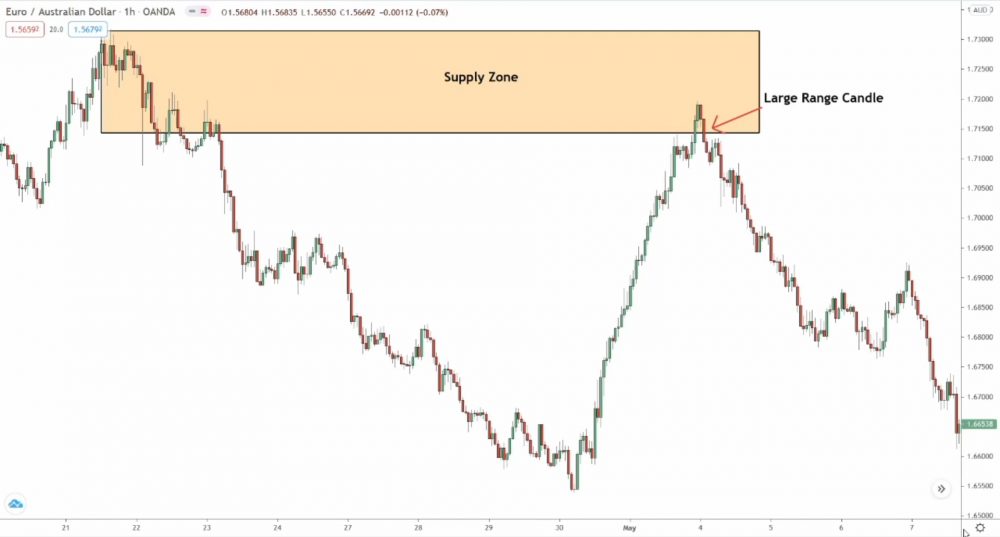
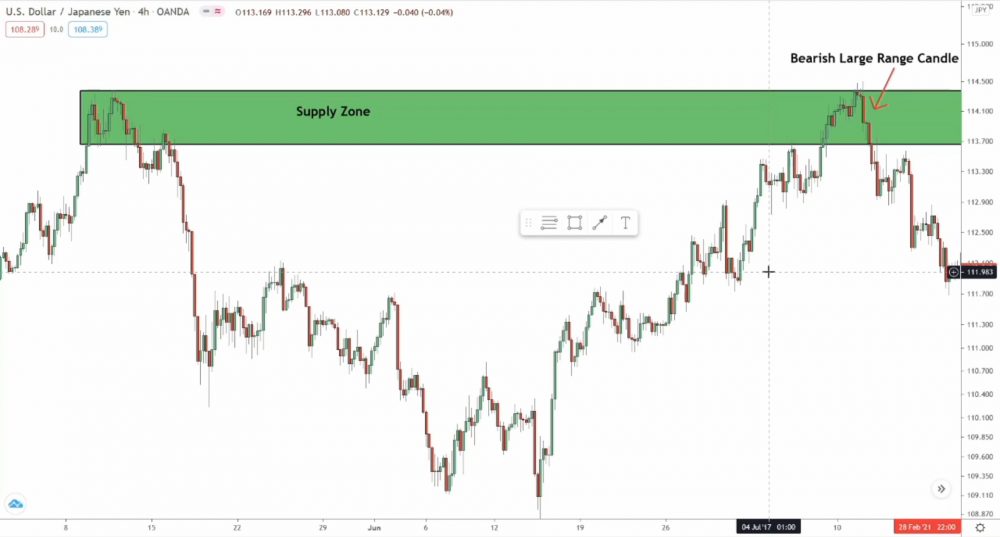
Check out the supply zone… notice how the price didn’t reverse from the zone until after a bearish large range candle formed?
Before the LRC, no real signs of a reversal appeared.
Nothing was happening!
Sure, a teeny-weeny pin bar showed up.
But other than that, no other price action patterns or signals hinted that the price would reverse from the zone and head south. Nothing until the bearish large range candle came along. Why? Because the SM’s positions hadn’t yet overpowered the other side!
For price to fall, sell orders have to become bigger than buy orders.
So, the smart money traders’ sell positions (sell orders) need to overwhelm the buy positions (buy orders) coming from traders buying.
Then, and only then, will price reverse.
Large range candles reveal the exact moment that happens.
The tipping point where the sells become bigger than the buys, causing price to nosedive – the decline comes from the sell positions outweighing the buy positions.
Engulfing patterns form under the same process:
– buys outweighing sells and vice versa
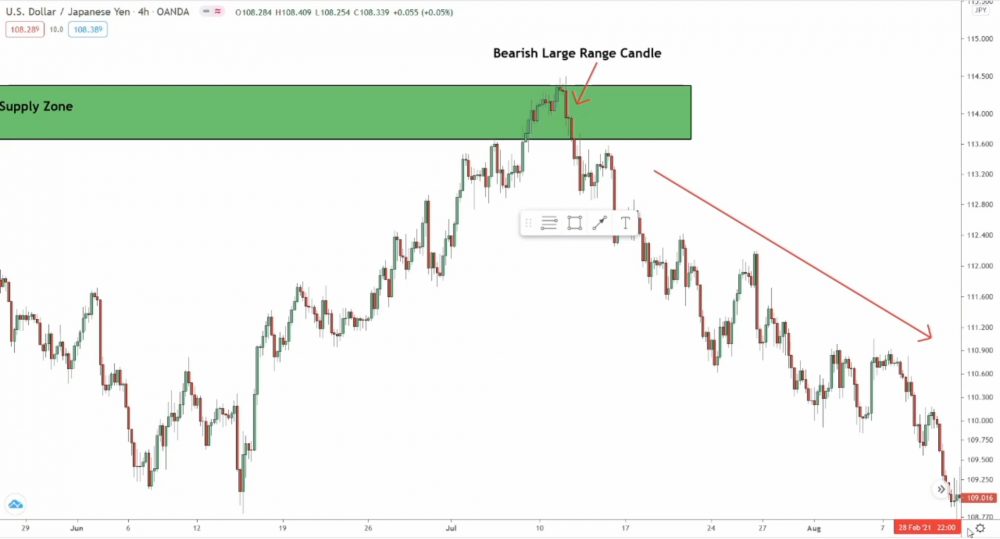
Here’s another one for ya…
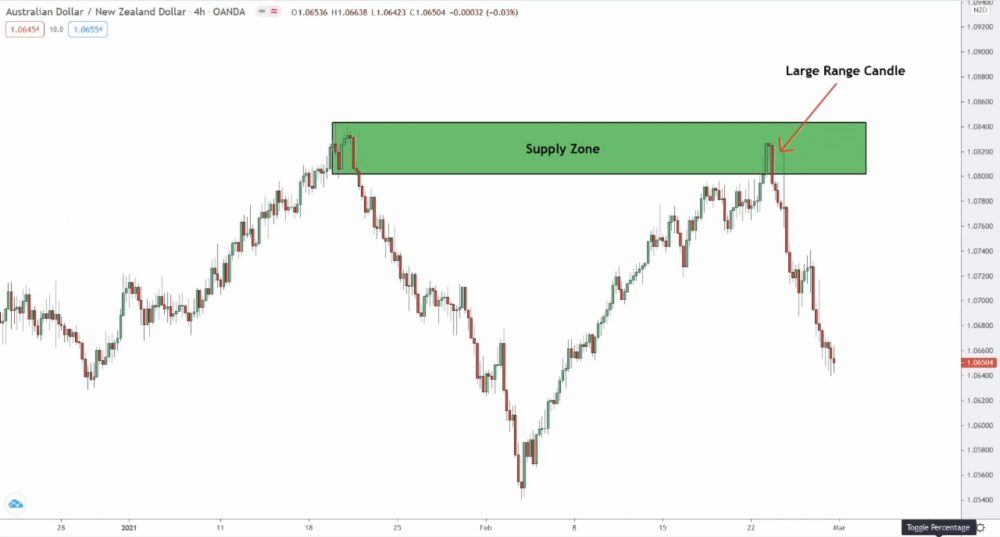
Price only reverses from the supply zone after a bearish, large range candle forms.
And why’s that?
Yup, you got it: Because that’s when the SM’s sell positions (sell orders) become bigger than the buy positions (buy orders) from traders buying.
Once the sell orders get bigger, price tanks.
The outcome?
A bearish, large range candle forms.
Easy, right?
The same thing happens when price reverses from supply and demand zones: price only fully reverses after a large range candle shows up. A price action signal/pattern might kick off the reversal, but it’s only after a huge LRC candle forms the reversal actually begins.
So, I guess the burning question now is…
How do you use LRC’s to jump into supply and demand trades?
The answer…
Just like you’d use pin bars and engulfing patterns – large range candles use the same rules and entry guidelines as all those other patterns.
Let’s take a gander…
How To Trade Supply And Demand Zones With Large Range Candlesticks
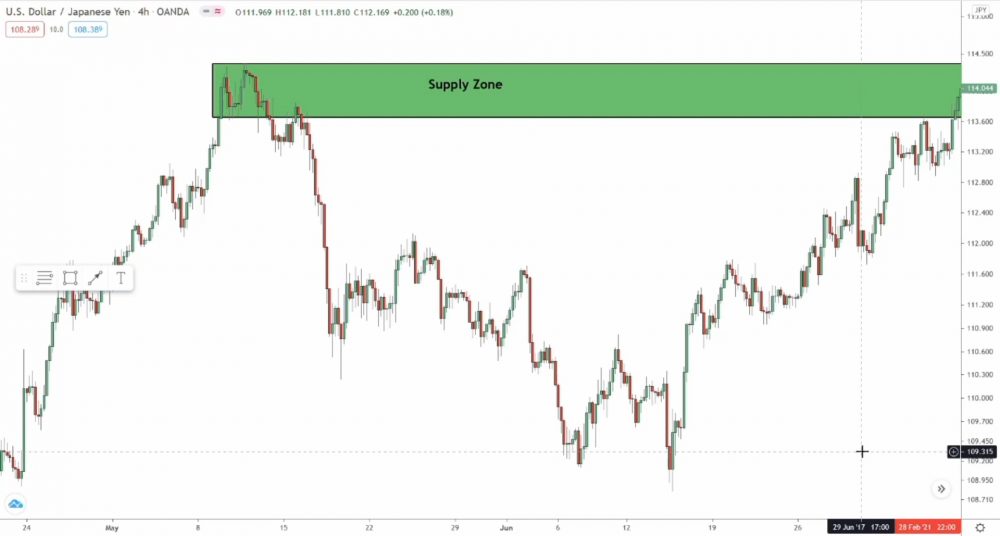
The pic above shows a supply zone on the 1-hour chart of USD/JPY.
Price moves into the zone, but hasn’t quite formed a rock-solid entry signal yet.
Sure, there are a few teeny-tiny pins and engulfs, but in this case, these signals just don’t cut it – way too small! Normally, you’d skip this trade, but now you can keep an eye out for a bearish large range candle and use that as your entry confirmation signal instead.
And guess what happens…
Price takes a sharp dive, causing a bearish large range candle to form.
The candle gives the nod that the SM wants the price to reverse.
Now you jump into a short trade (wait for the candle to close first), then place your stop loss just above the upper edge of the zone.
Quick Point: The stop loss size on a Large Range Candle entry will usually be bigger than using a pin bar or engulf entry. The candle covers more ground, so your stop must be placed further away from your entry price to compensate.
Moving right along…
You can see that after the LRC formed, price kept on falling – the entry signal got us into a sweet short trade!
Now you snatch those profits as the price drops.
Piece of cake!
See how LRC’s can get you into supply and demand zone trades now?
Use large range candles when there’s no other clear signal in sight – like a pin bar or engulfing pattern – or when you’re craving some extra confirmation for your entry.
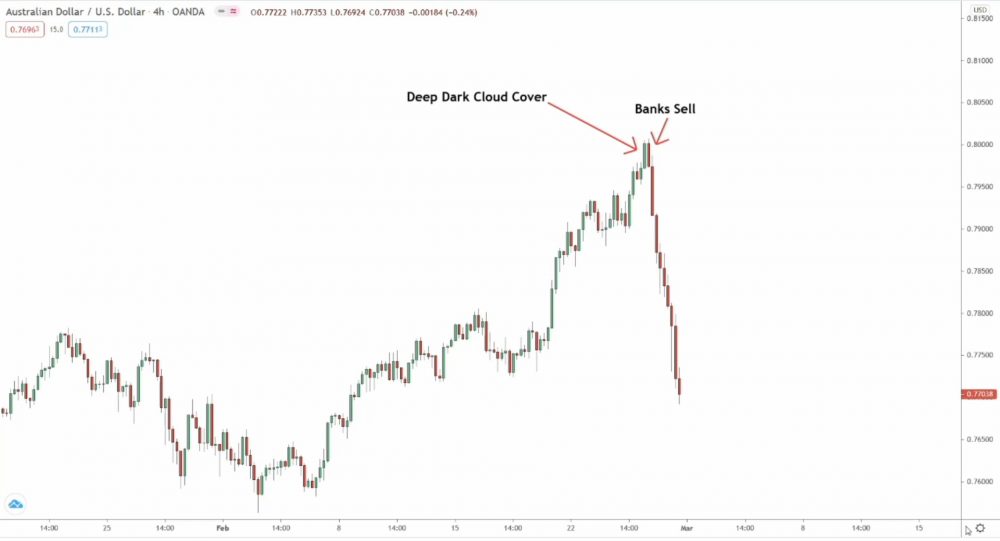
Entry Pattern #2 Deep Dark Cloud Cover/Piercing Pattern
Large range candles are great for confirming entry into more supply and demand zone trades. But hey, there’s another entry signal you can use:
Deep Dark Cloud Cover and Piercing Patterns.
Ringing any bells?
Dark Cloud Cover and Piercing Patterns pop up everywhere in forex. You’ll find these patterns talked about all the time on price action sites and candlestick patterns. But here’s the kicker: I’m not showing you the run-of-the-mill dark cloud cover and piercing patterns, no siree!
NOPE!!
I’m revealing the “Deep” variation – a special type for trading S/D.
This deep version of these patterns closes way deeper into the prior candle – hence the name – which hints at the smart money traders jumping into significant trading positions.
Ready to see how these patterns work their magic?
Let’s get this show on the road…
What Are Deep Dark Cloud Cover And Piercing Patterns?
Deep Dark Cloud Cover and Piercing Patterns show up as a two-candle reversal pattern, kind of like their cousins, bullish and bearish engulfing patterns.
- The Deep Dark Cloud Cover = Bearish
- The Deep Piercing Pattern = Bullish
Made up of two opposing candles, these patterns take shape when the price almost engulfs the previous candle, but doesn’t quite close all the way. The 2nd candle ends up closing past the prior candle, not quite creating an engulf, but still showing the SM (smart money) cut deep into over the other side.
Here’s what a Deep Dark Cloud Cover looks like…
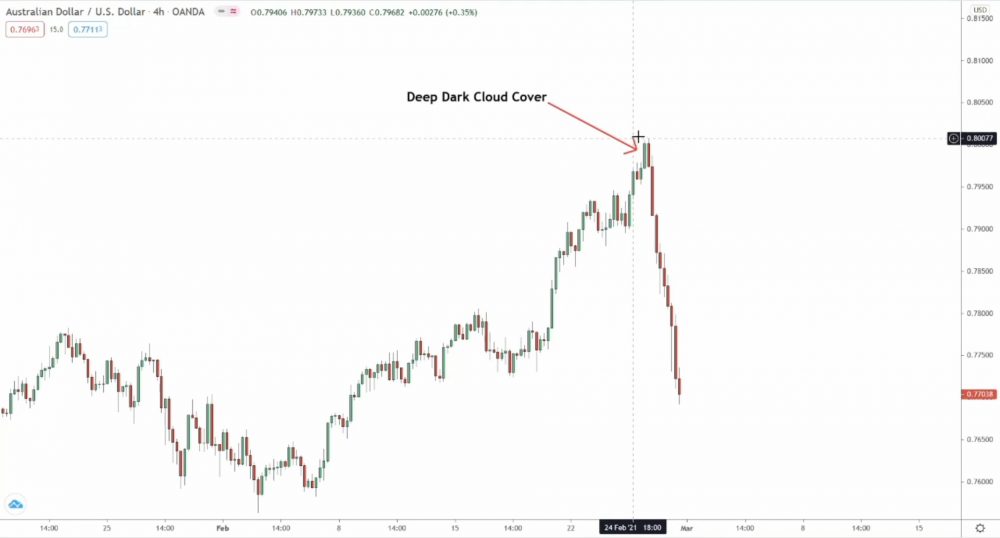
Keep an eye out for this pattern in supply zones.
This pattern forms when the price shoots higher, creating a large bull candle, but then declines on the next candle, stopping just short of creating a bearish engulfing pattern.
What this pattern tells us is that the SM (smart money) is likely entering major sell positions, which is why the price drops deep into the first candle.
For a legit Deep Dark Cloud Cover to form, look for the following:
- A huge bullish first candle – the bigger, the better.
- The 2nd candle MUST close deep (but not engulf) into the first.
Now let’s chat about the Piercing Pattern…
The Piercing Pattern signals an upswing, so keep an eye out for this pattern forming inside demand zones.
This pattern forms just like the Deep Dark Cloud Cover – only flipped the other way around.
After a drop and the creation of a large bearish candle, price shoves deep into the body on the next candle. The resulting pattern looks like a bullish engulfing that didn’t quite manage to engulf the 1st candle in the pattern.
For a valid Deep Dark Cloud Cover to form, watch for the following:
- A gigantic bearish first candle – again, size matters.
- The 2nd candle MUST close deep into the first.
So, what makes these two patterns so awesome for diving into supply and demand trades? Well, it’s really all about the fact price pushes so deep back into the range of the first candle.
For instance…
The Deep Dark Cloud Cover pattern forms when price skyrockets, which gets a bunch of uninformed traders to buy – hello, FOMO!
Then, price falls back to the open.
What gives?
The smart money are selling into the buying frenzy.
The break higher hands the SM a boatload of buyers to fill their positions with – after all, sellers need buyers, right?
Once the SM hops in, price plunges deep into the previous candle, not quite enough to make an engulfing pattern – which forms the same way – but enough to hint that the SM wants price to head south.
Piercing Patterns?
They follow the same plan, just… flipped around.
The smart money buys into the selling instead of selling into the buying.
That’s why these two patterns are fantastic supply and demand entry confirmation signals: The patterns confirm the SM hopping into positions, making a reversal from the zone more likely.
How To Trade Supply And Demand Zones Using Deep Dark Cloud Cover And Piercing Patterns
You know what’s awesome about the Deep Dark Cloud Cover and Piercing Pattern? Both patterns are super easy to spot and use with supply and demand zones.
All you gotta do is…
- Wait for the price to enter a zone
- Keep an eye out for a pattern forming
- And jump in!
Setting up a stop loss and taking profits follows the same S/D guidelines. The stop goes either above or below the zone, and you take profits using your own method or what I explained earlier.
Let’s walk through a quick example…
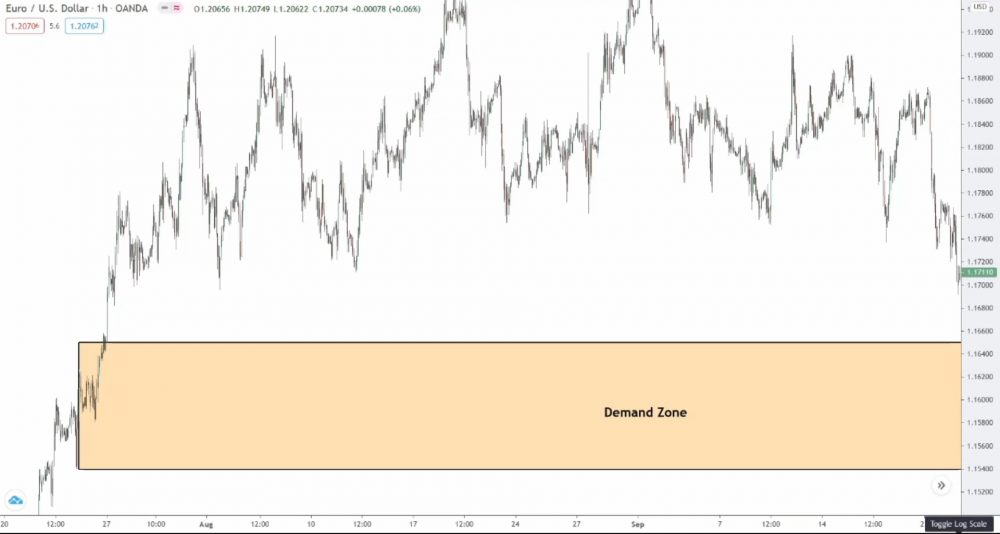
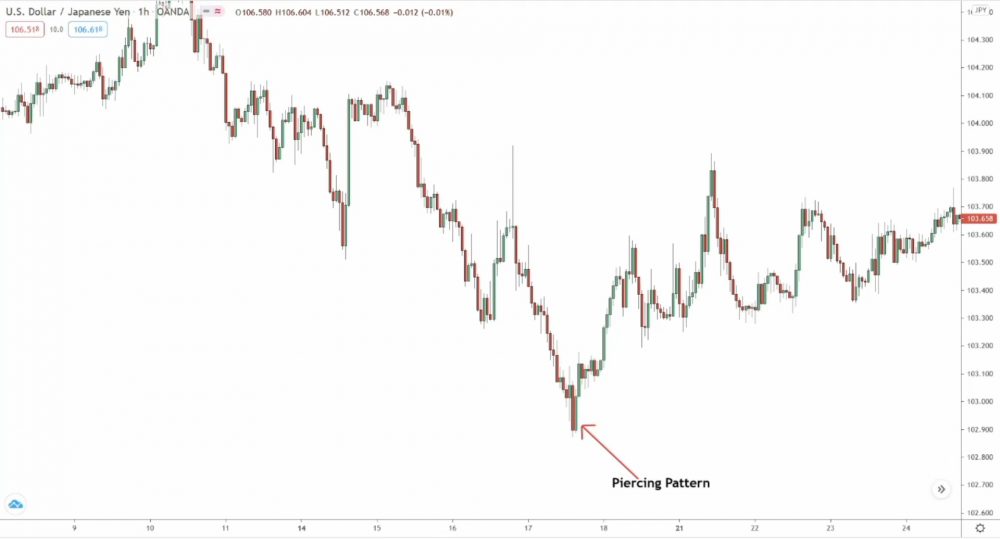
The price just entered this 1-hour demand zone.
So far, there’s no valid entry signal in sight; no pin bars, no engulfing patterns – at least, no biggies.
But hold up, what’s this…
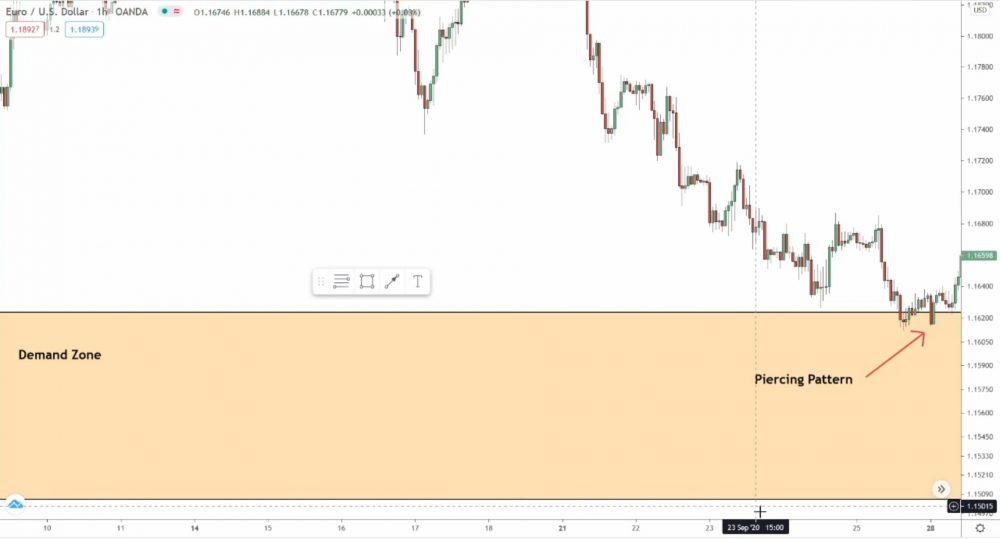
A Piercing Pattern pops up inside the zone – and it’s a whopper!
The pattern suggests that the smart money traders might’ve entered some hefty buy positions inside the zone; I mean, how else could price climb after dipping lower?
Alright, time to dive into our long trade.
Like all two-candle patterns, always wait for the 2nd candle to close – the one that closes deep into the first – before entering. The close confirms the pattern’s legit, meaning the entry signal’s good to go.
Once you’re in, place the stop on the opposite side of the zone.
Next, take profits as price reverses.
And, as you can see…
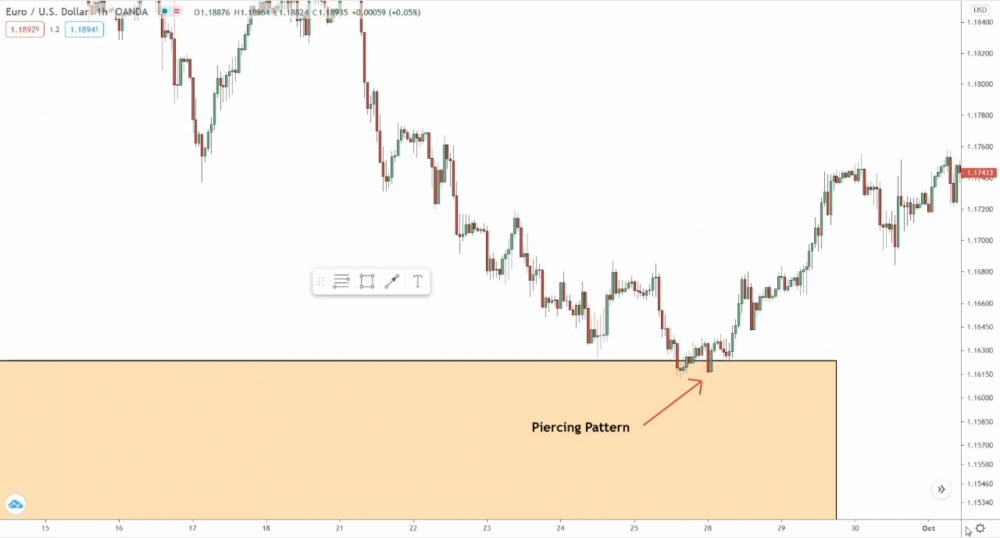
After the pattern shows up, the price does a 180; putting us in a sweet reversal trade.
Pretty rad, huh?

Grab Your FREE E-Book:
5 Pro Rules For Trading Supply And Demand
- Master the core principles of supply & demand.
- Advanced techniques for trading SD zones.
- Exclusive new lessons/books/tools every week!
Sign Up Now To Download Your FREE Guide:
🛡️ Spam-Free Promise: No spam, ever. We'll only send you relevant updates and content. Unsubscribe at any time.